
Overview
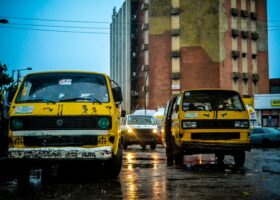
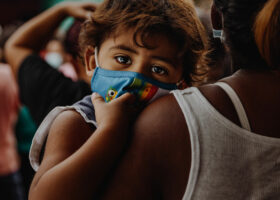
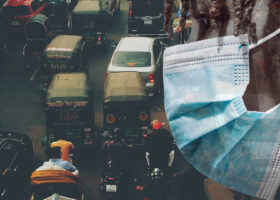
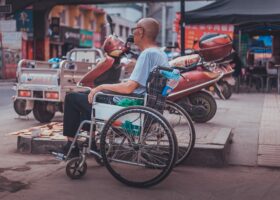
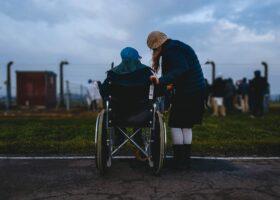
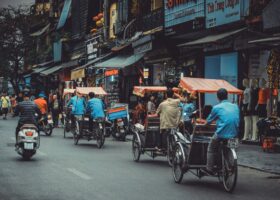
Transport and mobility options for elderly and individuals who need assistance are very limited. The COVID-19 pandemic has worsened the situation by many folds. This research mainly focuses the travel behaviour issues of such individual elderly, and people having mobility challenges; to know their coping strategies, to contribute to the knowledge base and raise the concerned issues in governance and policy spheres. This study will provide an excellent opportunity to compare and contrast travel behaviour, practice and strategies for elderly and physically challenged people of different culture, geography and policy diversity during COVID-19.
Publications with the same themes

Publications with the same study countries
Related news & events
News
Blog
Blog
News
News
News
Blog

News
Blog
Blog
PDF content (text-only)
COVID-19 Response & Recovery Transport Research Fund FINAL REPORT: Impact of COVID-19 on the mobility of physically challenged people and older people May 2021 HVT029.L1M086 – Prof. Dr M. Shafiq-Ur Rahman This research was funded by UKAID through the UK Foreign, Commonwealth & Development Office under the High Volume Transport Applied Research Programme, managed by IMC Worldwide. The views expressed in this report are those of the authors and do not necessarily reflect the UK government’s official policies, nor those of any individuals and organisations referred to in this report. IMC Worldwide Ltd, the HVT Programme and the UK government shall not assume any responsibility for the results of works based on the use of this report. Users accept this publication is a guidance document only. Users accept that they need to take their own technical and legal advice before issuing Agreements, Terms and Conditions and other legally binding documentation related to implementing any recommendations. Reference No. HVT029.L1M086 Lead Organisation/ Consultant Prof. Dr M. Shafiq-Ur Rahman Partner Organisation(s)/ Consultant(s) Title Impact of COVID-19 on the mobility of physically challenged people and older people Type of document Project Report Theme Gender, inclusion, vulnerable groups Sub-theme Policy regulation Author(s) M. Shafiq-Ur Rahman Lead contact Prof. Dr M. Shafiq-Ur Rahman Geographical Location(s) Bangladesh, Pakistan, Tanzania, Zambia Abstract Transport and mobility options for elderly and individuals who need assistance are very limited. The COVID-19 pandemic has worsened the situation by many folds. This research mainly focuses the travel behaviour issues of such individual elderly, and people having mobility challenges; to know their coping strategies, to contribute to the knowledge base and raise the concerned issues in governance and policy spheres. This study will provide an excellent opportunity to compare and contrast travel behaviour, practice and strategies for elderly and physically challenged people of different culture, geography and policy diversity during COVID-19. Keywords Mobility, disability, elderly, aged, travel, trip, transport, COVID-19 Funding UKAid, FCDO Acknowledgements Transport Research and Development (TRaD) Limited Bangladesh for assistance while collecting field data Cover Photo Credit: M. Shafiq-Ur Rahman / Mustafizur Rahman i FINAL REPORT: IMPACTS OF COVID-19 ON MOBILITY OF PHYSICALLY CHALLENGED PEOPLE AND OLDER PEOPLE CONTENTS Executive Summary vi 1. Introduction 1 1.1 Background 1 1.2 Relevant literature 1 1.3 Project aims and objectives 2 1.4 Transport measures taken by the cities and authorities during COVID-19 3 1.5 Alignment with the HVT research themes, priorities and programme objectives 3 1.6 Alignment with FCDO priorities 3 2. Methodology 4 2.1 Summary of approach 4 2.2 Methods and techniques 4 2.3 Innovation in this research 5 2.4 Risks and mitigations 6 2.5 Ethical review 6 2.6 Quality assurance 6 3. Implementation 7 3.1 Description of the case study cities and COVID-19 situation 7 3.2 Activities conducted 8 3.3 Target groups 9 3.4 Data analysis 9 4. Findings from Bangladesh 11 4.1 Socio-economic profile of the respondents 11 4.2 Mobility and trips during COVID-19 (post-lockdown) 12 4.3 Mobility and trips during lockdown 15 4.4 Mobility and trips before COVID-19 18 4.5 Changes and difficulties due to COVID-19 21 5. Findings from Pakistan 26 5.1 Socio-economic profile of the respondents 26 5.2 Mobility and trips during COVID-19 (post-lockdown) 27 5.3 Mobility and trips during lockdown 30 5.4 Mobility and trips before COVID-19 32 5.5 Changes and difficulties due to COVID-19 34 6. Findings from Tanzania 41 6.1 Socio-economic profile of the respondents 41 6.2 Mobility and Trips During COVID-19 (Post-Lockdown) 42 6.3 Mobility and trips during lockdown 45 6.4 Mobility and trips before COVID-19 47 6.5 Changes and difficulties due to COVID-19 49 7. Findings from Zambia 54 7.1 Socio-economic profile of the respondents 54 7.2 Mobility and trips during COVID-19 (post-lockdown) 55 7.3 Mobility and trips during lockdown 58 ii FINAL REPORT: IMPACTS OF COVID-19 ON MOBILITY OF PHYSICALLY CHALLENGED PEOPLE AND OLDER PEOPLE 7.4 Mobility and trips before COVID-19 60 7.5 Changes and difficulties due to COVID-19 62 8. Summary of the findings and comparison 67 8.1 Mobility and trips before COVID-19 67 8.2 Mobility and trips during COVID-19 68 8.3 Changes in mobility and trips due to COVID-19 70 8.4 Travel difficulties of elderly and physically challenged people in LICs 72 8.5 Reflections 73 9. Conclusion and research uptake 75 9.1 Research uptake/ dissemination activities 75 9.2 Low-income countries planned for upscale 75 9.3 Planned next steps 75 9.4 Conclusion 76 10. References 77 APPENDICES Appendix A: City profile / description of the city 80 Appendix B: Neighborhood locations of household survey 90 Appendix C: Questionnaire for data collection 93 Appendix D: Sample size from online survey 95 Appendix E: Socio-econoic profile of the respondents 96 TABLES Table 1: Summary of the case study cities and COVID-19 lockdowns 7 Table 2: Household sample distribution from different city 8 Table 3: Household vehicle ownership of respondents in Dhaka and Khulna city 11 Table 4: Respondent’s travel frequency in Dhaka and Khulna city during COVID-19 post-lockdown 12 Table 5: Respondent’s trips in Dhaka and Khulna city in the previous week 13 Table 6: Trip characteristics in Dhaka and Khulna post- COVID-19 lockdown 13 Table 7: Travel frequency of respondents, Dhaka and Khulna city during lockdown 15 Table 8: Characteristics of trips, Dhaka and Khulna city during lockdown 16 Table 9: Reason for travel mode, Dhaka and Khulna city during lockdown 18 Table 10: Respondent’s frequency of trips, Dhaka and Khulna city before COVID-19 18 Table 11: Trip characteristics, Dhaka and Khulna city before COVID-19 19 Table 12: Respondent’s household vehicle ownership, Karachi and Lahore city 27 Table 13: Respondent’s travel frequency, Karachi and Lahore during COVID-19 post-lockdown 27 Table 14: Respondents’ trips, Karachi and Lahore city, in the previous week 28 Table 15: Trip characteristics, Karachi and Lahore during COVID-19 post-lockdown 28 Table 16: Respondent’s travel frequency, Karachi and Lahore city during lockdown 30 iii FINAL REPORT: IMPACTS OF COVID-19 ON MOBILITY OF PHYSICALLY CHALLENGED PEOPLE AND OLDER PEOPLE Table 17: Trip characteristics, Karachi and Lahore city during lockdown 31 Table 18: Respondent’s travel frequency, Karachi and Lahore city before COVID-19 32 Table 19: Trip characteristics, Karachi and Lahore city before COVID-19 33 Table 20: Trips per person, Karachi and Lahore city 34 Table 21: Reason for selecting travel mode, Karachi and Lahore city 35 Table 22: Respondent’s household vehicle ownership, Dar-es-Salaam and Zanzibar 41 Table 23: Respondent’s travel frequency, Dar-es-Salaam and Zanzibar city during COVID-19 post-lockdown 42 Table 24: Respondent’s trips, Dar-es-Salaam and Zanzibar previous week 43 Table 25: Trip characteristics, Dar-es-Salaam and Zanzibar during COVID-19 post-lockdown 43 Table 26: Respondent’s travel frequency, Dar-es-Salaam and Zanzibar city during lockdown 45 Table 27: Trip characteristics, Dar-es-Salaam and Zanzibar city during lockdown 46 Table 28: Respondent’s travel frequency, Dar-es-Salaam and Zanzibar Unguja before COVID-19 47 Table 29: Trip characteristics, Dar-es-Salaam and Zanzibar Unguja before COVID-19 48 Table 30: Trips per person, Der-es-Salaam and Zanzibar Unguja 50 Table 31: Reason for selecting travel mode, Dar-es-Salaam and Zanzibar Unguja 50 Table 32: Respondent’s household vehicle ownership, Lusaka and Kitwe 54 Table 33: Respondent’s travel frequency, Lusaka and Kitwe city during COVID-19 post-lockdown 55 Table 34: Respondent’s trips, Lusaka and Kitwe city previous week or month 56 Table 35: Respondent’s trip characteristics, Lusaka and Kitwe city post-COVID-19 post-lockdown 56 Table 36: Reason for selecting travel mode, Lusaka and Kitwe during COVID-19 post-lockdown 58 Table 37: Respondent’s travel frequency, Lusaka and Kitwe city during lockdown 58 Table 38: Respondent’s trip characteristics, Lusaka and Kitwe city during lockdown 59 Table 39: Respondent’s travel frequency, Lusaka and Kitwe city before COVID-19 60 Table 40: Respondent’s trip characteristics, Lusaka and Kitwe city before COVID-19 61 Table 41: Respondent’s frequency of trips before COVID-19 (%) 67 Table 42: Respondent’s purpose of trips before COVID-19 (%) 67 Table 43: Respondent’s frequency of trips during COVID-19 lockdown (%) 68 Table 44: Respondents’ purpose of trips during COVID-19 lockdown (%s) 68 Table 45: Respondent’s frequency of trips post-COVID-19 lockdown 69 Table 46: Respondent’s purpose of trips post-COVID-19 lockdown 69 FIGURES Figure 1: Monthly household income, individual expenditure of respondents in Dhaka and Khulna city 11 Figure 2: Reason for travel mode use, Dhaka and Khulna city during COVID-19 15 Figure 3: Reason for travel mode, Dhaka and Khulna city before COVID-19 21 Figure 4: Changes in household income, Dhaka and Khulna city due to COVID-19 21 Figure 5: Modal distribution of trips, Dhaka and Khulna city during and before COVID-19 22 iv FINAL REPORT: IMPACTS OF COVID-19 ON MOBILITY OF PHYSICALLY CHALLENGED PEOPLE AND OLDER PEOPLE Figure 6: Respondent’s travel frequency, Dhaka and Khulna city during and before COVID-19 22 Figure 7: Respondent’s travel purpose, Dhaka and Khulna city during and before COVID-19 23 Figure 8: Difficulty of finding public transport mode, Dhaka and Khulna city 23 Figure 9: Proportion of respondents facing travel issues, Dhaka and Khulna city 24 Figure 10: Respondent’s monthly household income and personal expenditure, Karachi and Lahore city 26 Figure 11: Modal distribution of trips, Karachi and Lahore city during and before COVID-19 35 Figure 12: Modal Distribution of trips, Pakistan (Online Survey) 36 Figure 13: Respondent’s travel frequency, Karachi and Lahore city during and before COVID-19 36 Figure 14: Respondent’s travel frequency, Pakistan (Online Survey) 37 Figure 15: Effect of COVID-19 on travel purpose in Karachi and Lahore city 37 Figure 16: Effects of COVID-19 on travel purpose, Pakistan (Online Survey) 38 Figure 17: Level of difficulty to find and use public transport 38 Figure 18: Variation of income and travel cost, Karachi and Lahore city due to COVID-19 39 Figure 19: Respondent’s household monthly income and individual expenditure, Dar-es-Salaam and Zanzibar 41 Figure 20: Modal distribution of trips, Dar-es-Salaam and Zanzibar Unguja during and before COVID-19 50 Figure 21: Respondent’s travel frequency, Dar-es-Salaam and Zanzibar during and before COVID-19 51 Figure 22: Effects of COVID-19 on travel purpose, Dar-es-Salaam and Zanzibar 51 Figure 23: Level of difficulty in finding public transport, Dar-es-Salaam and Zanzibar 52 Figure 24: Proportion of respondents facing travel problems, Dar-es-Salaam and Zanzibar 52 Figure 25: Respondent’s monthly household income and individual expenditure, Lusaka and Kitwe 54 Figure 26: Modal distribution of trips, Lusaka and Kitwe during and before COVID-19 63 Figure 27: Respondent’s travel frequency, Lusaka and Kitwe during and before COVID-19 64 Figure 28: Effects of COVID-19 on travel purpose, Lusaka and Kitwe city 64 Figure 29: Level of ease to find and navigate public transport during lockdown 65 Figure 30: Respondents facing travel issues, Lusaka and Kitwe 65 Figure 31: Proportion of respondents changing travel or facing additional issues due to COVID-19 70 Figure 32: Proportion of respondents increased travel cost & decreased household income due to COVID 70 Figure 33: Proportion of respondents accompanied by another person during their travel 71 Figure 34: Means of travel mode during and before COVID-19 in different cities 72 Figure 35: Proportion of the respondents in different cities maintaining physical distancing during travel 72 Figure 36: Level of difficulty to find public transport in different cities 73 v FINAL REPORT: IMPACTS OF COVID-19 ON MOBILITY OF PHYSICALLY CHALLENGED PEOPLE AND OLDER PEOPLE ACRONYMS BRTA Bus Rapid Transit System COVID-19 Novel Coronavirus Disease 2019 DTCA Dhaka Transport Coordination Authority FCDO Foreign, Commonwealth & Development Office HVT High Volume Transport Applied Research Programme KCC Khulna City Corporation LIC Low-income country NGO Non-governmental organisations NMT Non-motorised transport SOPs Standard Operating Procedures SDG Sustainable Development Goals vi FINAL REPORT: IMPACTS OF COVID-19 ON MOBILITY OF PHYSICALLY CHALLENGED PEOPLE AND OLDER PEOPLE EXECUTIVE SUMMARY Purpose Large cities in low-income countries (LICs) are often characterised by dense settlement, insufficient infrastructure, poverty, unemployment and even discrimination. Transport infrastructure is often inadequate, unsatisfactory and inaccessible to many people especially for those living below the poverty line. Transport and mobility options for the elderly and individuals who need assistance are very limited. The Novel Coronavirus Disease 2019 (COVID-19) pandemic has worsened the situation by many degrees. This research mainly focuses on the travel behaviour issues of such individuals, aiming to discover their coping strategies. Areas of investigation are: • Travel behaviour for the elderly and people with different disabilities; • Changes in mobility; and • Travel difficulties due to COVID-19. The research contributes to the knowledge base and raises a variety of issues concerning governance and policy. Method The study has been designed with case studies of eight cities of four LICs from Asia and Africa: Bangladesh, Pakistan, Tanzania, and Zambia. A total of 1,669 samples (around 200 from each of the cities) were selected randomly for household surveys. A stratified sampling technique was followed so that the samples were selected from different socio-economic classes and were spatially distributed across each city. For the elderly and differently abled people questions were asked about: • Their mode choice; • Preference for mode choice; • Travel costs; • Social distancing and personal safety; • Problems and suggestions for improvement of mobility; and • Knowledge of their travel behaviour before COVID-19 and during the COVID-19 pandemic. Interviews were done using a pre-determined questionnaire during November 2020. Key findings The study provides an excellent opportunity to compare and contrast travel behaviour and practice for elderly and physically challenged people of different cultures, from different geographic locations with diverse policies during COVID-19. Data are analysed and presented separately for each country. Findings are discussed under the themes of: • Mobility and trips during COVID-19 post-lockdown; • Mobility and trips during COVID-19 lockdown; • Mobility and trips before COVID-19; and • Changes in mobility due to COVID-19 and related travel problems. It has been found that public transport services in Bangladesh, Pakistan, Tanzania, and Zambia are very poor and lack appropriate infrastructure to facilitate physically challenged people. The travel patterns of elderly and physically challenged people in all the cities have changed due to COVID-19. The changes are: • Reduction of travel (avoiding travel or reduced frequency of trips); • Changed travel mode; vii FINAL REPORT: IMPACTS OF COVID-19 ON MOBILITY OF PHYSICALLY CHALLENGED PEOPLE AND OLDER PEOPLE • Increased travel cost and decreased income; • Additional travel difficulties due to COVID-19; • Need to maintain physical distancing, use of masks, and hand sanitisers. The impacts of COVID-19 during lockdown were more than the impacts during post-lockdown. During the lockdown, the amount of public transport was low and as a result those who wanted to go out for work or medical supplies had to wait a longer time or use private vehicles (or paratransit hired for taxi-type individual use). The effects were not same in the four countries as the level of ‘lockdown’ was different. 1 FINAL REPORT: IMPACTS OF COVID-19 ON MOBILITY OF PHYSICALLY CHALLENGED PEOPLE AND OLDER PEOPLE 1. Introduction 1.1 Background A significant share of population (at least 10%) in all low-income countries (LICs) are elderly1 or disabled (1). However, research and data related to the mobility of elderly and physically challenged2 people are very limited in LICs. The elderly and physically challenged people may have different travel needs and challenges; therefore, this topic requires a detailed investigation and policy directions. Also, they may have faced more difficulties than the young and non-disabled people for travel during the Novel Coronavirus Disease 2019 (COVID-19) pandemic. This is mainly because either the supply of transport was less, or facilities were closed during lockdown. Also, travel is more unsafe as many elderly and physically challenged people often need the help of carers and maintaining physical distancing is difficult for them. Often many of them do not have sufficient capability or awareness to maintain physical distance and health guidelines while travelling during COVID-19. For instance, an elderly person might have awareness problems, while a physically challenged person (although aware) might find it physically difficult to maintain safe distances. Travel of physically challenged and elderly people during COVID-19 is affected adversely either because of fear of infection through physical contact with other people or because of higher travel costs due to limited travel options available. Public transport fares in many cities have increased as operators have tried to compensate for the reduction in passenger numbers. Also, the extra costs of sanitary precautions have been passed on to public transport users, adding a further burden to those with lower incomes. Even in pre-COVID19, many citizens in Asia and Africa already struggled to cover their transport costs, and any increase in costs can represent a significant additional burden for households (2). The elderly and physically challenged people in low-income groups in LICs may have more (and diverse) problems with their travel and mobility as they rely more on public transport, which is reduced due to COVID-19. Moreover, transport infrastructure and services in LICs are not accessible or friendly for disabled and elderly people. Therefore, it is worth investigating their mobility and travel during COVID-19 and the related issues of their challenges. This research has a direct link to the sustainable development goals (SDGs): Goal 10 (reducing inequalities) and Goal 11 (sustainable cities and communities). As part of the UK Foreign, Commonwealth & Development Office (FCDO) response to COVID-19, the Applied Research Programme in High Volume Transport (HVT) and the Research for Community Access Partnership (ReCAP) have established a COVID-19 Response & Recovery Transport Research Fund (C19RRTRF). The C19RRTRF has supported several research projects that address COVID-19 and its effect on mobility and transport in LICs. This report is the outcome of a research project supported under C19RRTRF. This report is structured in nine different chapters. Chapter 1 discusses the background and relevant literature. Chapters 2 and 3 discuss respectively the methodology used and implementation of tasks. The main results and findings from the different countries are analysed and presented in Chapters 4 to 7. Chapter 8 provides a summary of the findings and a comparison between different countries and cities. Further research uptake and conclusions are provided in Chapter 9. 1.2 Relevant literature Physically challenged and elderly people are often transportation disadvantaged (3). For travel and mobility, they often face many problems and constraints in accessing buses, terminals and public transport services (4). However, their constraints are not homogeneous; there are differences depending on socio-economic characteristics such as gender, household size, income, vehicle ownership, lifestyle etc. (5). The COVID-19 pandemic has had a profound impact on peoples’ mobility in almost every country around the world (6), changing activity patterns and travel behaviour. Some of these behavioural changes are in response to restrictive measures such as lockdowns while others are driven by perceptions of lack of safety and/ or commitment to slow down the spread of infection by travelling less (7). Reductions or suspensions of public transport services have had a profound social impact, particularly on poorer sections of society who often 1 People aged over 60 years are considered as elderly in this research. 2 The term disabled and physically challenged in this report are used interchangeably. 2 FINAL REPORT: IMPACTS OF COVID-19 ON MOBILITY OF PHYSICALLY CHALLENGED PEOPLE AND OLDER PEOPLE have fewer alternative means of transport access, as well as on women, elderly and physically challenged people (2). Older people are disproportionately affected by the COVID-19 pandemic (8). Persons with disability have been especially vulnerable during the pandemic; physical distancing can be particularly challenging on public transport on which a high proportion of people with disabilities rely (2). Disruptions to transport have intensified the problems for the persons with disability or elderly people, who already had difficulties in accessing public transport services. Moreover, Ainslie and Foubert (9) found that a higher proportion of disabled people (compared to non-disabled people) are worried about the effect of the COVID19 pandemic on their well-being. A range of studies from different countries (mostly western or non-LIC countries) focusing on the impacts of COVID-19 on mobility have demonstrated that different sociodemographic groups have changed travel behaviour in response to COVID-19 in different ways (7). The potential implications of lockdown and physical distancing norms on daily travel patterns are the reduction of travel demand and reduction in the use of public transport respectively (10). For example, due to COVID-19, approximately 80% people in the Netherlands reduced their outdoor activities, with a greater decrease for elderly people (11). The use of motor vehicles in the UK fell by about 20% before the lockdown was imposed and more than 60% during the lockdown (12). In Switzerland, the number of trips fell by 40% (from about 5 to 3 per person per day) and the total-miles travelled for work trips (13). Concerning mode-specific frequencies in Switzerland, there was a reduction of distance travelled by all the modes except bicycle, with percentage changes varying substantially by income, employment and car-ownership (13). In Australia, along with a decline in total use of all modes of transport, there was a higher percentage of travel by the private car during the pandemic since it was considered to be the most ‘comfortable’ mode by respondents (14). Studies clearly show evidence of change in mode usage patterns due to COVID-19 (11). For example, there has been a declining modal share of public transport and ride-hailing services because these are considered by the public as having a potential risk of exposure to the coronavirus. On the other hand, personal cars, bikes and walking are viewed as the safest modes of transport (14, 15, 16, 17). Research and published documents on travel and mobility of physically challenged and elderly people in the contexts of LICs are very limited (18, 19, 20, 21, 22, 23, 24). More importantly, to the best of our knowledge, only a very few studies (2, 6, 7, 25, 26) in LICs focus on the impacts of COVID-19 on travel behaviour or mode choice. Given that the impact of COVID-19 is greatest for physically challenged and older people, it is vital that they are included in such studies (8). However, to the best of our knowledge, no studies to date have investigated the changes in travel behaviour due to COVID-19 for the physically challenged and elderly people in the context of LICs. 1.3 Project aims and objectives Research and data on travel and mobility of elderly and physically challenged people in developing country contexts, particularly in LICs, are very limited. COVID-19 related research and studies have gained momentum recently. However, research on travel impacts due to COVID-19 in LICs, particularly focusing the elderly and physically challenged people, is still very limited. The main purpose of this research is to understand the mobility of elderly and physically challenged people in LICs during COVID-19. The detailed objectives are: • To explore if there are any significant changes in travel and mobility of elderly and physically challenged people due to COVID-19; and • To identify the major constraints and issues related to travel and mobility of elderly and physically challenged people. This research will provide new information and will enable relevant stakeholders to understand the mobility scenarios in LICs in the changed transport world. This evidence-based knowledge will be helpful for city authorities, non-government organisations (NGOs) and development agencies in identifying priority actions required for immediate responses and recovery, and in providing guidelines (and relevant support) related to transport and mobility. The immediate responses/ recovery and policy will be helpful for local elderly and physically challenged people to ease their mobility and/ or to overcome their mobility constraints. It may also 3 FINAL REPORT: IMPACTS OF COVID-19 ON MOBILITY OF PHYSICALLY CHALLENGED PEOPLE AND OLDER PEOPLE improve their access to transport and services, thus potentially leading to more participation and involvement in productive or income generating activities during COVID-19. 1.4 Transport measures taken by the cities and authorities during COVID-19 Cities and authorities in different countries have taken a variety of efforts (short-term actions) and policy measures for the transport sector during COVID-19. To stop the spread of COVID-19, governments have imposed full or partial lockdowns. During lockdown people’s ability to travel has been restricted in many cities by suspending public transport operations or services and by imposing restrictions on the movement of private vehicles and on freight movement (2, 27). During post-lockdown, as the literature shows, very common measures or actions for the transport sector due to COVID-19 are: • Maintaining physical distancing in public transport and public places; • Wearing a face mask during travel; • Providing free hand sanitising in vehicle or station for the passengers and crews; • Regular cleaning and disinfecting the vehicles. 1.5 Alignment with the HVT research themes, priorities and programme objectives This research is aligned with the HVT research theme “Gender, inclusion, vulnerable groups, and road safetyâ€. The research is aiming to help in the fast-tracking of evidence-based knowledge on mobility of elderly and disabled people that can support immediate responses and guide recovery and/ or policy in a changed transport world in LICs. Also, it aims to provide a learning resource which could be used by the providers of transport related infrastructure and services (e.g. local government, public transport operators). The research is related to the “impacts of and responses to COVID-19 in addressing social inclusion and equity issues in low/ high-volume transport†including impacts on the mobility of people with disabilities and elderly people. Thus, the research is linked to COVID-19 and transport, particularly including the cross-cutting areas and inclusion of transport. 1.6 Alignment with FCDO priorities This research is aligned with the priorities of the Foreign Commonwealth and Development Office (FCDO). The FCDO puts priority on “strengthening resilience and response to crisis†and “tackling extreme poverty and helping the world’s most vulnerable†(28). Since COVID-19 is now the biggest global crisis, understanding its impact on human travel behaviour, and helping to make infrastructure, regulation and governance more resilient and people-centric, are very much aligned with this FCDO priority. 4 FINAL REPORT: IMPACTS OF COVID-19 ON MOBILITY OF PHYSICALLY CHALLENGED PEOPLE AND OLDER PEOPLE 2. Methodology 2.1 Summary of approach Mobility related information about elderly and physically challenged people before and during COVID-19 was collected to understand their usual travel behaviour before COVID-19 and during the pandemic. This information revealed problems or challenges for mobility they face in both usual circumstances and during COVID-19. For the research, a mixed-method (both quantitative and qualitative) approach was followed. This research is an exploratory study and has followed a case study approach. The case studies were conducted in eight different cities from the following four countries: • Bangladesh: Dhaka and Khulna city; • Pakistan: Karachi and Lahore city; • Tanzania: Dar-es-Salaam and Zanzibar city; and • Zambia: Lusaka and Kitwe city. More information about these locations can be found in Appendix A. The research director was based in Dhaka, Bangladesh. A researcher from each country was responsible for collecting the data and coordinating all the relevant activities in the respective country and cities. The researcher responsible for the case studies in a specific country (country coordinator) employed the required researchers and enumerators for data collection and analysis. Each city had a separate team of enumerators for data collection, sorting the data, data input and preparing the database. The country coordinator prepared the draft report and then shared the findings and outcomes with the project director through email. Having a researcher from each country was very helpful for addressing local issues and problems efficiently. For example, it helped communication with the respondents about local norms and customs of the society. It also helped overcome ethical issues in data storage and transferral, thus making overall cost savings. However, doing all this required effective coordination and regular (once or twice per week) follow-up meetings with the project director. 2.2 Methods and techniques A generic questionnaire was prepared for data collection. The questionnaire was then tailored/ adapted for country specific conditions, considering the socio-economic context of the city concerned, and was translated into the local language by the respective researcher. A total of 1,669 respondents (around 200 from each of the city) were interviewed during November 2020, maintaining proper physical distance and health guidelines. A stratified sampling technique (considering gender, social class or economic condition, spatial distribution, disability type) was followed to address diversity issues. While selecting the samples, it was carefully ensured that representatives from all the diverse groups and from different areas of the city were included to represent the whole population of interest. Each city was divided (hypothetically) into 50-60 strata (or neighbourhoods) and then around 20 to 40 strata were selected for the survey. When selecting the strata, it was ensured that they represent the socio-economic variation and spatial distribution of the city concerned. Typically, there are 500 to 1200 houses in each neighbourhood, depending on each different city). From each of the strata, around 6 to 9 individual respondents were drawn randomly for conducting interviews, according to a method described in the paragraph below. A list of the strata for each city where the surveys were conducted is available in Appendix B. The face-to-face interviews were conducted at household level using a pre-determined questionnaire. A digital questionnaire in Smartphone or Tab was used in Zambia while a paper-based printed questionnaire was used in all other countries for conducting the household surveys. Appendix C shows a sample questionnaire used for the household survey. The household survey provided both quantitative and qualitative data concerning the respondents. The enumerators visited the selected neighbourhood and started to visit a house (by knocking on a door) randomly from a corner of the neighbourhood to see if the house had any elderly or physically challenged inhabitants. If there was more than one such inhabitant in the house (or in multiple households in different apartments of the building), the interview was done with one person (the person with whom the enumerator 5 FINAL REPORT: IMPACTS OF COVID-19 ON MOBILITY OF PHYSICALLY CHALLENGED PEOPLE AND OLDER PEOPLE met first). If there was no such person in that house, the enumerator went to the next house until (s)he got a valid sample. After completing an interview with a respondent, the enumerator approached the 11th house (along a road towards the centre of the neighbourhood or towards another corner) to see if there was a suitable respondent to conduct the interview. If a suitable respondent was not available in that house, the next house was approached; however, if a respondent was found then, again, the 11th house was approached for the next respondent. This systematic technique helped to get the responses spread across the whole neighbourhood. The enumerator repeated the technique until (s)he got responses from 6-9 samples in a neighbourhood. There were more elderly people than physically challenged people. Except in Dar-es-Salaam and Lusaka, it was often the case that, when using the technique, 8-10 respondents in a neighbourhood were found elderly but none was a physically challenged person. Therefore, it was decided that at least 2-3 respondents from each neighbourhood should be physically challenged person. Hence, if initially all 5-6 respondents of a neighbourhood were elderly persons, then the selected house/ sample was not considered for interview unless the respondent was a physically challenged person. Moreover, if no physically challenged person was found from a neighbourhood by the above technique, then information from local people was used (based upon snowball methods) to identify physically challenged people. In addition, an online survey was also conducted by using Google Forms in all cities except those in Tanzania. The weblink for the survey questionnaire was disseminated through email and through other online social media such as Facebook. The weblink was shared and disseminated via different professional and social public groups of the respective city, requesting people who were elderly or disabled to take part in the survey. Using information communication technology (ICT) and online social media usually can help to reach and collect many responses within a very short span of time. Online surveys provide mainly quantitative data. However, recent post-election restrictions imposed by the government of Tanzania on using the internet and related accessories did not provide favourable circumstances for conducting an online survey. Therefore, in Tanzania, an online survey using Google Forms was not conducted and only the household questionnaire survey was done. Nevertheless, not everybody in the LICs has access to the internet or feels confident in using electronic gazettes such as computer or smart phone. Moreover, the elderly and physically challenged persons may have other issues in using email or online social media (e.g. do not know how to use, no internet connection or expensive). Thus, there is an important limitation that data collected using online techniques may not be representative of the whole population, e.g. of different socio-economic backgrounds or disability types might be under-represented. Rahman et al (29) explained that using online platforms and computer-aided technology for data collection in developing country contexts, particularly involving illiterate and poor people, is not appropriate and special attention from the researcher is required. 2.3 Innovation in this research The major innovation of this research concerns creating new knowledge about the travel behaviour and mobility constraints of elderly and physically challenged people in LICs during COVID-19, and about how they are coping with the crisis. For conducting household surveys, a paper-based printed questionnaire was used in all the countries except in Zambia. The commencement of the household survey in Zambia was delayed for more than a week. Therefore, an App (the weblink being like Google Forms) in Tab or Smartphone for collecting/ storing responses was used by the enumerators in Zambia instead of the paper-based questionnaire. To the best of our knowledge, this method has not been used before for travel data collection on elderly and disabled people in African contexts. This helped to reduce additional efforts and time required for after-survey data input, as well as for preparing the database and the visualisation of data. The household data collection in Zambia was thus completed on time and the database was ready for analysis at the same time as the databases for other countries were available. Moreover, a smart technique – combination of ICT and online social platform – was applied to get responses from the relevant sample population. For example, using the Google Forms and disseminating the weblink emails and social medias were helpful to minimise the time and efforts for data collection and data input or analysis for the visualisation or interpretation. 6 FINAL REPORT: IMPACTS OF COVID-19 ON MOBILITY OF PHYSICALLY CHALLENGED PEOPLE AND OLDER PEOPLE 2.4 Risks and mitigations Preparing the questionnaire and pre-testing took a week longer than the original planned time. The delay was due to the process of recruiting enumerators and providing them with the required training. To complete the household level surveys by the specified deadline, multiple enumerators were assigned in each city (the original plan was for one per city). As stated above, the commencement of the household field survey in Zambia was delayed for more than a week. The delay was mainly because the enumerators needed money for transport and other expenses required for surveys before carrying out their work. The country coordinator for Zambia had to organise funds prior to hiring enumerators and then deployed three enumerators. In the other countries the enumerators did not need to be paid in advance. In Tanzania, immediately after the national election, at the beginning of November 2020, the socio-political situation was not stable in Zanzibar. Therefore, the commencement of the household survey was delayed for more than a week. The country coordinator responsible for Tanzania very carefully observed the situation for nine days and then deployed the enumerators when the situation returned to normal. However, completing the interviews (achieving the required number of sample responses per day or week) was much slower than had been planned. The country coordinator in Tanzania had difficulties both in communicating with the enumerators in Zanzibar when supervising them remotely as well as in receiving feedback on time. The delay in completing the surveys in Zanzibar affected the progress of tasks in Tanzania as well as the overall research for about three weeks. Furthermore, as already mentioned in Section 2.2, the planned online questionnaire survey using Google Forms was not conducted in Tanzania since it was not possible due to post-election restrictions by the government on internet and electronic gazette use in the country. The number of responses received from the online survey was very low for each country. After distributing the weblink, the researcher had no control over whether people responded to the online survey once they had received the weblink. Even in the first week, there was no response. Therefore, a widespread publicity campaign was conducted (e.g. re-sending emails and re-posting on Facebook) requesting people to take part in the survey. Moreover, the country coordinator in Pakistan asked his undergraduate students to request family members who are older or disabled to fill up the survey link. This repeated effort of publicity and request was continued every week which helped to get some responses. However, the total number of responses received from the online survey was still low. 2.5 Ethical review Ethical considerations were strongly followed. Local approval and permission required from the government for work concerning COVID-19 was received by the respective country coordinator, or (s)he used similar approval already granted to his/ her institution under another research framework. A short summary about the research was available at the beginning of the questionnaire used for the online survey. For the household survey, the respondents were clearly briefed about the research and were told that taking part in the interview was voluntary. Respondents were further informed that it would be possible for them to withdraw from completing the questionnaire at any stage of the interview if they felt uncomfortable in answering any of the questions or did not want to continue. The identities of the respondents were not disclosed. Data were encrypted and stored safely in a secured place. Data were encrypted while transferring by email. All the information used from secondary sources were duly acknowledged and referenced. Overall, UK data protection standards and ethical considerations were followed in this research during the phases of data collection, data storing, data transfer and analysis. 2.6 Quality assurance The quality of each task for this research was maintained with a high standard. Brainstorming and group consultation among the research team members were performed in each stage. Pre-testing of the questionnaire was done in each case study city in the 1st week of November 2020 before finalising the questionnaire. After finalising the questionnaire, training was provided to the enumerators to explain how to conduct the interviews and prepare the database. The database was cross-checked in the 3rd week of December 2020 for validation. This report was reviewed by a member of the research team. 7 FINAL REPORT: IMPACTS OF COVID-19 ON MOBILITY OF PHYSICALLY CHALLENGED PEOPLE AND OLDER PEOPLE 3. Implementation 3.1 Description of the case study cities and COVID-19 situation The case study cities are made up of the capital city and another major city (in terms of population and land area) of the respective country. Table 1 shows the population, area, and brief information about COVID-19 lockdowns in the cities. A detailed description of the case study cities is available in Appendix A. Table 1: Summary of the case study cities and COVID-19 lockdowns Country City Area (sq.km) Population (million) Modal share of trips and transport situation before COVID-19 COVID-19 lockdowns Bangladesh Dhaka 1,528 14.5 Rickshaw (37%), bus (37%), car (7%), walk (18%). Nationwide lockdown - transport ban, 26 March to 31 May 2020. Khulna 45.65 1.5 Easybike (37%), rickshaw (18%), motorcycle (11%), bicycle (5%), walk (21%). Pakistan Karachi 3,530 16.1 Modal share of trips: public transport (43%), motorcycle (17%), car (22%), paratransit (8%). Nationwide strict lockdown from 1 April 2020 for Lahore 1,772 12.6 Lahore Metrobus Service (MBS) and two weeks. Orange Line of Lahore Metro. Tanzania Dar-es-Salaam 1,393 6.7 Modal share of trips: daladala (62%), walk (17%), car (13%), motorcycle (2%), train & boat (6%). Nationwide closure of schools for 3 months, ending June 2020. Zanzibar 15.5 1 Bicycle (41%), car (27%), bus (13%), motorcycle (17%). Zambia Lusaka 418 2.8 Walk (65%), public transport (23%), car (10%), bicycle (2%). Close academic institutions from 20 March 2020 until 1 February 2021. Kitwe 777 0.52 Poor transport systems; small buses are the most used public transport mode. Sources: 30, 31, 32, 33, 34, 35, 36, 37, 38, 39, 40, 41. In Bangladesh, the first case of COVID-19 was identified and confirmed in Dhaka on 8 March 2020. On 22 March 2020, the government declared the enforcement of a lockdown labelled as ‘general holidays’. A transport ban was implemented on all modes across the country from 26 March to 4 April 2020, accompanied by the closure of all businesses, industries and educational institutions except those providing essential necessities (e.g. pharmacies and groceries). Following the declaration of ‘general holidays’, many people from the major cities moved to their native homes in villages and rural areas. Different sources estimated that around 10 million people left Dhaka city during the 10-days ‘general holidays’ (42). The lockdown and transport ban were extended until the end of May 2020. The lockdown adversely affected business and the economy. Therefore, despite a rise in COVID-19 positive cases, offices were re-opened and public transport services were resumed on 31 May 2020, ending 66 days of lockdown measures. Public transport was allowed to operate on a limited scale (e.g. using only 50% of seating capacity) and subject to passengers’ compliance with health and safety guidelines such as maintaining physical distancing and wearing face masks. Since then, ‘local lockdowns’ continue to be implemented, based on situations where confirmed positive cases are very high. Academic institutions will remain closed until 30 June 2021. On 3 April 2021, government again declared a lockdown, initially from 5 April to 19 April 2021 and then extended until 23 May 2021. In Pakistan, the first case of COVID-19 was reported in Karachi on 26 February 2020, followed by a second case on the same day in Islamabad (43, 44). The government has taken several steps to control the epidemic including the provision of testing facilities in hospitals, developing quarantine centres, and Standard Operating Procedures (SOPs) for public places with strict enforcement (44). The first lockdown was implemented from 23 March 2020 in Sindh province followed by a nationwide lockdown in the country from 1 April 2020, with strict enforcement. This placed low-income groups at high risk of starvation (many of them 8 FINAL REPORT: IMPACTS OF COVID-19 ON MOBILITY OF PHYSICALLY CHALLENGED PEOPLE AND OLDER PEOPLE could not afford food) and economic losses for everyone. Therefore, a ‘smart lockdown’ was introduced in mid-April 2020 by initiating the re-opening of mosques followed by the further opening of various public places. These re-openings were accompanied by the enforcement of SOPs, i.e. physical distancing and usage of masks, prohibition of entry or access for less immune age groups, particularly children and elderly people. However, the ‘smart lockdown’ involved implementing strict lockdown in specific areas with a high amount of COVID-19 positive cases (45). The total confirmed COVID-19 number of positive cases reported in Pakistan up to 31 December 2020 was 482,178, with more than 10,000 deaths. The most affected province was Sindh with 222,999 cases and 3,670 deaths (46), with the cases reported in Karachi comprising around 60% of total cases in the province. Lahore had around 50% of the total 138,608 cases in Punjab province (47, 48). The COVID-19 pandemic has not only caused the loss of life but also affected the overall economy. The GDP growth declined from 1.9% in 2019 to 1.5% in 2020 (49) and the economic loss of the country has been estimated to lie in the range of $16.38 million to $4.95 billion (50). In Tanzania, the first case of COVID-19 was reported in Arusha on 16 March 2020 and within two months 509 cases were confirmed in the whole country with more than 20 deaths (51). From May 2020, the government stopped producing data on infections and deaths related to COVID-19. The lockdown period in Tanzania lasted for about three months, ending in June 2020. Whilst offices and businesses were not closed during the lockdown period, schools and universities were closed. There was a requirement that public transport vehicles should not carry more passengers than the number of their seats. Furthermore, there was a discouragement of holding public social activities and an enforcement of using face masks. However, livelihood and production activities such as industries, offices, business and commercial activities continued as usual. In Zambia, the first case of COVID-19 was identified and confirmed on 18 March 2020. On 20 March 2020, the government announced that all academic institutions (schools, colleges and universities) would be closed. A total of 70 cases were identified as COVID-19 positive and three people died in April 2020. The government announced major restrictions on international travel and on the holding of social events such as church services and weddings that involved large gatherings of people. This was done by introducing a mandatory requirement for prior approval from the relevant government departments. Strict regulations were enforced on public transport to ensure that commuters were protected. By December 2020, the country had recorded a total of 20,725 confirmed cases with 388 deaths. On 12 January 2021, the country confirmed a second wave and all learning institutions remained closed. Schools were re-opened on 1 February 2021. 3.2 Activities conducted The questionnaire for the household survey was prepared, adapted for the local context of the respective country and pre-tested. A half-day training course was provided to the enumerators in each city to explain how to conduct the interviews and prepare the database. Household surveys were conducted with a total 1,669 respondents; Table 2 shows the distribution of the sample from different cities with respect to gender and disability. In terms of gender, the majority of the samples were males. Though the numbers of male and female respondents in Dhaka, Zanzibar and Lusaka were similar, women made up a low proportion in Dar-es-Salaam and Kitwe, and a very low proportion in the other cities, namely Khulna, Karachi, Lahore. Among the respondents, the number of elderly people was generally much higher than the number of disabled persons. The number of elderly and disabled persons in Zanzibar and Karachi was similar, while the number of disabled persons was higher than the number of elderly people in Dar-es-Salaam and Lusaka, but very low in all other cities. Table 2: Household sample distribution from different city Country City Total Respondents Gender Disability Male Female Older Disabled Bangladesh Dhaka 253 141 112 201 52 Khulna 200 174 26 160 40 Pakistan Karachi 209 144 65 117 92 9 FINAL REPORT: IMPACTS OF COVID-19 ON MOBILITY OF PHYSICALLY CHALLENGED PEOPLE AND OLDER PEOPLE Country City Total Respondents Gender Disability Male Female Older Disabled Lahore 237 175 62 156 81 Tanzania Dar-es Salaam 203 127 76 75 128 Zanzibar 155 88 67 73 82 Zambia Lusaka 201 103 98 59 142 Kitwe 211 130 81 138 73 TOTAL 1669 1082 587 979 690 Google Forms was used for the online survey and the weblink was shared through email and Facebook. A separate weblink or questionnaire was prepared for each country, as shown in Appendix D. For Bangladesh one questionnaire was prepared in English with another in the local language Bangla. For Pakistan and Zambia, the questionnaire was only in English. The weblink was live for accepting responses from midNovember to mid-December 2020. The weblink was also distributed through emails and Facebook to different groups, with a request to take part in the survey if the recipient was an elderly or disabled person in the respective case study cities. The distribution of the weblink was not balanced in terms of getting a representative sample. However, no response was received in the first week. Therefore, the email was sent again and re-posted in Facebook. The researcher in Karachi requested his undergraduate students to share this form with their elderly or disabled family members. The responses received from the online survey were very low - only 16 from Bangladesh, 88 from Pakistan, and 15 from Zambia (responses from different cities are shown in Appendix D). Though the survey was targeted at the case study cities, it was available to people throughout the country as the weblink was shared through social media. A small number of responses were received from people outside of the case study cities (e.g. from another city or from rural areas of the country). Received a very small number of responses from the online technique mainly because many people in LICs are illiterate and poor who do not have electronic gadgets with internet access. Not many elderly people in LICs are comfortable with using electronic gadgets and internet. Moreover, usually online surveys have a demographic bias associated with the younger people who are internet savvy (7). Data from online surveys for similar research in Bangladesh (6, 25) also showed that the respective datasets had an over-representation of young adults. Most disabled people are poor (52) who don’t have access to internet and many disabled people may not be capable to use electronic gadgets due to blindness, mental impairment or development disability. Thus, in an online survey a large portion of elderly and physically challenged people often remain outside of the survey. 3.3 Target groups Potential stakeholders of this research are: city authorities (e.g. local or municipal government); nongovernment organisations (NGOs) and development agencies; transport service providers; and city transport authorities. The results will be helpful for city authorities and governments when making policy decisions, formulating strategies and making investment plans related to transport. The Planning Department of Khulna City has agreed to take into consideration the results of this research while implementing relevant transport/ infrastructure projects. A summary of the findings will be provided to the city authorities and transport agencies of the case study cities. The new knowledge derived from this research will be transferred among the practitioners of different agencies in case study cities as well as in other cities of LICs. 3.4 Data analysis Collected data from all the case study cities were sorted and cleaned, and then the database was prepared for analysis. Collected data were analysed using SPSS and MS Excel. Even though data were collected by two different methods (i.e. household survey and online survey), the analysis of this report is mainly based on the household data. The responses received from the online survey is very biased and not representative of the population of the city. For example, the respondents are mainly 10 FINAL REPORT: IMPACTS OF COVID-19 ON MOBILITY OF PHYSICALLY CHALLENGED PEOPLE AND OLDER PEOPLE from wealthy families owning a personal vehicle and from highly educated retired professionals; there was no response from physically challenged people. Therefore, only the household data has been considered for the analysis of this research. Data were analysed to depict the travel patterns (e.g. frequency of trips, availability of public transport for the trips) and the trip characteristics (e.g. purpose, distance, mode, travel time, travel cost) of the respondents during COVID-19 (both during lockdown and post-lockdown) and before COVID-19. Major travel changes and problems due to COVID-19 were also identified. Relevant tables and figures were prepared. Data for the cities of a respective country are analysed and presented in chapters four to seven, for each country respectively. 11 FINAL REPORT: IMPACTS OF COVID-19 ON MOBILITY OF PHYSICALLY CHALLENGED PEOPLE AND OLDER PEOPLE 4. Findings from Bangladesh This chapter reports on the data derived from Dhaka city and Khulna city in Bangladesh. The data was collected from household surveys in various locations of the cities. Totals of 253 and 200 respondents from Dhaka and Khulna respectively were interviewed. 4.1 Socio-economic profile of the respondents Most of the respondents (80% in Dhaka and 94% in Khulna) are elderly people and mostly belong to the age group of 61-70 years, as seen in Appendix Table E1-1. A detailed socio-economic profile of the respondents is available in Appendix E1. In terms of disability, 79% and 80.5% respectively in Dhaka and Khulna are without any physical challenge and the remainder have such challenges (Table E1-2). Of the respondents, 64% and 71.5% in Dhaka and Khulna respectively perform their daily needs themselves while 36% and 28.5% respectively are dependent on family members or relatives (see Table E1-3). Only a small percentage of respondents, 2% and 0.5% respectively in Dhaka and Khulna, live alone (in Table E1-4). Most of the respondents have a household size of between 4 and 5 members. Figure 1: Monthly household income, individual expenditure of respondents in Dhaka and Khulna city Table 3: Household vehicle ownership of respondents in Dhaka and Khulna city Vehicle Ownership Dhaka Khulna Vehicle Number of Respondents % Respondents % No 180 72% 120 60 Yes Car Motorcycle Bicycle Other* 47 11 7 6 18.7 4.3 2.6 2.4 12 41 24 3 6 20.5 12 1.5 Sub-Total 71 28% 80 40% * Other includes rikshaw and van. Data on household monthly income shows that more than half of the respondents (52%) in Khulna are in the income group GBP 251-500, while in Dhaka the highest proportions are in monthly income groups GBP 100- 250 (25%) and GPB 501-1000 (27%) (Figure 1). The personal expenditure per month for more than half of the respondents (51%) in Dhaka is in the range GBP 10-50, whilst in Khulna 41% spent below GBP 10 and 38% spent in the range GBP 51-100. 8 25 20 27 20 6 31 52 10 1 0 10 20 30 40 50 60 Below GBP 100 GBP 101- 250 GBP 251- 500 GBP 501- 1,000 GBP 1,000+ % of Respondents Household Income Khulna Dhaka 2 51 27 20 41 18 38 3 0 20 40 60 Below GBP 10 GBP 10 - 50 GBP 51- 100 GBP 100+ % of Respondents Individual Expenditure Khulna Dhaka 12 FINAL REPORT: IMPACTS OF COVID-19 ON MOBILITY OF PHYSICALLY CHALLENGED PEOPLE AND OLDER PEOPLE Table 3 shows the vehicle ownership of the households; in both cities most of the households do not own any private vehicles. Only 28% in Dhaka and 40% in Khulna mentioned that the household has a personal vehicle: a car for the majority in Dhaka but a motorcycle in Khulna. However, of the respondents having a household vehicle, around 24% of them in both cities do not have access to the vehicle (Appendix Figure E1-2). In many cases, only one member of the household uses the car (e.g. an office car from a carpool) which is not generally available for other members. 4.2 Mobility and trips during COVID-19 (post-lockdown) This section provides information on the travel patterns and characteristics of trips during the COVID-19 postlockdown period for both cities in Bangladesh. 4.2.1 Travel Pattern Most of the respondents travel alone while 41% and 16% respectively in Dhaka and Khulna are accompanied or escorted by another person (Appendix Table E1-5). Of the accompanied persons, the majority are family members while a very few (12% and 6% respectively in Dhaka and Khulna) are neighbours or friends. The frequency of travel is shown in Table 4. A significant portion in Dhaka travel very rarely (e.g. a few times in a year or month) while a major portion in Khulna travel 2-3 times or 4-5 times per week. The respondents were asked if public transport is available for their trips and whether physical distancing and health precautions (e.g. hygiene or protective measures) are maintained in the vehicle. Almost 67% and 90% respectively in Dhaka and Khulna mentioned that public transport is available and in terms of physical distancing, 78% and 89% respectively mentioned it is maintained. Only 9% and 13% respectively in Dhaka and Khulna mentioned that they are facing travel problems such as: less travel; less availability of public transport where physical distancing is not properly maintained; and increased travel cost. Table 4: Respondent’s travel frequency in Dhaka and Khulna city during COVID-19 post-lockdown Categories Dhaka Khulna Number of Respondents % Number of Respondents % Travel Frequency None 2 1 2 1 Few times/ year 47 20 6 3 Few times/ month 25 10.5 8 4 1/ month 24 10 10 5 1/ week 27 11.5 24 12 2-3/ week 46 19.5 52 26 4-5/ week 28 11.5 83 41.5 5+/ week 34 14 12 6 Several times/ day 5 2 3 1.5 Total 238 100% 200 100% Physical Distancing Yes 181 78% 179 89% No 51 22% 21 11% Availability of Public Transport Yes 140 66.5% 176 90% No 70 33.5% 19 10% Problems Due to COVID Yes 23 9% 26 13% 13 FINAL REPORT: IMPACTS OF COVID-19 ON MOBILITY OF PHYSICALLY CHALLENGED PEOPLE AND OLDER PEOPLE To get more detailed travel information, the respondents were asked about their total number of trips during the previous week. Table 5 shows that 45% of respondents in Dhaka and 17.5% in Khulna did not travel in the previous week, whilst almost 29% in both cities made 1-2 trips. However, in Khulna the highest frequency was 3-5 trips (41% of the respondents). Comparatively more respondents in Khulna had more trips probably because of the following reasons: there was not such a strong lockdown and enforcement as in Dhaka; and many motorcycles and easybikes were available for trips. Table 5: Respondent’s trips in Dhaka and Khulna city in the previous week Travel Frequency of Respondents Dhaka Khulna Total Respondents % Respondents % Respondents % None 112 45 35 17.5 147 33 1-2/ week 71 28.5 59 29.5 130 29 3-5/ week 22 9 82 41 104 23 5+/ week 44 17.5 24 12 68 15 Total 249 100% 200 100% 449 100% The details of trip characteristics are discussed in the next section. 4.2.2 Trip Characteristics Table 6 delineates the characteristics of trips including purpose, distance, travel time, travel cost, and mode used during the COVID-19 post-lockdown period. The main purposes for the trips in both cities are: work; grocery or shopping; and visiting a doctor or purchasing medicine. In Khulna almost half of the trips are for work. The trips in both cities are mostly for short distances, within 5 km; a small portion of trips in Dhaka are for long distances such as 20 km or outside of the city. Table 6: Trip characteristics in Dhaka and Khulna post- COVID-19 lockdown Categories Dhaka Khulna Number of Trips % Number of Trips % Trip Purpose Grocery 61 23.5 31 15 Personal Need 27 10.5 22 11 Doctor Visits 47 18 21 10.5 Work 54 21 99 49 Social 37 14 21 10 Recreation 18 7 0 0 Prayer 15 6 9 4.5 Total 259 100% 203 100% Trip Distance Below 0.5 km 20 8 18 9 0.5 - 1 km 71 27.5 34 16.5 1.1 – 2 km 72 28 69 33 2.1 – 5 km 45 17 54 26 5.1 – 10 km 28 11 31 15 10.1 – 20 km 8 3 1 0.5 Above 20 km 4 1.5 0 0 Outside of the city 11 4 0 0 14 FINAL REPORT: IMPACTS OF COVID-19 ON MOBILITY OF PHYSICALLY CHALLENGED PEOPLE AND OLDER PEOPLE Categories Dhaka Khulna Number of Trips % Number of Trips % Total 259 100% 207 100% Travel Mode Walking 85 33 25 12 Wheelchair 1 0.5 1 0.5 Bicycle 1 0.5 10 5 Rickshaw 76 29 52 25 Bus 39 15 0 0 Car 36 14 9 4.5 Motorcycle, Pathao 2 1 19 9 CNG or easybike 13 5 90 43.5 Other 6 2 1 0.5 Total 259 100% 207 100% Travel time Below 5 minutes 34 13 42 20 6 – 15 minutes 111 43 101 48.5 16 - 30 minutes 73 28 63 30.5 31 - 45 minutes 9 3.5 1 0.5 46 minutes - 1 hour 9 3.5 1 0.5 1 - 2 hour 12 4.5 0 0 2+ hours 11 4.5 0 0 Total 259 100% 207 100% Trip Cost (BD Tk3 ) None or Not Applicable 109 42 64 31 Below Tk 10 12 5 18 9 Tk 11 – 20 27 11 58 28 Tk 21 – 50 57 23 53 25 Tk 51 – 100 16 6 12 6 Tk 101 – 200 12 5 2 1 Tk 201 – 500 17 7 0 0 Tk 500+ 2 1 0 0 Total 259 100% 207 100% The travel time for most of the trips is less than 30 minutes although a small portion of trips in Dhaka require more than 1 hour. Travel time is related to the trip distance, mode used for the trip and the congestion level of city. The travel cost for a major portion of trips is not applicable as they involve walking or unknown due to the use of the respondent’s own vehicle (with respondents not knowing the cost for a particular trip). Though the cost for the majority both in Dhaka and Khulna is within Tk 50 (GBP 0.45), a small portion in Dhaka is above Tk 100 (GBP 0.90), as seen in Table 6. The travel cost or fare is often high when they need to hire a vehicle for taxi-type individual use. 3 BDT is Bangladeshi currency Taka (Tk). In November 2020, the conversion rate of GB 1 Pound was BDT 110. 15 FINAL REPORT: IMPACTS OF COVID-19 ON MOBILITY OF PHYSICALLY CHALLENGED PEOPLE AND OLDER PEOPLE Figure 2: Reason for travel mode use, Dhaka and Khulna city during COVID-19 The travel modes of the respondents are different in Dhaka and Khulna: bus and car are significant in Dhaka, whilst easybike4 , bicycle and motorcycle are significant in Khulna. A large portion of the respondents in both cities travel by walking and rickshaw. As seen in Figure 2, the main reasons for using a particular travel mode are: availability, easy access and short distance in Dhaka; and low cost, comfort, speed and safety in Khulna. 4.3 Mobility and trips during lockdown This section provides information on the travel patterns of the respondents and the characteristics of their trips during lockdown. 4.3.1 Travel pattern During lockdown most of the respondents lived in their own house. Only 7% and 4.5% respondents in Dhaka and Khulna respectively were in other places such as in their home village, another part of the city or another city before the lockdown; they returned home at the start of lockdown, travelled by bus or personal vehicle (Appendix Table E1-7). Most of the respondents (80.5% in Dhaka and 53% in Khulna) did not travel or go outside of their homes during lockdown. The travel frequencies are shown in Table 7 for the 19.5% in Dhaka and 47% in Khulna who did travel during lockdown. Probably because of the weak lockdown in Khulna a higher percentage travelled during the lockdown though it was mostly once or 2-3 times per week. Table 7: Travel frequency of respondents, Dhaka and Khulna city during lockdown Categories Dhaka City Khulna City Number of Respondents % Number of Respondents % Travel Frequency None 203 80.5 102 53 Few times/ year 0 0 0 0 Few times/ month 5 2 5 2.5 1/ month 14 5.5 5 2.5 1/ week 12 5 24 12.5 2-3/ week 7 3 52 27 4-5/ week 1 0.5 0 0 4 Three-wheeler auto-rickshaws are called CNG. Easybikes are the battery-operated modified auto-rickshaws with carrying capacity 4-6 passengers (53). 0.00% 10.00% 20.00% 30.00% 40.00% 50.00% 60.00% Available/ only mode Easy access Comfortable Low cost/fare or save money Short trip/distance Cant walk, difficult to use bus Health purpose or physical… Own vehicle Fast Safe Others * Khulna Dhaka 16 FINAL REPORT: IMPACTS OF COVID-19 ON MOBILITY OF PHYSICALLY CHALLENGED PEOPLE AND OLDER PEOPLE Categories Dhaka City Khulna City Number of Respondents % Number of Respondents % 5+/ week 1 0.5 2 1 Several times/ day 6 2.5 3 1.5 TOTAL 249 100% 193 100% Physical Distancing Yes 37 81% 84 90% No 9 19% 9 10% Availability of public transport Yes 18 40% 80 88% No 28 60% 11 12% Problems due to COVID-19 Yes 2 3% 2 4% Of the respondents who travelled during lockdown, as shown in Table 7 only 40% in Dhaka but 88% in Khulna mentioned that public transport was available for their trips. In terms of health measures and precautions, 81% and 90% respectively in Dhaka and Khulna mentioned that physical distancing was maintained in the vehicle and that they used a face mask during the trip. The high percentages are based upon a small number of responses, 46 and 91 respectively. Only 3% and 4% of the respondents in Dhaka and Khulna respectively mentioned that they had difficulties in finding a vehicle due to less transport being available and increased travel cost during lockdown. 4.3.2 Trip characteristics Table 8 shows the characteristics of trips during lockdown, including purpose, distance, travel time, travel cost, and mode used. In Dhaka, the main purpose for travel during lockdown is purchasing grocery or shopping, while in Khulna it is work and pray (worship). Other purposes are insignificant; these are: visiting a doctor or health centre, social or visiting relatives/ friends, and own or personal reasons. The distance of trips during lockdown is short, more than half are below 1 km. During lockdown, most of the respondents in both cities walked for their trips. This is probably to maintain physical distancing and for avoiding crowds in public transport. The travel mode for a large portion in Khulna was CNG easybike, while bicycle and motorcycle are also significant. Travel times during lockdown are mostly within 15 minutes in Dhaka and within 30 minutes in Khulna. Short travel times are mainly because of empty roads and also due to short distances. However, the travel times for some trips are 1-2 hours or even 2+ hours in Dhaka. Travel costs for the majority of the trips during lockdown are low and a significant portion have no cost as they involved walking, using a bicycle, or not known the trip cost as using their own (motorised) vehicle. However, a few trips had higher costs such as Tk 201-500 (GBP 2- 5) or even over Tk 500 (GBP 5). Table 8: Characteristics of trips, Dhaka and Khulna city during lockdown Categories Dhaka Khulna Number of Trips % Number of Trips % Trip Purpose Grocery 27 50 9 8 Personal Need 4 7.5 0 0 Doctor Visits 4 7.5 7 7 Work 8 15 51 46 Social 5 9 2 2 17 FINAL REPORT: IMPACTS OF COVID-19 ON MOBILITY OF PHYSICALLY CHALLENGED PEOPLE AND OLDER PEOPLE Categories Dhaka Khulna Number of Trips % Number of Trips % Recreation 3 5.5 1 1 Prayer 3 5.5 39 36 TOTAL 54 100% 109 100% Trip Distance Below 0.5 km 14 27 44 40.5 0.5 – 1 km 13 25 11 10 1.1 - 2 km 8 16 19 17.5 2.1 - 5 km 5 10 14 13 5.1 - 10 km 4 8 20 18 10.1 - 20 km 3 6 0 0 Outside of the city 4 8 1 1 TOTAL 51 100% 109 100% Travel Mode Walking 31 61 47 43 Wheelchair 0 0 1 1 Bicycle 0 0 7 7 Rickshaw 5 10 8 7 Bus 7 13 0 0 Car 4 8 7 7 CNG or easybike 0 0 31 28 Motorcycle or pathao 0 0 7 7 Other 4 8 1 1 TOTAL 51 100% 109 100% Travel time Below 5 minutes 10 19.5 53 49 6 - 15 minutes 21 41 27 24.5 16 - 30 minutes 9 17. 5 27 24.5 31 - 45 minutes 4 8 1 1 45 minutes - 1 hour 0 0 0 0 1 - 2 hour 4 8 00 0 2+ hours 3 6 1 1 Total 51 100% 109 100% Trip Cost None or Not Applicable 36 66.5 67 61 Below Tk 10 1 2 7 6.5 Tk 11 – 20 3 5.5 13 12 Tk 21 – 50 6 11 13 12 Tk 51 – 100 0 0 6 5.5 Tk 101 – 200 1 2 1 1 Tk 201 – 500 1 2 1 1 18 FINAL REPORT: IMPACTS OF COVID-19 ON MOBILITY OF PHYSICALLY CHALLENGED PEOPLE AND OLDER PEOPLE Categories Dhaka Khulna Number of Trips % Number of Trips % Tk 500+ 6 11 1 1 Total 54 100% 109 100% As seen in Table 9, the main reasons for selecting or using a travel mode in Dhaka during lockdown are short distance (33%) and availability of the mode (25.5%); low cost or saving money are the dominant reasons (55%) in Khulna. The other reasons are: easy access, fast mode, and safe mode. Table 9: Reason for travel mode, Dhaka and Khulna city during lockdown Reason for Selecting Travel Mode Dhaka City Khulna City Frequency % Frequency % Available/ only mode 13 25.5 3 3 Easy access 9 17.5 18 16.5 Comfortable 1 2 5 4.5 Low cost or save money 6 11.5 60 55 Short distance 17 33 0 0 Health purpose or fitness 1 2 0 0 Own vehicle 1 2 0 0 Safe 0 0 12 11 Fast 0 0 11 10 Others * 3 6 0 0 Total 51 100% 109 100% * Others included carrying goods and emergency travel needs. 4.4 Mobility and trips before COVID-19 This section provides travel information of the respondents from Dhaka city and Khulna city of Bangladesh before COVID-19. 4.4.1 Travel pattern Before COVID-19, the frequencies of trips (or going outside of home) are shown in Table 10. The majority in both cities made 2-3 trips, 4-5 trips or 5+ trips per week. Table 10: Respondent’s frequency of trips, Dhaka and Khulna city before COVID-19 Travel Frequency of Respondents Dhaka City Khulna City Respondents % Respondents % Few times/ year 38 16 3 1.52 Few times/ month 25 10.5 3 1.52 1/ month 10 4 6 3.03 1/ week 17 7 11 5.56 2-3/ week 42 18 59 29.80 4-5/ week 31 13.5 84 42.42 5+/ week 65 27.5 25 12.63 Several times/ day 8 3.5 7 3.54 19 FINAL REPORT: IMPACTS OF COVID-19 ON MOBILITY OF PHYSICALLY CHALLENGED PEOPLE AND OLDER PEOPLE Travel Frequency of Respondents Dhaka City Khulna City Respondents % Respondents % Total 236 100 198 100 Availability of public Transport Yes 158 63% 181 91% No 93 37% 19 9% Travel problems Yes 33 13% 15 7% Almost 63% and 91% of the respondents in Dhaka and Khulna respectively mentioned that before COVID-19 there was public transport available for their trips. About 13% and 7% respondents in Dhaka and Khulna respectively mentioned that they faced problems before COVID-19 due to: traffic jams; poor road conditions; lack of sidewalks or crossing facilities (particularly for the disabled); and overcrowding and non-accessible public transport (for both elderly and disabled). Most of the respondents, both in Dhaka and Khulna (75.5% and 95% respectively), made two trips in a typical day before COVID-19 (see in Appendix Table E1-8). The characteristics of the trips are discussed in the next section. 4.4.2 Trip characteristics Table 11 describes the characteristics of the trips including purpose, distance, travel time, travel cost and mode used before COVID-19. Trips for most of the respondents (before COVID-19, both in Dhaka and Khulna) were for the purposes of work, shopping, social or recreation. Trip distances for the majority in both cities are concentrated within 5 km. Travel time for most of the trips is within 30 minutes in both cities, although a number of respondents in Dhaka mentioned 1 hour or 2+ hour. Table 11: Trip characteristics, Dhaka and Khulna city before COVID-19 Categories Dhaka Khulna Number of Trips % Number of Trips % Trip Purpose Grocery 68 24 28 13.5 Personal Need 27 9.5 25 12 Doctor visits 36 13 20 10 Work 68 24 102 50 Social 50 17.5 22 10.5 Recreation 26 9 0 0 Prayer 8 3 8 4 Total 283 100% 205 100% Trip Distance Below 0.5 35 12.87 11 5.21 0.5-1 km 71 26.10 29 13.74 1.1 – 2 km 64 23.53 57 27.01 2.1 – 5 km 50 18.38 74 35.07 5.1 – 10 km 22 8.09 38 18.01 10.1 – 20 km 19 6.99 1 0.47 Above 20 km 3 1.10 1 0.47 Outside of the city 8 2.94 0 0.00 20 FINAL REPORT: IMPACTS OF COVID-19 ON MOBILITY OF PHYSICALLY CHALLENGED PEOPLE AND OLDER PEOPLE Categories Dhaka Khulna Number of Trips % Number of Trips % Total 272 100% 211 100% Travel Mode Walking 94 35 15 7 Wheelchair 2 1 1 0.5 Bicycle 1 0.5 14 7 Rickshaw 70 26 49 23 Bus 43 16 1 0.5 Car 35 13 13 6 Motorcycle or Pathao 1 0.5 26 12 Taxi or Uber 2 1 00 0 CNG or Easybike 14 5 90 43 Others including tempo, laguna, maxi 8 3 2 1 Total 270 100% 211 100% Travel time Below 5 minutes 39 14.5 31 15 6 – 15 minutes 117 43 110 52 16 - 30 minutes 63 23 62 29 31 - 45 minutes 16 6 8 4 46 minutes - 1 hour 11 4 0 0 1 - 2 hour 20 7.5 0 0 2+ hours 6 2 0 0 Total 272 100% 211 100% Trip Cost None or Not Applicable 130 48 66 31.5 Below Tk 10 12 4.5 15 7 Tk 11 – 20 35 13 55 26 Tk 21 – 50 49 18 58 27.5 Tk 51 – 100 16 6 15 7 Tk 101 – 200 9 3.5 2 1 Tk 201 – 500 17 6 0 0 Tk 500+ 2 1 0 0 Total 270 100% 211 100% The amount of travel by rickshaw and on foot is high in both cities. However, particularly in Khulna, there is a very high portion of trips using CNG easybikes, bicycles and motorcycles. Short distance, easy access, and availability are the main reasons to choosing a travel mode for the majority in Dhaka, while low cost and availability are important in Khulna, as seen in Figure 3. 21 FINAL REPORT: IMPACTS OF COVID-19 ON MOBILITY OF PHYSICALLY CHALLENGED PEOPLE AND OLDER PEOPLE Figure 3: Reason for travel mode, Dhaka and Khulna city before COVID-19 4.5 Changes and difficulties due to COVID-19 4.5.1 Impacts of COVID-19 on mobility and travel Only 18% and 30% of the respondents from Dhaka and Khulna respectively mentioned that their typical travel behaviour and mobility have changed due to COVID-19 (Appendix Table E1-9). Their reported main changes are: • Less travel and movement in order to remain safe, avoiding unnecessary trips; • No travel outside of home due to fear of COVID-19 or health problems; • Changed travel mode - avoiding public transport by hiring a taxi-type individual use of easybike, by walking or by switching to personal vehicles; • No travelling alone. Only 18.5% of the respondents in Dhaka, but 72% in Khulna, mentioned that their trip cost has changed, mostly increased, due to COVID-19 (Table E1-10). This is mainly because most people who used shared or public transport mode have shifted to individual or reserved mode of transport. Trip costs decreased for a small portion who shifted to walking. The occupations of only a few respondents, 7% in Dhaka and 3.5% in Khulna, have changed after COVID-19 (Table E1-11). It is not surprising to find changes for a very small portion because most of the respondents, who are elderly and physically challenged persons, were not working before COVID-19. The major changes in occupation are: loss of job (unemployed); change or shift in job pattern or profession (or business). Nevertheless, more than half of the respondents (60% both in Dhaka and Khulna) mentioned that their household income has decreased after COVID-19 (Figure 4). Figure 4: Changes in household income, Dhaka and Khulna city due to COVID-19 0.00 5.00 10.00 15.00 20.00 25.00 30.00 35.00 Available/ only mode Easy access Comfortable Low cost or save money Short distance Difficult to walk & bus trips Health purpose or fitness Own vehicle Safe Fast Others * Khulna (%) Dhaka (%) 0 10 20 30 40 50 60 70 Decrease Increase Stable Khulna (%) Dhaka (%) 22 FINAL REPORT: IMPACTS OF COVID-19 ON MOBILITY OF PHYSICALLY CHALLENGED PEOPLE AND OLDER PEOPLE Figure 5: Modal distribution of trips, Dhaka and Khulna city during and before COVID-19 The proportion of active modes significantly increased during lockdown in both cities, while use of all other modes reduced, as seen in Figure 5. Though the proportion of the modes during post-lockdown and before COVID-19 are similar, a slight increase of paratransit and private modes is observed in both cities during postlockdown, with a slight decrease of public transport in Dhaka during post-lockdown. The major portion of the respondents travelled 2-3 trips or 4-5 trips or 5+ trips per week in both cities before COVID-19, though there are many respondents in Dhaka who travelled just a few times in a year or month, as seen in Figure 6. During post-lockdown a similar pattern was found, but with a slightly decreased percentage; the proportion making 5+ trips per week reduced but the proportion making 1 trip per week increased. During lockdown, the majority did not travel while a few travelled a trip per month or week. Figure 6: Respondent’s travel frequency, Dhaka and Khulna city during and before COVID-19 0 10 20 30 40 50 60 70 80 Public transport Private mode Paratransit Active mode Public transport Private mode Paratransit Active mode Dhaka Khulna % of Respondents Before COVID-19 COVID-19 Lockdown COVID-19 (post-lockdown) 0 10 20 30 40 50 60 70 80 90 None Few times/year Few times/month 1/month 1/week 2-3/week 4-5/week 5+/week Several times/day None Few times/year Few times/month 1/month 1/week 2-3/week 4-5/week 5+/week Several times/day Dhaka Khulna % of Respondents COVID-19 (post-lockdown) Lockdown Before COVID 23 FINAL REPORT: IMPACTS OF COVID-19 ON MOBILITY OF PHYSICALLY CHALLENGED PEOPLE AND OLDER PEOPLE Figure 7: Respondent’s travel purpose, Dhaka and Khulna city during and before COVID-19 Figure 7 depicts the purpose of trips; during lockdown about half the trips in Dhaka are for grocery whilst in Khulna about half are for work. Social trips and recreation trips reduced. Trip purposes before COVID-19 and post-lockdown are similar but slightly less during post-lockdown, except for doctor visits which increased. 4.5.2 Difficulties and expectations In general, finding and riding on public transport in Dhaka are not easy. Whilst almost 40% of respondents mentioned that public transport was ‘manageable’, the remaining (approx.) 60% said that they found it ‘difficult’ or ‘very difficult’. In contrast, almost 80% in Khulna mentioned that it is ‘easy’ while the remainder said they found it very easy or manageable. Similarly, in terms of easiness in finding or navigating a location, all the respondents mentioned that it was easy or manageable in Khulna, while in Dhaka more than half mentioned ‘difficult’ or ‘very difficult’. Figure 8: Difficulty of finding public transport mode, Dhaka and Khulna city 0 10 20 30 40 50 60 Grocery Personal Need Doctor visits Work Social Recreation Others Grocery Personal Need Doctor visits Work Social Recreation Others Dhaka City Khulna City % of Respondents COVID-19 (post-lockdown) COVID-19 Lockdown Before COVID-19 0 10 20 30 40 50 60 70 80 90 Very hard Hard Manageable Easy Very Easy Very hard Hard Manageable Easy Very Easy Dhaka Khulna % of Respondents Find & use Public Transport Find (nevigate) or identify a location 24 FINAL REPORT: IMPACTS OF COVID-19 ON MOBILITY OF PHYSICALLY CHALLENGED PEOPLE AND OLDER PEOPLE Figure 9: Proportion of respondents facing travel issues, Dhaka and Khulna city The respondents were asked if they have faced any difficulties related to travel and mobility during and before COVID-19. Only 13% and 7% respectively in Dhaka and Khulna faced a travel difficulty before COVID19, compared to 10% and 13% respectively during COVID-19 post-lockdown, as seen in Figure 9. During lockdown, the figure is very low, only 3%, in both cities because most of the respondents did not travel and stayed at home. Nevertheless, the respondents were asked if they have any new or additional difficulties for mobility due to COVID-19. Only 3% in Dhaka and 17% in Khulna mentioned that they feel additional difficulties due to COVID-19, which are: less public transport vehicles are available, increased travel cost or bus fare, fear of going out and cannot travel on public transport, uncomfortable or breathing problems because of wearing a mask (Appendix Table E1-12). Those who do not feel any additional travel difficulties due to COVID-19, of them only 5.5% in Dhaka but 57% in Khulna mentioned that the magnitude of the problem is now higher than that of before COVID-19 (Table E1-12). The reported difficulties in both cities are similar. The difficulties before COVID-19 are: • Mobility problems due to disability, difficulty to walk and cannot travel alone; • Buses remain overcrowded and no access, difficult to board/ alight; • No transport facilities for disabled people and no sidewalk or crossroad is provided; • Poor road condition and traffic jam. In addition to the difficulties which were before COVID-19, some additional difficulties caused due to COVID19. During COVID-19 the added difficulties are: • Increased travel cost (bus fare, easybike fare); • Limited amount of public transport (e.g. buses) and rickshaws are available; • Lack of safe transport facility; avoided easybike trips due to COVID-19 and fear. • Physical distancing is not adhered to in many public transport vehicles and not everyone is aware about it; • Breathing problem or uncomfortable for wearing mask; • Fear of travel or afraid of going out due to COVID-19; • Less travel – avoid unnecessary trip (particularly for shopping or recreation); Interestingly a high number of respondents (more than 90% in Dhaka and more than 40% in Khulna) did not experience any difference in their commuting or daily travel. This has a multi-faceted interpretation. Firstly, during COVID-19 the government imposed a range of regulatory measures which reduced the number of vehicles. Moreover, demand for transport remained almost same but the number of passengers allowed to be carried in each public transport vehicle reduced significantly. Secondly, a high share of the elderly population does not use public transport. So for them, COVID-19 has not changed their travel costs in any way. However, for many people COVID-19 has caused a variety of challenges for their everyday essential travel. 10 13 3 3 13 7 0 2 4 6 8 10 12 14 Dhaka Khulna % of Respondents Before COVID-19 LCOVID-19 Lockdown COVID-19 (post-lockdown) 25 FINAL REPORT: IMPACTS OF COVID-19 ON MOBILITY OF PHYSICALLY CHALLENGED PEOPLE AND OLDER PEOPLE Nevertheless, the respondents were asked if they have any expectation or suggestion for improving travel and mobility. Only 17% in Dhaka and 22% in Khulna provided their suggestions for the period during COVID-19. These are: • Mass awareness generation to avoid unnecessary trips; • Strictly following the health guidelines (e.g. maintain physical distancing, wearing face mask, gloves use, disinfecting vehicles and terminals); • Limited passengers in public transport to ensure physical distancing; • More vehicles to be available in roads or increased number of buses with safety measures; • Providing ample walking space and parks for older people. • Maintaining physical distancing by carrying less passengers or by having a new type of auto rickshaw design. Beside these, the respondents mentioned that some measures should be taken to improve the overall mobility and access of elderly and disabled people even when the COVID-19 pandemic has finished. These are: • Improved public transport accessibility for elderly and disabled people; • Wheelchair access to public transport and built environment, considering special needs; • Reserved seats for disabled and elderly people; • Improved adherence by everyone to traffic rules and regulations; • Reduced fare rates for the poor and disabled people; • Improved road network with sidewalks, provision of separate lanes for wheelchair users • Reduced congestion; • Specified easybike stops for passenger pick-up points; • More walkways to accommodate all types of pedestrians; • A plan for sustainable transport focusing on poor and middle-income groups. 26 FINAL REPORT: IMPACTS OF COVID-19 ON MOBILITY OF PHYSICALLY CHALLENGED PEOPLE AND OLDER PEOPLE 5. Findings from Pakistan This chapter reports on data derived from Karachi and Lahore city of Pakistan. The data was collected from a household survey in various locations covering different socio-economic and spatial distributions in both cities. Totals of 209 and 237 respondents from Karachi and Lahore respectively were interviewed. An online survey received 88 responses, of which 77 were from Karachi, 5 were from Lahore, 3 from other cities and 3 from rural areas. 5.1 Socio-economic profile of the respondents Many respondents are in the age group of 61-70 with smaller numbers in other groups. A detailed socioeconomic profile of the respondents is available in Appendix E2. The highest proportion of the disabilities covered in the data concern knee/ joint pain because a large amount of data is obtained from the older people, and it is the most common problem for elders. Of the respondents, 57% in Karachi and 62% in Lahore do their daily needs themselves while 43% and 38% respectively are dependent on family members or relatives, as seen in Appendix Table E2-2. Only a small percentage of respondents (0.5%) in Karachi but none in Lahore live alone (Appendix Table E2-3). In Karachi, 42% of the respondents are from households consisting of 4-5 members, whereas 50% in Lahore belong to households comprising of 6-8 members. Figure 10 depicts the monthly household income distribution, showing that a highest proportions of respondents in Karachi are in the income groups GBP 251-500 and 100-250 while in Lahore it is in the income groups GBP 100-250 and below GBP 100 per month. A large proportion of the respondents in both cities have a range of individual expenditure between GBP 10-50 per month for personal use. The data in Appendix Figure E2-4 shows that in Karachi around 33% of the respondents are retired while in Lahore a high proportion of respondents are workers or day-labours (39%) and unemployed (25%). Figure 10: Respondent’s monthly household income and personal expenditure, Karachi and Lahore city Table 12 shows the vehicle ownership of the households; in both cities more than half of the households own private vehicles. Ownership of private vehicles is significantly higher in Karachi (82%) as compared to Lahore (58%). This is probably due to public transport facilities in Lahore having been improved after the Metrobus system and Orange Line initiatives, which provides residents with better public transport (even during the pandemic). These private vehicles consist of cars and motorcycles, with proportions of 46% and 36% respectively for Karachi and 27% and 31% for Lahore. Nevertheless, almost 11% of the respondents in Karachi never have access to the private vehicle owned by the household (in Appendix Table E2-3). 9 22 38 17 6 8 34 38 20 5 3 0 0 10 20 30 40 Below GBP 100 GBP 100- 250 GBP 251- 500 GBP 501- 700 GBP 701- 1,000 GBP 1,000+ % of Respondents Household Income Lahore Karachi 18 59 15 8 32 54 12 2 0 20 40 60 80 Below GBP 10 GBP 10- 50 GBP 51- 100 GBP 100+ % of Respondents Personal Expenditure Lahore Karachi 27 FINAL REPORT: IMPACTS OF COVID-19 ON MOBILITY OF PHYSICALLY CHALLENGED PEOPLE AND OLDER PEOPLE Table 12: Respondent’s household vehicle ownership, Karachi and Lahore city Vehicle Ownership Karachi Lahore Vehicle Number of Respondents % Respondents % No 37 18% 98 42% Yes Car Motorcycle 96 76 46 36 65 74 27 31 Sub-Total 172 82% 139 58% 5.2 Mobility and trips during COVID-19 (post-lockdown) 5.2.1 Travel pattern Almost half of the respondents travel alone though 48% in Karachi and 52% in Lahore travel accompanied by another person. Table 13 describes the travel patterns of the respondents during COVID-19. In Karachi, a smooth variation can be observed in the travel frequency of respondents, with around 20% of the respondents making trips with a high frequency, i.e. more than 5 trips per week. In Lahore, 50% of the respondents made trips with a frequency of 4-5 trips per week. Physical distancing and Standard Operating Procedures (SOPs) were followed by 74% of the respondents in Karachi, 5% more than in Lahore (69%). The major problems considered in travelling during the post-lockdown period, mentioned by 18% and 10% respondents from Karachi and Lahore respectively, include less travel, less availability of public transport and no proper enforcement of social distancing and SOPs. Table 13: Respondent’s travel frequency, Karachi and Lahore during COVID-19 post-lockdown Categories Karachi Lahore Number of Respondents % Number of Respondents % Travel Frequency Few times/ year 25 12% 2 1% Few times/ month 20 10% 5 2.5% 1 trip/ month 8 4% 2 1% 1 trip/ week 22 11% 52 24% 2-3 trips/ week 24 11% 46 21.5% 4-5 trips/ week 34 16% 108 50% 5+/ week 41 20% 0 0 Several times/ day 35 17% 0 0 Total 209 100% 215 100% Physical Distancing Yes 134 74% 148 69% No 48 26% 66 31% Availability of Public Transport Yes 79 87% 100 69% No 12 13% 45 31% Problems Due to COVID Yes 38 18% 22 10% To understand more detailed travel information, the respondents were questioned on their total number of trips during the previous week. As seen in Table 14, in Karachi the highest travel frequency was 1-2 trips per 28 FINAL REPORT: IMPACTS OF COVID-19 ON MOBILITY OF PHYSICALLY CHALLENGED PEOPLE AND OLDER PEOPLE week, made by 44% of respondents. In Lahore about 41% respondents made 5+ trips per week while a very small portion did not travel at all. The latter respondents usually travel just a few times per month or year. Table 14: Respondents’ trips, Karachi and Lahore city, in the previous week Travel Frequency of Respondents Karachi Lahore Respondents % Respondents % None 44 21% 14 7% 1-2/ week 91 44% 75 35% 3-5/ week 30 15% 36 17% 5+/ week 40 20% 88 41% Total 205 100% 213 100% The details of trip characteristics are discussed in the next section. 5.2.2 Trip characteristics Table 15 delineates the characteristics of trips including purpose, distance, travel time, travel cost, and mode used during COVID-19 (post-lockdown). In Karachi, main purpose of the trips was for work and shopping. Around 42% of the trips are travelled below 1 km distance, thus showing that elderly people usually make trips within the area close to home. The three major travel modes used for commuting in Karachi during COVID-19 (post-lockdown) were car, motorcycle and walking, with percentages of 28%, 21%, and 28% respectively. It shows that the most reliable and safe mode for people are private vehicles. Public transport was risky for elderly people, due to the potential contraction of coronavirus due to less enforcement of proper SOPs and physical distancing when travelling by buses and Chingchies5 . In Lahore, around 59% and 24% of trips were made with the major purposes of work and doctor visits, respectively. Around 46% of trips are between 2–10 kms in distance. The major travel modes used for commuting in Lahore during COVID-19 (post-lockdown) are rickshaw, motorcycle, and walking with percentages of 32%, 24%, and 19% respectively. The distance travelled for making most of the trips ranged from 1 to 10 km. The most preferred modes of transport were rickshaws, walking and private vehicles (car and motorcycle) with percentages 32%, 19%, and 40% respectively (seen in Table 15). Travel cost for most respondents in both cities during COVID-19 post-lockdown is between PKR6 20 (GBP 0.1) and PKR 200 (GBP 1). Table 15: Trip characteristics, Karachi and Lahore during COVID-19 post-lockdown Categories Karachi Lahore Number of Trips % Number of Trips % Trip Purpose Grocery 44 19% 19 8% Personal Need 37 16% 1 0% Doctor Visits 18 8% 55 24% Work 65 28% 138 59% Education 21 9% 4 2% Social 37 16% 9 4% Recreation 13 6% 7 3% Total 235 100% 233 100% Trip Distance Below 0.5 km 47 20% 20 8% 5 Chingchi is a three-wheeler public transport having low capacity: maximum 11 passengers (54). 6 PKR is the Pakistani currency. In November 2020, the conversion rate of 1 GB Pound was PKR 218 (Ltd, 2020). 29 FINAL REPORT: IMPACTS OF COVID-19 ON MOBILITY OF PHYSICALLY CHALLENGED PEOPLE AND OLDER PEOPLE Categories Karachi Lahore Number of Trips % Number of Trips % 0.5 - 1 km 51 22% 26 11% 1.1 – 2 km 21 9% 25 11% 2.1 – 5 km 31 13% 62 26% 5.1 – 10 km 38 16% 47 20% 10.1 – 20 km 28 12% 35 15% Above 20 km 19 8% 23 10% Total 235 100% 238 100% Travel Mode Walking 66 28% 44 19% Rickshaw 22 9% 75 32% Bus 15 6% 19 8% Car 66 28% 36 16% Motorcycle 50 21% 56 24% Chingchi 8 3% 2 1% Taxi, Uber/ Careem7 6 3% 0 0% Total 233 100% 232 100% Travel time Below 5 minutes 58 25% 13 5% 6 – 15 minutes 85 36% 60 25% 16-30 minutes 47 20% 106 45% 31-45 minutes 21 9% 21 9% 46 minutes -1 hour 12 5% 27 11% 1 - 2 hour 9 4% 8 3% 2+ hours 3 1% 2 1% Total 235 100% 237 100% Trip Cost None 70 30% 48 20% PKR 10 4 2% 0 0% PKR 11 – 20 14 6% 7 3% PKR 21 – 50 42 18% 56 24% PKR 51 – 100 41 17% 52 22% PKR 101 – 200 37 16% 35 15% PKR 201 – 500 23 10% 26 11% PKR 500+ 4 2% 14 6% Total 235 100% 238 100% 7 Careem is an e-hiring taxi service used in Pakistan as a paratransit mode (https://www.careem.com/) 30 FINAL REPORT: IMPACTS OF COVID-19 ON MOBILITY OF PHYSICALLY CHALLENGED PEOPLE AND OLDER PEOPLE 5.3 Mobility and trips during lockdown 5.3.1 Travel pattern During lockdown most of the respondents lived in their own house. However, a very few (7% and 5% respectively in Karachi and Lahore) were in other places (e.g. village, other city) before the lockdown and they returned home by airplane, bus and personal vehicle during lockdown. Table 16 describes the travel patterns of the respondents during the lockdown in Karachi and Lahore. A high percentage of the respondents, about 70% and 53% in Karachi and Lahore respectively, avoided travel during the lockdown and preferred to stay at home. In Karachi, the highest frequency for those that travelled (9%) was 4-5 trips per week, while in Lahore around 25.5% made one trip per week. Of the respondents who made trips during the lockdown, 76% in Karachi and 69% in Lahore followed the SOPs. Almost 44% in Karachi mentioned having problems regarding travel and mobility, including unavailability of public transport and no proper physical distancing maintained in public places. In Lahore only 11% of respondents had problems with mobility: such problems were because of the closure of various roads and because public transport and paratransit were difficult to reach. Table 16: Respondent’s travel frequency, Karachi and Lahore city during lockdown Categories Karachi Lahore Number of Respondents % Number of Respondents % Travel Frequency No travel 146 70% 126 53% Few times/ month 5 2% 1 0.5% 1 trip/ month 7 3.5% 1 0.5% 1 trip/ week 6 3% 60 25.5% 2-3 trips/ week 15 7% 15 6.5% 4-5 trips/ week 18 9% 18 7.5% 5+/ week 11 5% 12 5% Several times/ day 1 0.5% 2 1% Total 209 100% 235 100% Physical Distancing Yes 47 76% 77 69% No 15 24% 34 31% Availability of public transport Yes 32 52% 44 40% No 30 48% 66 60% Travel problems Yes 27 44% 12 11% 5.3.2 Trip characteristics Table 17 describes the characteristics of the trips including purpose, distance, travel time, travel cost, and mode used during lockdown. In Karachi, the main purposes of trips were those considered necessary, i.e. work, grocery, and personal needs. On the other hand, leisure trips, i.e. social gatherings and recreational trips, were avoided to remain safe from being infected. Around 65% of the trips were within the distance of 5 km. The three major travel modes used for commuting in Karachi during lockdown were car, walking, and motorcycle, with percentages of 29%, 26%, and 19% respectively. The priority in terms of travel mode is given to private vehicles as compared to public transport due to its unavailability during lockdown. Whereas in Lahore, around 40% and 42% of trips were for the purpose of work and doctor visits, respectively. Around 74% of the trips were within the distance of 5 km. The major travel modes used for commuting in Lahore during lockdown are walking, rickshaw, and motorcycle with a percentage of 31%, 28%, and 21% 31 FINAL REPORT: IMPACTS OF COVID-19 ON MOBILITY OF PHYSICALLY CHALLENGED PEOPLE AND OLDER PEOPLE respectively. The most preferred mode of transport was walking, rickshaw, and motorcycle with percentage of 31%, 28%, and 21% respectively. The travel cost during lockdown was between PKR 21-50 (GBP 0.1-0.25) and PKR 51-100 (GBP 0.25-0.45) for 18% and 15% respectively. Table 17: Trip characteristics, Karachi and Lahore city during lockdown Categories Karachi Lahore Number of Trips % Number of Trips % Trip Purpose Grocery 16 25% 13 12% Personal Need 13 21% 1 1% Doctor visits 6 10% 45 42% Work 22 35% 43 40% Education 0 0% 0 0% Social 4 6% 0 0% Recreation 2 3% 6 6% Total 63 100% 108 100% Trip Distance Below 0.5 km 10 16% 8 7% 0.5 - 1 km 11 18% 12 11% 1.1 – 2 km 9 15% 26 24% 2.1 – 5 km 10 16% 35 32% 5.1 – 10 km 7 11% 17 15% 10.1 – 20 km 8 13% 9 8% Above 20 km 7 11% 3 3% Total 62 100% 110 100% Travel Mode Walking 16 26% 34 31% Rickshaw 8 13% 30 28% Bus 5 8% 2 2% Car 18 29% 20 18% Motorcycle 12 19% 23 21% Qunichi 2 3% 0 0% Taxi, Uber/ Careem 1 2% 0 0% Total 62 100% 109 100% Travel time Below 5 minutes 12 19% 6 5% 6 – 15 minutes 23 37% 45 41% 16 - 30 minutes 13 21% 39 35% 31 - 45 minutes 7 11% 12 11% 46 minutes - 1 hour 1 2% 6 5% 1 - 2 hours 5 8% 2 2% 2+ hours 1 2% 0 0% Total 62 100% 110 100% 32 FINAL REPORT: IMPACTS OF COVID-19 ON MOBILITY OF PHYSICALLY CHALLENGED PEOPLE AND OLDER PEOPLE Categories Karachi Lahore Number of Trips % Number of Trips % Trip Cost None 17 27% 37 34% PKR 10 1 2% 0 0% PKR 11 – 20 6 10% 3 3% PKR 21 – 50 9 14% 20 18% PKR 51 – 100 10 16% 17 15% PKR 101 – 200 10 16% 15 14% PKR 201 – 500 8 13% 14 13% PKR 500+ 2 3% 4 4% Total 63 100% 110 100% 5.4 Mobility and trips before COVID-19 5.4.1 Travel pattern Before COVID-19, around 51% and 57% of the respondents in Karachi and Lahore respectively travelled alone while the remainder were accompanied or escorted by another person. Table 18 describes the travel frequency of the respondents before the COVID-19 pandemic. Most of the respondents in Karachi made either more than 5 trips per week (21%) or several times per day (25%), though some travelled only once in a week or month or several times per year. Whereas in Lahore most respondents (99%) did not travel several times daily, the most common frequencies were 4-5 trips per week (39%) and more than 5 trips per week (25%). Table 18: Respondent’s travel frequency, Karachi and Lahore city before COVID-19 Categories Karachi Lahore Number of Respondents % Number of Respondents % Travel Frequency Few times/ year 19 9% 2 2% Few times/ month 13 6% 9 8% 1 trip/ month 8 4% 2 2% 1 trip/ week 15 7% 8 7% 2-3 trips/ week 23 11% 19 17% 4-5 trips/ week 34 16% 44 39% 5+/ week 43 21% 29 25% Several times/ day 53 25% 1 1% Total 208 100 114 100 Availability of Public Transport Yes 152 73% 46 40% Transport Problems Yes 81 39% 44 39% Almost 73% of the respondents in Karachi and 40% in Lahore mentioned that before COVID-19 there was public transport availability for their trips. Only 39% of respondents in both cities encountered travel and mobility problems. The main problems were: traffic congestion, pollution, overcrowded buses, high travel costs of fuel, lack of accessibility to bus stops, improper lighting systems on roads (causing crimes), lack of 33 FINAL REPORT: IMPACTS OF COVID-19 ON MOBILITY OF PHYSICALLY CHALLENGED PEOPLE AND OLDER PEOPLE pedestrian facilities, lack of parking spaces, and lack of enforcement of traffic rules. Almost 50% of the respondents in both cities mentioned that on a typical day before COVID-19 they usually travelled or went outside their home once per day (see in Appendix Table E2-4). The characteristics of the trips are discussed in the next section. 5.4.2 Trip characteristics Table 19 shows the characteristics of trips, including purpose, distance, travel time, travel cost, and mode used, before COVID-19. In Karachi, the trips before COVID-19 were mainly for the purposes of work, shopping, and social gatherings with percentages of 23%, 19%, and 23% respectively. The table shows that around 8% of the trips were for recreation and leisure. The distance travelled before COVID-19 has a smooth variation from 0.5 km to 20 km. The most used travel modes are private vehicles and walking, which probably could be due to the poor condition of public transport and costly travel on paratransit modes. Around 28% are walking trips who usually prefer to walk within the area of residence to have a healthy activity and leisure time. In Lahore, 71% of the trips are for the purpose of work. The travel modes for a large portion are rickshaw and motorcycle (26% and 29% respectively), with walking accounting for 20% of trips. Table 19: Trip characteristics, Karachi and Lahore city before COVID-19 Categories Karachi Lahore Number of Trips % Number of Trips % Trip Purpose Grocery 57 19% 11 10% Personal Need 42 14% 1 1% Doctor visits 20 7% 14 13% Work 68 23% 79 71% Education 18 6% 2 2% Social 69 23% 2 2% Recreation 24 8% 3 2% Total 298 100% 112 100% Trip Distance Below 0.5 km 57 19% 18 16% 0.5 - 1 km 51 17% 12 10% 1.1 – 2 km 37 12% 10 9% 2.1 – 5 km 43 14% 32 28% 5.1 – 10 km 50 17% 10 9% 10.1 – 20 km 41 14% 15 13% Above 20 km 21 7% 18 16% Total 300 100% 115 100% Travel Mode Walking 84 28% 23 20% Rickshaw 24 8% 30 26% Bus 19 6% 10 9% Car 96 32% 17 15% Motorcycle 56 19% 33 29% Qunichi 10 3% 1 1% Taxi, Uber/ Careem 9 3% 0 0% 34 FINAL REPORT: IMPACTS OF COVID-19 ON MOBILITY OF PHYSICALLY CHALLENGED PEOPLE AND OLDER PEOPLE Categories Karachi Lahore Number of Trips % Number of Trips % Total 298 100% 114 100% Travel time Below 5 minutes 74 25% 6 5% 6 – 15 minutes 105 35% 26 22% 16 - 30 minutes 60 20% 54 47% 31 - 45 minutes 34 11% 8 7% 46 minutes - 1 hour 14 5% 14 12% 1 - 2 hours 10 3% 8 7% 2+ hr 2 1% 0 0% Total 299 100% 116 100% Trip Cost None 86 29% 27 23% PKR 10 7 2% 0 0% PKR 11 – 20 19 6% 5 4% PKR 21 – 50 43 14% 33 28% PKR 51 – 100 48 16% 22 19% PKR 101 – 200 55 18% 8 7% PKR 201 – 500 37 12% 11 9% PKR 500+ 5 2% 10 9% Total 300 100% 116 100% 5.5 Changes and difficulties due to COVID-19 5.5.1 Impacts of COVID-19 on travel and mobility Table 20 shows the trips performed per person before COVID-19 and during COVID-19. In Karachi, the average trip rate per day before the COVID-19 pandemic was 1.43 trips/ person, which decreased to 0.3 trips per person during the lockdown. After the lockdown restrictions were eased the daily trip rate increased to 1.12 trips per person. This shows that in post-lockdown or ‘neo-normal’ conditions, the trip rate is lower than in the before-pandemic situation because all the economic and social activities have not been fully restored during the post-lockdown situation. The trip rate values show that a major reduction in trips was found during lockdown in Karachi due to the unavailability of public transport, the closure of working places, and the initiation of online systems for education and working from home. For example, compared with the before COVID-19 situation, around 80% less trips were produced during lockdown while a 22% decrease was observed after lockdown. The data collected from Lahore shows that the average trip rate per day before COVID-19 was 0.98, during lockdown it was around 0.46, which increased to 0.47 after the lockdown restrictions were eased out. Table 20: Trips per person, Karachi and Lahore city Situation Trips/ respondent per day in Karachi city Trips/ respondent per day in Lahore city Trips/ respondent per day in Karachi from Online Survey During COVID-19 (post-lockdown) 1.12 0.47 0.95 During COVID-19 Lockdown 0.30 0.46 0.52 Before COVID-19 1.43 0.98 2.07 35 FINAL REPORT: IMPACTS OF COVID-19 ON MOBILITY OF PHYSICALLY CHALLENGED PEOPLE AND OLDER PEOPLE Table 21 describes various factors which contribute to affect mode choice behaviour in Pakistan. In general, before COVID-19 a small portion of commuters selected public transport, mainly because it was economical, with fares being comparatively cheaper than paratransit for long distance journeys. Private transport users find paratransit modes comfortable and faster in comparison with public transport modes. Figure 11 describes the effect of the COVID-19 on the modal distribution of trips in Karachi and Lahore. In Karachi, the usage of each mode is not affected in a long-term sense by the pandemic as the percentages of trips made by all modes before COVID-19 and after the lockdown are approximately the same. Both during COVID-19 and before COVID-19, a high percentage of trips are by means of private vehicles (i.e. 50% trips on car and motorcycle). Active transportation played a vital role in the lifestyles of elderly and disabled people, with walking being the second most used mode. The respondents preferred to make trips within walking distance of their residence to either nearby markets for shopping or to socialise and carry out recreational activities. Only 10% of the respondents use public transport facilities for their daily needs. Whereas in Lahore, the number of trips is much affected due to COVID-19 as compared to the time before the pandemic. The usage of active modes and paratransit is comparatively higher in percentage terms than public transport modes. A significant decrease is observed in the commuting trips using public transport during the lockdown, which is an indicator that the availability of public transport might have decreased during the lockdown. Furthermore, elderly people might have avoided the use of public transport to reduce the risk of getting infected from the COVID-19 virus. Active transportation and use of paratransit increased due to the pandemic for various reasons, such as the unavailability of public transport or lack of proper enforcement of SOPs/ social distancing. Table 21: Reason for selecting travel mode, Karachi and Lahore city Modes of Transportation Reason in Karachi city Reason in Lahore city Public transport Cheaper Cheap/ Cost-effective Private modes Comfortable, flexible, faster, Personal Mode Safe, comfortable, cheap, less travel time Paratransit Convenient, availability Comfortable, cheap Active modes Healthy lifestyle, Close to home Near to home Figure 11: Modal distribution of trips, Karachi and Lahore city during and before COVID-19 Figure 12 shows the modal distribution for all three scenarios using the data from the online survey. Similar observations to the household survey can be made - private vehicles comprise a large share of trips and, due to COVID-19, there is an increase in active transportation but a decrease in usage of public transport. The data shows that around 60% of the commuters use private vehicles to commute while only 11% were users of public transport before COVID-19, which has been further reduced to 7% after the lockdown restrictions were eased. Figure 13 shows the typical travel frequency of the respondents. The lockdown has decreased the trip 36 FINAL REPORT: IMPACTS OF COVID-19 ON MOBILITY OF PHYSICALLY CHALLENGED PEOPLE AND OLDER PEOPLE rate from several trips each day to 1 or 2-3 trips per week. In Lahore, the travel frequency of most of the respondents before the pandemic was 4-5 trips or 5+ trips per week, which is significantly affected during the lockdown. A significant decrease in the number of trips during lockdown is observed as the highest proportion of 1 trip per week is observed during the lockdown. Data collected through the online survey, as in Figure 14, shows that almost 25% of the respondents made several trips each day during lockdown and before COVID-19, which decreased to a few trips a month and 2-3 trips a week. During lockdown 1 trip in a month is also a common frequency observed for about 25% of the respondents. Figure 12: Modal Distribution of trips, Pakistan (Online Survey) Figure 13: Respondent’s travel frequency, Karachi and Lahore city during and before COVID-19 0% 20% 40% 60% 80% Public Private Paratransit Active Trips Percentage Modes of Transportation Modal Distribution Post Lockdown During Lockdown Before COVID 0 10 20 30 40 50 60 70 80 None Few times/year Few times/month 1/month 1/week 2-3/week 4-5/week 5+/week Several times/day None Few times/year Few times/month 1/month 1/week 2-3/week 4-5/week 5+/week Several times/day Karachi Lahore % of Respondents COVID-19 (post-lockdown) Lockdown Before COVID 37 FINAL REPORT: IMPACTS OF COVID-19 ON MOBILITY OF PHYSICALLY CHALLENGED PEOPLE AND OLDER PEOPLE Figure 14: Respondent’s travel frequency, Pakistan (Online Survey) Figure 15 illustrates that the trips made during lockdown were mostly for the purposes of grocery, work, and doctor visits, which shows that only trips with a necessary purpose were made during the lockdown. On the other hand, trips involving socialising, recreation, and education are most affected by the COVID-19 situation. However, the percentage of recreation trips in Lahore was higher during lockdown. The percentage of work trips in Karachi during COVID-19 lockdown was higher than before the COVID-19 situation because during lockdown almost 70% of the respondents avoided travel (see Table 16) and the remainder who travelled did so mostly for necessary purposes. In Lahore though most people travelled for the purpose of work, the percentage of work trips during COVID-19 lockdown and post-lockdown was lower as compared to before COVID-19. Similarly, data from the online survey (as in Figure 16) shows that the most common purposes of travel in Pakistan during lockdown were grocery, doctor visits and work. The travel and trip activities that decreased due to COVID-19 were socialisation and education, though a slight increase of recreation during lockdown was observed. Figure 15: Effect of COVID-19 on travel purpose in Karachi and Lahore city 0% 10% 20% 30% Few times/ year 1 trip/ month Few times/ month 1 trip/ week 2-3 trips/ week 4-5 trips/ week 5+ / week Several times/ day % of Respondents Trip Rate Post Lockdown During Lockdown Before COVID 38 FINAL REPORT: IMPACTS OF COVID-19 ON MOBILITY OF PHYSICALLY CHALLENGED PEOPLE AND OLDER PEOPLE Figure 16: Effects of COVID-19 on travel purpose, Pakistan (Online Survey) 5.5.2 Difficulties and expectations In general, finding public transport and using it for a trip in Karachi and Lahore is not easy. Figure 17 shows that in Karachi a large percentage of the respondents find it difficult or manageable to do so whereas in Lahore most of the respondents find it easy. A large portion in Lahore mentioned that it was easy or very easy. This is probably attributable to the recent improvements in public transport infrastructure, i.e. the Orange Line and Metrobus systems. On the other hand, in terms of navigating in the cities, or in identifying any location in the selected cities, a large portion of the respondents both in Karachi and Lahore reported that it was not difficult, i.e. that it was manageable, easy or very easy. Figure 17: Level of difficulty to find and use public transport The respondents were asked if they have faced any difficulties related to travel and mobility during and before COVID-19. Only 35% of the respondents in Karachi and 12% in Lahore mentioned that their typical travel and mobility had changed (e.g. travel less, fewer buses being available, bus routes changing) due to COVID-19. Almost 14% of the respondents mentioned either a change in their trip cost or that they are facing additional travel problems due to COVID-19. The reported difficulties in Karachi and Lahore before COVID-19 are: • Less accessibility to bus stops; 0% 10% 20% 30% 40% Trips Percentage Purpose Trip Purpose Post Lockdown During Lockdown Before COVID 0 10 20 30 40 50 60 Very hard Hard Manageable Easy Very Easy Very hard Hard Manageable Easy Very Easy Karachi Lahore % of Respondents Finding & Using Public Transport Finding (nevigating) a Location 39 FINAL REPORT: IMPACTS OF COVID-19 ON MOBILITY OF PHYSICALLY CHALLENGED PEOPLE AND OLDER PEOPLE • Uncomfortable public transport - highly crowded buses and no seats available, no room for wheelchairs; • Traffic congestion and high travel time; • Air pollution; • Less public transport and poor service, problem in getting into bus (drivers do not stop buses properly), less variety of modes options available; • Poor infrastructure e.g. road potholes or absent of pedestrian road crossing facilities, difficult for wheelchair users; • High fare or cost of fuel; • Garbage on street or parked cars on footpaths; • Lack of enforcement of traffic rules; • Improper lightning at night. The reported difficulties during COVID-19 are: • Less availability of public transport; • Travel cost increase; • Travel frequency affected - less travel; • Using mask is uncomfortable (particularly irritates while riding bike); • SOPs not followed properly in public transport; • Business affected and less social activity. The data collected from the survey shows that 98% and 91% of respondents from Karachi and Lahore respectively had no change in their occupation due to COVID-19. It shows that COVID-19 had no major effect on the occupation of older people, as most of them were not in a regular job before COVID-19. However, Figure 18 shows that 36% and 63% of the respondents in Karachi and Lahore respectively reported a decrease in their household income, while 25% and 42% respectively found that the trip cost had increased due to COVID-19. Figure 18: Variation of income and travel cost, Karachi and Lahore city due to COVID-19 The respondents were asked if they have any expectations or suggestions for improving travel and mobility. Only 19% of the respondents in Karachi provided their suggestions, though 87% in Lahore did so. The expectations and suggestions are similar for both cities. These are: • SOPs must be followed - physical distancing should be ensured with proper enforcement; 40 FINAL REPORT: IMPACTS OF COVID-19 ON MOBILITY OF PHYSICALLY CHALLENGED PEOPLE AND OLDER PEOPLE • Mandatory precautions, e.g. distributing masks and sanitisers in public transport, avoiding taking sick people in public transport; • Government should keep fare prices in control, provide subsidised transport or shuttle services during COVID-19; • Extend the lockdown time; • Taxi Apps for disabled people; • Overcrowding in public transport should be avoided; • More buses should be provided with high frequency; • Construct more roads and improve the construction quality of roads for inclusive design; • Providing more rickshaws; • Restrict or avoid using Chingchi; • Not to allow trucks operating in narrow streets; • Build new mass transit projects similar to the Orange Line train. • Government should decrease fuel cost; • Providing proper signs and markings in main roads. 41 FINAL REPORT: IMPACTS OF COVID-19 ON MOBILITY OF PHYSICALLY CHALLENGED PEOPLE AND OLDER PEOPLE 6. Findings from Tanzania This chapter reports on data derived from Dar-es-Salaam city and Zanzibar Unguja of Tanzania. The data was collected from a household survey in various locations covering different socio-economic and spatial distributions of both cities. Totals of 203 and 155 respondents from Dar-es-Salaam and Zanzibar respectively were interviewed. 6.1 Socio-economic profile of the respondents Most of the respondents are elderly people, and the age group 61-70 years is the highest (see Appendix Table E3-1). A detailed socio-economic profile of the respondents is available in Appendix E3. A very high proportion of the disabilities covered in the data concern knee/ joint pains (Figure E3-2). Of the respondents, 66% in Dares-Salaam and 55% in Zanzibar do their daily needs themselves while 34% and 45% respectively are dependent on family members or relatives (see Table E3-3). No respondents were found to live alone though very small proportions in both cities had a household size of 2-3 persons (Table E3-2). In Dar-es-Salaam 37% has 6-8 members but in Zanzibar 39% lived in households with size 8+ members. Monthly household income for almost half of the respondents in Dar-es-Salaam (44%) is GBP 50-100, while in Zanzibar it is GBP 50-100 for 40% and GBP 101-175 for 42%, as seen in Figure 19. Personal expenditure of the respondents reveals that most of the respondents in both cities spend only GBP 10-35 per month. Figure 19: Respondent’s household monthly income and individual expenditure, Dar-es-Salaam and Zanzibar Table 22: Respondent’s household vehicle ownership, Dar-es-Salaam and Zanzibar Vehicle Ownership Dar-es-Salaam City Zanzibar Unguja Vehicle Number of Respondents % Respondents % No 174 86% 110 71% Yes Car Motorcycle Bicycle 20 4 5 10 2 2 6 28 11 4 18 7 Sub-Total 29 14% 45 29% Table 12 shows the vehicular ownership of the households. Most of the respondents, 86% in Dar-es-Salaam and 71% in Zanzibar, do not have any household owned vehicle and are hence solely dependent on public transport. The remainder (14% and 29% respectively in Dar-es-Salaam and Zanzibar) have a personal vehicle in the household; car for the majority in Dar-es-Salaam but motorcycle in Zanzibar. However, of the respondents having a household vehicle, 14% and 18% of them respectively in Dar-es-Salaam and Zanzibar, never have access or have only very rare access to that vehicle (Appendix Table E3-5). This shows that the reliance on public transport is extremely high in both cities. 19 69 11 1 14 72 13 1 0 20 40 60 80 Below GBP 10 GBP 10- 35 GBP 36- 100 GBP 100+ % of Respondents Individual Expenditre Zanzibar Dar-es-Salaam 24 44 21 4 2 4 1 6 40 42 5 7 0 0 0 10 20 30 40 50 Below GBP 50 GBP 50 - 100 GBP 101 -175 GBP 176- 325 GBP 326- 500 GBP 501- 1,000 GBP 1000+ % of Respondents Household Income Zanzibar Dar-es-Salaam 42 FINAL REPORT: IMPACTS OF COVID-19 ON MOBILITY OF PHYSICALLY CHALLENGED PEOPLE AND OLDER PEOPLE 6.2 Mobility and Trips During COVID-19 (Post-Lockdown) This section discusses on travel frequency and the characteristics of trips during COVID-19 (post-lockdown8 ) for both cities in Tanzania. 6.2.1 Travel Pattern Most of the respondents travel alone, while only 17% and 21% in Dar-es-Salaam and Zanzibar respectively are accompanied or escorted by a person (see in Appendix Table E3-4). Of the accompanied persons, the majority are accompanied by a family member while only 5% and 1% respectively in Dar-es-Salaam and Zanzibar are accompanied by a friend or Good Samaritan9 . Table 13 describes the travel patterns of the respondents during COVID-19 post-lockdown. The highest frequency of travel in Dar-es-Salaam, involving more than half (59%) of the respondents, is 4-5 trips per week, while in Zanzibar Unguja the highest frequency (40% of the respondents) is 2-3 trips per week. Physical distancing and SOPs were mostly not adhered to both in Dar-esSalaam and Zanzibar, as mentioned by 90% and 87% respectively. Almost 90% and 94% respectively in Dar-esSalaam and Zanzibar mentioned that public transport is available during COVID-19. However, the major problems reported were lack of availability of public transport with proper enforcement of physical distancing. Table 23: Respondent’s travel frequency, Dar-es-Salaam and Zanzibar city during COVID-19 post-lockdown Categories Dar-es-Salaam City Zanzibar Unguja Number of Respondents % Number of Respondents % Travel Frequency Few times/ year 1 0.5 13 8.5 Few times/ month 1 0.5 00 00 1/ month 1 0.5 3 2 1/ week 2 1 29 19 2-3/ week 66 32.5 61 40 4-5/ week 119 59 42 27.5 5+/ week 13 6 5 3 Total 203 100% 153 100% Physical Distancing Yes 20 10 18 13% No 183 90% 118 87% Availability of Public Transport Yes 183 90% 132 94% No 20 10% 8 6% To understand more detailed travel information, the respondents were asked, what was their total number of trips during the previous week. As seen in Table 24, the majority in Dar-es-Salaam (61%) made 3-5 trips, while in Zanzibar 59% made 1-2 trips. Very small portions (0.5% and 10% respectively in Dar-es-Salaam and Zanzibar) did not travel at all during the previous week. These respondents usually travelled occasionally, just a few times per month or year. 8 In Tanzania, the “lockdown†implied: closure of schools and universities; requirement for public transport to maintain physical distancing of passengers, with passenger numbers limited to the number of seats; discouragement of public social activities; and enforcement of use of face masks. Livelihood and production activities continued as usual. The lockdown period lasted for about three months, ending in June 2020. 9 Member of the staff of the orphanage or old home called Good Samaritan, an NGO. 43 FINAL REPORT: IMPACTS OF COVID-19 ON MOBILITY OF PHYSICALLY CHALLENGED PEOPLE AND OLDER PEOPLE Table 24: Respondent’s trips, Dar-es-Salaam and Zanzibar previous week Travel Frequency in previous week Dar-es-Salaam Zanzibar Respondents % Respondents % None 1 0.5 15 10 1-2/ week 72 35.5 87 59 3-5/ week 124 61 41 28 5+/ week 6 3 4 3 Total 203 100% 147 100% The details of trip characteristics are discussed in the next section. 6.2.2 Trip characteristics Table 15 delineates the characteristics of trips including purpose, distance, travel time, travel cost, and mode used for the trips during COVID-19. In Dar-es-Salaam, trips were made having the main purposes of work and personal needs. The distance for around 36% of the trips is 2-5 km, whilst for 18% it is 1-2 km and for 16% it is 0.5-1 km. This reveals that elderly and disabled people usually travel within the area close to home. The two major travel modes used for commuting during COVID-19 are buses/ daladala and walking with percentages of 69% and 16% respectively, showing that the most manageable mode for people in Dar-es-Salaam is public transport as the private vehicle is often expensive. Whereas in Zanzibar, around 38.5% and 21.5% of trips were made for the purpose of work and personal needs. The distance for around 38% of the trips is 2-5 km and for 23% it is 1-2 km. The major travel modes used for commuting in Zanzibar during COVID-19 are buses/ daladala, walking, and motorcycle with 68%, 15%, and 11% using these modes respectively. More than half of the respondents in both cities mentioned that their average trip cost during COVID-19 is Tsh10 500-1000 (GBP 0.17-0.35), though a significant portion mentioned no cost for walking. Table 25: Trip characteristics, Dar-es-Salaam and Zanzibar during COVID-19 post-lockdown Categories Dar-es-Salaam City Zanzibar Unguja Number of Trips % Number of Trips % Trip Purpose Grocery 13 6% 23 16.5% Personal Need 32 16% 30 21.5% Doctor Visit 20 10% 11 8% Work 92 45% 54 38.5% Social 15 7% 21 15% Recreation 1 1% 1 1% Begging 30 15% 0 0 TOTAL 203 100% 140 100% Trip Distance Below 0.5 km 7 3% 4 3% 0.5 - 1 km 33 16% 14 9% 1.1 – 2 km 36 18% 35 23% 2.1 – 5 km 72 36% 59 38% 5.1 – 10 km 36 19% 21 13% 10 Tsh is Tanzanian currency. In November 2020, the conversion rate of 1 GBP was Tsh 3,050. 44 FINAL REPORT: IMPACTS OF COVID-19 ON MOBILITY OF PHYSICALLY CHALLENGED PEOPLE AND OLDER PEOPLE Categories Dar-es-Salaam City Zanzibar Unguja Number of Trips % Number of Trips % 10.1 – 20 km 13 6% 7 4% Above 20 km 3 2% 0 0 No Trip made 0 0 15 10% TOTAL 200 100% 155 100% Travel Mode Walking 33 16% 21 15% Wheelchair 8 4% 4 3% Bicycle 1 1% 1 1% Bus/ Daladala 141 69% 95 68% Car 8 4% 2 1.5% Motorcycle 7 3.5% 15 11% Tricycle 2 1% 0 0 Taxi, Uber 3 1.5% 2 1.5% TOTAL 203 100% 140 100% Reason for using the travel mode Low cost or save money 62 28 34 23.5 Manageable 141 63 86 60 Short distance/ trip 13 6 5 3.5 Own vehicle 7 3 16 11 Safe 0 0 3 2 Total 223 100% 144 100% Travel time Below 5 minutes 11 5% 3 2% 6 – 15 minutes 64 32% 56 36% 16 - 30 minutes 81 40% 67 43% 31 - 45 minutes 29 14% 9 6% 46 minutes - 1 hour 7 4% 1 1% 1 - 2 hours 9 4% 2 1% 2+ hours 2 1% 2 1% No Trip made 0 0 15 10% TOTAL 203 100% 155 100% Trip Cost None 75 37% 28 18% Below Tsh 500 0 0 2 1% Tsh 500 - 1,000 95 47% 80 52% Tsh 1,000 - 3,000 20 10% 8 5% Tsh 3,000 - 5,000 3 2% 9 6% Tsh 5,000 - 10,000 4 2% 11 7% Tsh 10,000 - 50,0000 5 2% 2 1% No Trip made 0 0 15 10% 45 FINAL REPORT: IMPACTS OF COVID-19 ON MOBILITY OF PHYSICALLY CHALLENGED PEOPLE AND OLDER PEOPLE Categories Dar-es-Salaam City Zanzibar Unguja Number of Trips % Number of Trips % TOTAL 202 100% 155 100% 6.3 Mobility and trips during lockdown 6.3.1 Travel pattern During lockdown most of the respondents lived in their own house. However, a very few (1.5% and 7.5% respectively in Dar-es-Salaam and Zanzibar) were in other places (e.g. village, other city) before the lockdown and they returned home by bus or personal car during lockdown (see Annex Table E3-6). Table 16 describes the travel pattern of the respondents during the lockdown. Many respondents, 37% in Dar-es-Salaam and 59% in Zanzibar, avoided travel during the lockdown and preferred to stay at home while the remaining mentioned that they travelled during lockdown. Of respondents who made trips during the lockdown, there was a frequency of travel of 2-3 trips per week for 33% and 18.5% respectively in Dar-es-Salaam and Zanzibar. Almost all in both cities mentioned that public transport was available for their trips during lockdown and that physical distancing was followed. Table 26: Respondent’s travel frequency, Dar-es-Salaam and Zanzibar city during lockdown Categories Dar-es-Salaam City Zanzibar Unguja Number of Respondents % Number of Respondents % Travel Frequency No trip made 75 37% 91 59% 1 trip/ month 2 1% 2 1% 1 trip/ week 17 8% 10 6.5% 2-3 trips/ week 66 33% 29 18.5% 4-5 trips/ week 41 20% 23 15% 5+/ week 2 1% 0 0% TOTAL 203 100% 155 100% Physical Distancing Yes 102 80% 58 90% No 26 20% 6 10% Availability of public transport Yes 118 93% 60 95% No 9 7% 3 5% 6.3.2 Trip characteristics Table 17 describes the characteristics of trips, including purpose, distance, travel time, travel cost, and mode used during lockdown. In Dar-es-Salaam, the purpose for most of the trips were for necessities (e.g. work, grocery, visit to doctor and personal needs) while leisure trips (e.g. social gatherings and recreational trips) were avoided to remain safe from being infected. Almost 74% of the trips were within the distance of 5 km indicates the majority are avoiding travel longer distance. The major travel modes used for commuting in Dares-Salaam during lockdown were bus/ daladala and walking with a percentage of 58% and 19% respectively. The priority in terms of travel mode is given to public transport as compared to private vehicle due to cost savings or lower trip cost. Whereas in Zanzibar, the purpose for most of the trips were for work and grocery/ shopping purposes with around 59% and 25% respectively. The distance for 77% trips are within 5 km. The major travel modes used for commuting in Zanzibar during lockdown are bus/ daladala, motorcycle, and walking with a percentage of 46 FINAL REPORT: IMPACTS OF COVID-19 ON MOBILITY OF PHYSICALLY CHALLENGED PEOPLE AND OLDER PEOPLE 67%, 20%, and 8% respectively. The travel cost for most of the trips during lockdown is between Tsh 500-1000 (GBP 0.17-0.35) in both cities. Table 27: Trip characteristics, Dar-es-Salaam and Zanzibar city during lockdown Categories Dar es Salaam Zanzibar Number of Trips % Number of Trips % Trip Purpose Grocery 18 14% 16 25% Personal Need 7 5% 3 5% Doctor visits 11 9% 6 9% Work 66 52% 38 59% Social 1 1% 1 2% Recreation 0 0% 0 0% Begging 25 19% 0 0% TOTAL 128 100% 64 100% Trip Distance Below 0.5 km 12 9.5 0 0% 0.5 - 1 km 17 13.5 3 4% 1.1 – 2 km 19 15 14 22% 2.1 – 5 km 47 36 32 51% 5.1 – 10 km 26 20.5 12 19% 10.1 – 20 km 6 4.5 3 4% Above 20 km 1 1 0 0% TOTAL 128 100% 64 100% Travel Mode Walking 24 19% 5 8% Wheelchair 11 9% 0 0% Bicycle 1 1% 0 0% Bus/ Daladala 75 58% 44 67% Car 8 6% 2 3% Motorcycle 6 5% 13 20% Tricycle 1 1% 0 0% Taxi, Uber 2 1% 1 2% TOTAL 128 100% 64 100% Reason for Using the Travel Mode Low cost or save money 32 25 8 12.5 Short trip/ distance 11 8.5 1 1.5 Manageable 80 62.5 45 70 Own vehicle 5 4 10 16 Total 128 100% 64 100% Travel time Below 5 minutes 11 9% 0 0% 47 FINAL REPORT: IMPACTS OF COVID-19 ON MOBILITY OF PHYSICALLY CHALLENGED PEOPLE AND OLDER PEOPLE Categories Dar es Salaam Zanzibar Number of Trips % Number of Trips % 6 – 15 minutes 40 33% 31 48% 16 - 30 minutes 55 43% 26 40% 31 - 45 minutes 16 12% 4 6% 46 minutes - 1 hour 3 2% 1 2% 1 - 2 hours 2 2% 1 2% 2+ hours 1 1% 1 2% TOTAL 128 100% 64 100% Trip Cost None 63 49% 5 8% Below Tsh 500 0 0% 1 2% Tsh 500 - 1,000 53 41% 38 59% Tsh 1,000 - 3,000 6 5% 8 12% Tsh 3,000 - 5,000 1 1% 7 11% Tsh 5,000 - 10,000 2 2% 5 8% Tsh 10,000 - 50,000 3 2% 0 0% Tsh 50,000+ 0 0% 0 0% TOTAL 128 100% 64 100% 6.4 Mobility and trips before COVID-19 6.4.1 Travel pattern Table 18 describes the travel frequency of the respondents before COVID-19 pandemic. Most respondents both in Dar-es-Salaam and Zanzibar had 2-3 trips or 4-5 trips per week. A few of them travelled very occasionally (e.g. few times in a month or year) while a few other very frequently (e.g. 5+ trips per week). Almost all the respondents (86% and 92% respectively in Dar-es-Salaam and Zanzibar) mentioned that before COVID-19 there was public transport available for their trips. Table 28: Respondent’s travel frequency, Dar-es-Salaam and Zanzibar Unguja before COVID-19 Categories Dar es Salaam City Zanzibar Unguja Number of Respondents % Number of Respondents % Travel Frequency Few times/ year 00 00 7 5 Few times/ month 1 0.5 4 2.5 1/ month 1 0.5 1 0.5 1/ week 6 3 29 19 2-3/ week 82 40.5 60 39.5 4-5/ week 96 47.5 47 31 5+/ week 16 8 4 2.5 Total 202 100% 152 100% Availability of Public Transport Yes 174 86 140 92 No 28 14 12 8 48 FINAL REPORT: IMPACTS OF COVID-19 ON MOBILITY OF PHYSICALLY CHALLENGED PEOPLE AND OLDER PEOPLE More than 90% of the respondents in both cities mentioned that on a typical day before COVID-19 they usually travelled or went outside of their home for once per day. The characteristics of the trips are discussed in the next section. 6.4.2 Trip characteristics Table 19 describes the characteristics of the trips including purpose, distance, travel time, travel cost, and mode used for trips before COVID-19. In Dar-es-Salaam, though the main purpose of the trips for half of the respondents (49%) is for work, for 14% and 8% respectively it is for personal needs and social activities. The distance travelled before COVID-19 has a smooth variation from below 1 km to 20 km though the majority are within 5 km. The most used travel mode is bus/ daladala though all other modes are used by the remaining small portion of respondents. Ease of mode use, low cost and manageability are the main reasons for walking or using public transport. In Zanzibar, the majority (44%) of the respondents are also commuting for work though social and personal needs are also significant. Though the travel mode for most trips is bus/ daladala (70%), the use of motorcycles is also significant (13%). Table 29: Trip characteristics, Dar-es-Salaam and Zanzibar Unguja before COVID-19 Categories Dar es Salaam City Zanzibar Unguja Number of Trips % Number of Trips % Trip Purpose Grocery 14 7% 24 17% Personal Need 29 14% 25 18% Doctor 15 7% 12 8% Work 99 49% 62 44% Education 1 1% 0 0% Social 16 8% 22 16% Begging 29 14% 0 0% TOTAL 203 100% 145 100% Trip Distance Below 0.5 km 6 3% 3 2% 0.5 - 1 km 35 17% 17 11% 1.1 – 2 km 23 11% 28 18% 2.1 – 5 km 83 41% 66 43% 5.1 – 10 km 46 23% 25 16% 10.1 – 20 km 6 3% 6 4% Above 20 km 4 2% 0 0% No Trip Made 0 0% 10 6% TOTAL 203 100% 155 100% Travel Mode Walking 36 18% 19 13% Wheelchair 9 4% 5 3% Bicycle 1 1% 2 1% Bus/ Daladala 136 67% 98 70% Car 8 4% 3 2% Motorcycle 6 3% 19 13% 49 FINAL REPORT: IMPACTS OF COVID-19 ON MOBILITY OF PHYSICALLY CHALLENGED PEOPLE AND OLDER PEOPLE Categories Dar es Salaam City Zanzibar Unguja Number of Trips % Number of Trips % Tricycle 2 1% 0 0% Taxi, Uber 5 2% 2 1.5% TOTAL 203 100% 148 100% Reason for using the travel mode Low cost or save money 51 25 23 15 Short trip/ distance 12 6 1 1 Own vehicle 7 3.5 15 10 Manageable 133 65.5 111 73 Safe 0 0 2 1 Total 203 100% 152 100% Travel time Below 5 minutes 10 5% 4 2% 6 – 15 minutes 61 30% 54 35% 16 - 30 minutes 89 44% 74 48% 31 - 45 minutes 30 14% 9 6% 46 minutes - 1 hour 6 3% 0 0% 1 - 2 hours 6 3% 1 1% 2+ hours 1 1% 3 2% No Trip Made 0 0% 10 6% TOTAL 203 100% 155 100% Trip Cost None 81 40% 30 19% Below Tsh 500 0 0% 0 0% Tsh 500 - 1,000 96 47% 84 54% Tsh 1,000 - 3,000 15 7% 9 6% Tsh 3,000 - 5,000 6 3% 8 5% Tsh 5,000 - 10,000 3 2% 13 8% Tsh 10,000 - 50,000 2 1% 1 1% Tsh 50,000+ 0 0% 0 0% No Trip Made 0 0% 10 7% TOTAL 203 100% 155 100% 6.5 Changes and difficulties due to COVID-19 6.5.1 Impacts of COVID-19 on mobility and trips Around 65% fewer trips were produced during lockdown compared with before COVID-19, while after the lockdown more than 30% increase was observed compared with the lockdown situation. However, the trips performed per person during and before COVID-19, as shown in Table 30, are almost the same for before COVID-19 and during COVID-19 post-lockdown. However, a slight decrease in the trips was found during the lockdown due to the unavailability of public transport and the closure of some workplaces and education centres. 50 FINAL REPORT: IMPACTS OF COVID-19 ON MOBILITY OF PHYSICALLY CHALLENGED PEOPLE AND OLDER PEOPLE Table 30: Trips per person, Der-es-Salaam and Zanzibar Unguja COVID-19 Situation Trips per respondent per day Dar-es-Salaam City Zanzibar Unguja During COVID-19 (post-lockdown) 1.10 1.05 During Lockdown 0.60 0.45 Before COVID-19 1.12 1.17 Only 2% of the respondents in Dar-es-Salaam mentioned that their typical travel and mobility has changed (e.g. travel less, lesser buses are available, changed the route) due to COVID-19 while nobody from Zanzibar mentioned any change. In both cities, nobody mentioned either any change in trip cost or any additional travel problems due to COVID-19. However, almost all the respondents reported no change in occupation but a decrease of household income. Table 31: Reason for selecting travel mode, Dar-es-Salaam and Zanzibar Unguja Modes of Transportation Dar-es-Salaam City Zanzibar Unguja Public Cheaper, Manageable Cheap/ Cost-effective Private Comfortable, Personal Mode Personal Mode, Safe, comfortable Active Healthy lifestyle, Close to home Near to home, Manageable Various causes of mode choice by the respondents, as in Table 21, are mentioned, such as cheaper fares or cost effectiveness for public transport. Private transport users mentioned that private transport was a more comfortable and safer mode than other modes. Figure 20 shows the effects of the COVID-19 on the modal distribution of trips. Travel mode usage is not affected as the percentages of trips made by all modes before COVID-19 and after lockdown are approximately the same in both cities. However, a slight decrease in public transport and increase in private vehicles is observed in Dar-es-Salaam. In Zanzibar, there is a slight increase in private vehicles and in public transport but a decrease in active modes. Figure 20: Modal distribution of trips, Dar-es-Salaam and Zanzibar Unguja during and before COVID-19 Figure 21 shows the typical travel frequency of the respondents during lockdown, post-lockdown and before COVID-19. Generally, the concentration of trips remained the same, between one and five trips per week, but the trip frequency reduced during lockdown for many of the respondents. For example, in Dar-es-Salaam 0 10 20 30 40 50 60 70 80 90 100 Public Private Wheelchair Active (%) Modes of Transportation Dar es Salaam City Post Lockdown During Lockdown Before COVID 0 10 20 30 40 50 60 70 80 90 100 Public Private Wheelchair Active (%) Modes of Transportation Zanzibar Unguja Post Lockdown During Lockdown Before COVID 51 FINAL REPORT: IMPACTS OF COVID-19 ON MOBILITY OF PHYSICALLY CHALLENGED PEOPLE AND OLDER PEOPLE 0 10 20 30 40 50 60 70 80 (%) Zanzibar Unguja Post Lockdown During Lockdown Before COVID most of the respondents' average travel frequency before COVID-19 was 4-5 trips per week but during lockdown the proportion of respondents having 4-5 trips per week is much less. For the majority it is 2-3 trips per week or no trips per week. Figure 21: Respondent’s travel frequency, Dar-es-Salaam and Zanzibar during and before COVID-19 Figure 22: Effects of COVID-19 on travel purpose, Dar-es-Salaam and Zanzibar Figure 22 illustrates that the purposes of trips made during lockdown were mostly for work, grocery, and doctor visits, so it can be assumed that only trips with a necessary purpose are made. The pattern of trip purposes did not change much during COVID-19 lockdown in Dar-es-Salaam and Zanzibar because most of the workplaces remained open and production activities continued to sustain life. The proportion of trips for work is higher during lockdown compared with post-lockdown and before COVID-19. There was also an increase in trips for grocery, including market or purchase of vegetables or necessities. On the contrary, the trips for socialising, recreation, and personal needs were reduced during COVID-19 lockdown. 0 10 20 30 40 50 60 70 None Few times/year Few times/month 1/month 1/week 2-3/week 4-5/week 5+/week Several times/day None Few times/year Few times/month 1/month 1/week 2-3/week 4-5/week 5+/week Several times/day Dar-es-Salaam Zanzibar % of Respondents COVID-19 (post-lockdown) Lockdown Before COVID 0 10 20 30 40 50 60 70 80 (%) Dar es Salaam City Post Lockdown During Lockdown Before COVID 52 FINAL REPORT: IMPACTS OF COVID-19 ON MOBILITY OF PHYSICALLY CHALLENGED PEOPLE AND OLDER PEOPLE 6.5.2 Difficulties and expectations In general, finding public transport for a trip in Dar-es-Salaam and Zanzibar is not easy. Though more than half of the respondents in both cities mentioned ‘manageable’, as shown in Figure 23, a small portion mentioned that it is difficult or very difficult. Similarly, in terms of difficulty level faced by commuters in navigating in the cities or in identifying any location in the selected cities, a small portion of the respondents in both cities mentioned difficult or very difficult, though the majority said it is ‘manageable’. Figure 23: Level of difficulty in finding public transport, Dar-es-Salaam and Zanzibar The respondents were asked if they have faced any difficulties related to travel and mobility during and before COVID-19. Figure 24 shows that only a few respondents mentioned that they had a problem; the number is comparatively higher in both cities during lockdown. Figure 24: Proportion of respondents facing travel problems, Dar-es-Salaam and Zanzibar The reported difficulties in both cities are similar. The difficulties before COVID-19 are: • Public transport is not friendly and accessible for disabled and elderly people; • Conductors sometime do not allow to board in the buses/ daladala; • Disrespect of young people in the buses; and • Traffic jam particularly in Dar-es-Salam. The difficulties during COVID-19 (post-lockdown) are reported as the same for before COVID-19 pandemic. However, it was mentioned that boarding a bus/ daladala is usually very difficult which become more complicated due to COVID-19 and two respondents in Dar-es-Salaam mentioned inability to afford the fare 0 10 20 30 40 50 60 70 80 Very hard Hard Manageable Easy Very Easy Very hard Hard Manageable Easy Very Easy Dar-es-Salaam Zanzibar % of Respondents Finding & Using Public Transport Finding (nevigating) a Location 0 2 4 6 8 10 12 14 16 18 Dar-es-Salaam Zanzibar % of Respondents Before COVID-19 COVID-19 Lockdown COVID-19 (post-lockdown) 53 FINAL REPORT: IMPACTS OF COVID-19 ON MOBILITY OF PHYSICALLY CHALLENGED PEOPLE AND OLDER PEOPLE due to decrease of income. During lockdown, the difficulties mentioned for before COVID-19 and for postlockdown persists and added the following: • Longer waiting time or walk because lesser amount of public transport vehicles (e.g. buses/ daladala) are available; • Poor safety precaution e.g. physical distancing in public transport is not maintained; • Wearing a mask is uncomfortable for breathing. Nevertheless, the respondents were asked if they have any expectation or suggestion for improving their travel and mobility. Only 4% and 2% of the respondents in Dar-es-Salaam and Zanzibar respectively provided their suggestions. The suggestions are almost similar in both cities. These are: • Improved public transport accessible for elderly and disabled people; • Reduced fare rates in public transport for elderly and disabled people; • Provision of dedicated or special bus services only for elders and disabled people; • Increase the number of public transport vehicles; and • Considering COVID-19, need to avoid overcrowding in public transport and awareness campaign to follow protective measures such as mask using and physical distancing. 54 FINAL REPORT: IMPACTS OF COVID-19 ON MOBILITY OF PHYSICALLY CHALLENGED PEOPLE AND OLDER PEOPLE 7. Findings from Zambia This chapter reports on data derived from Lusaka and Kitwe city in Zambia. Totals of 201 and 211 respondents from Lusaka and Kitwe respectively were collected from a household survey and analysed. The enumerators used an App based questionnaire in the Smartphone or Tab instead of a paper-based printed questionnaire for conducting the household surveys. 7.1 Socio-economic profile of the respondents Many respondents in Lusaka are older people of age group 61-70 years while in Kitwe are disabled people of age group 40-60 years (see in Appendix Table E4-1). A detailed socio-economic profile of the respondents is available in Appendix E4. Of the respondents, 63% and 62% in Lusaka and Kitwe respectively, do their daily needs themselves while the remaining are dependent on their family members or relatives (Table E4-4). Only a small percentage of the respondents, 4% and 1.5% respectively in Lusaka and Kitwe, live alone (in Table E4- 3). Most of the respondents are from households consisting of 6-8 members. Monthly household income indicates that many of the respondents in Lusaka are in income groups below GBP 50 and GBP 50-100 while in Kitwe a large portion fall in the income groups below GBP 50 and GBP 201-400 (Figure 25). A large proportion of the respondents in both cities are in lower income groups. This also been reflected in the monthly personal expenditure of the respondents. Figure 25: Respondent’s monthly household income and individual expenditure, Lusaka and Kitwe Table 32: Respondent’s household vehicle ownership, Lusaka and Kitwe Vehicle Ownership Lusaka Kitwe Vehicle Number of Respondents % Respondents % No 146 72% 128 61% Yes Car Motorcycle Bicycle 37 5 13 18.4 2.5 6.5 79 0 4 37 0 2 Sub-Total 55 28% 83 39% Most of the respondents do not have any household owned vehicle. Only 28% in Lusaka and 39% in Kitwe have a personal vehicle in the household and for the majority it is a car, as seen in Table 32. However, of the respondents having a household vehicle, many of them have a very rare or no access to that vehicle (Appendix Table E4-7). It shows that the reliance on public transport is extremely high in both cities. 56 24 10 6 3 1 35 15 17 27 5 1 0 10 20 30 40 50 60 Below GBP 50 GBP 50- 100 GBP 101- 200 GBP 201- 400 GBP 401- 800 GBP 800+ % of Respondents Household Income Kitwe Lusaka 57 14 12 8 9 23 35 9 25 8 0 20 40 60 Below GBP 10 GBP 10- 40 GBP 41- 100 GBP 101- 200 GBP 200 + % of Respondents Individual Expenditure Kitwe Lusaka 55 FINAL REPORT: IMPACTS OF COVID-19 ON MOBILITY OF PHYSICALLY CHALLENGED PEOPLE AND OLDER PEOPLE 7.2 Mobility and trips during COVID-19 (post-lockdown) This section provides information on travel patterns and characteristics of trips during COVID-19 (postlockdown11) for both cities in Zambia. 7.2.1 Travel pattern Most of the respondents travel alone while only 35% and 26% respectively in Lusaka and Kitwe are accompanied or escorted by another person (Appendix Table E4-5). The average frequency of trips is shown in Table 33. A large portion of the respondents in Lusaka (28% and 22% respectively) make 2-3 trips or 4-5 trips per week while almost half of the respondents in Kitwe (47.5%) make more than 5 trips per week. There are several respondents who travel just a few times in a year or month. Physical distancing during the trip was not adhered to by almost half of the respondents, 50% and 32% respectively in Lusaka and Kitwe. More than twothird of the respondents, 79% and 76% respectively in Lusaka and Kitwe, mentioned that public transport is available for their trips during COVID-19. Table 33: Respondent’s travel frequency, Lusaka and Kitwe city during COVID-19 post-lockdown Categories Lusaka Kitwe Number of Respondents % Number of Respondents % Travel Frequency Few times/ year 17 8.5 8 4 Few times/ month 9 4.5 27 13 1/ month 10 5 1 0.5 1/ week 33 16.5 3 1.5 2-3/ week 57 28 39 18.5 4-5/ week 44 22 28 13 5+/ week 24 12 101 47.5 Several times/ day 7 3.5 4 2 Total 201 100% 211 100% Physical Distancing Yes 100 50% 144 68% No 101 50% 67 32% Availability of Public Transport Yes 158 79% 160 76% No 43 21% 51 24% Problems Due to COVID Yes 90 45% 90 43% To understand more detailed travel information, the respondents were questioned on their total number of trips during the previous week. As seen in Table 34, half of the respondents in Lusaka mentioned 1-2 trips per week during COVID-19 post-lockdown while in Kitwe it was 5+ trips per week. The higher frequency of trips in Kitwe could be attributed to less strict enforcement (and hence more available travel modes), or to Kitwe being an industrial city, with many respondents travelling for work. Several respondents (7% and 11% in Lusaka and Kitwe respectively) did not travel at all during previous week: such respondents usually travel on a more occasional basis i.e. a few times in a year. 11 In Zambia, the “lockdown†implied closure of schools and universities, discouragement of public social activities, requirement to maintain physical distancing and enforcement of face mask but the livelihood and production activities continued as usual. 56 FINAL REPORT: IMPACTS OF COVID-19 ON MOBILITY OF PHYSICALLY CHALLENGED PEOPLE AND OLDER PEOPLE Table 34: Respondent’s trips, Lusaka and Kitwe city previous week or month Travel Frequency in last week Lusaka Kitwe Frequency % Frequency % None 14 7 23 11 1-2/ week 101 50 39 18.5 3-5/ week 46 23 34 16 5+/ week 35 17.5 110 52 1-2/ month 4 2 0 0 3-5/ month 1 0.5 5 2.5 Total 201 100% 211 100% The details of trip characteristics are discussed in the next section. 7.2.2 Trip characteristics The major purposes of trips during COVID-19 are shown in Table 35. Most of the trips were for the purpose of work, personal needs, and doctor visits with 17%, 24%, and 17% respectively in Lusaka, while in Kitwe the main purposes were for work, social, and others/business with 31%, 15% and 19.5% respectively. The purposes of grocery and social visits were also significant in both cities. Table 35: Respondent’s trip characteristics, Lusaka and Kitwe city post-COVID-19 post-lockdown Categories Lusaka City Kitwe Unguja Number of Trips % Number of Trips % Trip Purpose Grocery 21 10.5 22 10.5 Personal Need 49 24 21 10 Doctor Visits 34 17 16 7.5 Work 34 17 65 31 Education 7 3.5 11 5 Social 24 12 32 15 Recreation 1 0.5 3 1.5 Others/ Business 31 15.5 41 19.5 TOTAL 201 100% 211 100% Trip Distance Below 0.5 km 40 20 10 5 0.5 – 1 km 48 24 17 8 1.1 - 2 km 33 16.5 16 7.5 2.1 - 5 km 37 18 54 26 5.1 - 10 km 26 13 81 38 10.1 - 20 km 8 4 11 5 20+ km 5 2.5 12 5.5 Outside of the city 4 2 10 5 Total 201 100% 211 100% Travel Mode Walking 89 44 28 13.5 57 FINAL REPORT: IMPACTS OF COVID-19 ON MOBILITY OF PHYSICALLY CHALLENGED PEOPLE AND OLDER PEOPLE Categories Lusaka City Kitwe Unguja Number of Trips % Number of Trips % Wheelchair 10 5 12 6 Bicycle 1 0.5 9 4 Bus 65 32 70 33 Car 21 11 79 37.5 Motorcycle or Pathao 3 1.5 00 00 Taxi or Uber 12 6 13 6 Total 201 100% 211 100% Travel time Below 5 minutes 14 7 4 2 6-15 minutes 43 21.5 28 13.5 16-30 minutes 79 39 92 43.5 31-45 minutes 29 14.5 50 23.5 45 minutes – 1 hour 19 9.5 22 10.5 1 - 2 hour 10 5 7 3 2+ hours 7 3.5 8 4 TOTAL 201 100% 211 100% Trip Cost (ZMW or K12) None or Not Applicable 00 00 00 00 K 10 – 20 124 62 69 32.5 K 21 – 30 29 15 22 10.5 K 31 – 40 8 4 33 15.5 K 41 – 50 7 4 12 5.5 K 51 – 60 4 2 10 5 K 61 – 70 2 1 2 1 K 71 – 80 5 2.5 00 00 K 81+ 22 11 63 30 Total 201 100% 211 100% As can be seen in Table 35, the trip distance is spread mostly up to 20 km, though the majority in Lusaka are shorter (e.g. below 5 km) while in Kitwe are longer (e.g. 5-10 km). The three major travel modes in Lusaka during COVID-19 are buses, walking, and car, with percentages of 32%, 44%, and 11% respectively. In Kitwe, the major travel modes are buses, car, and walking with 33%, 37.5%, and 13.5% respectively. These figures indicate that beside walking, public transport is the most manageable mode for many respondents. The travel time for more than half of the trips is within 30 minutes in both cities, probably due to short trip distances for the majority, though a small portion of the trips require above 1-2 hour or 2+ hours. The trip cost for the majority is very low, e.g. K 10-20 (GBP 0.40-0.75), in both cities. However, a large portion (30%) in Kitwe has a very high cost, e.g. K 80+ (GBP 3), probably because they hire or reserve the vehicle. Low travel cost or fare and saving money are the main reasons for using a travel mode for the majority in both cities (Table 36). The other reasons for selecting a mode are the efficient or fast mode and short distance in Lusaka. In Kitwe, the main other reasons are: availability or only mode; comfortable; and easy access and convenient. 12 Zambian currency ZMW or kwacha. In November 2020, value of GB pound was equivalent to ZMW or K 26. 58 FINAL REPORT: IMPACTS OF COVID-19 ON MOBILITY OF PHYSICALLY CHALLENGED PEOPLE AND OLDER PEOPLE Table 36: Reason for selecting travel mode, Lusaka and Kitwe during COVID-19 post-lockdown Reason for Selecting Travel Mode Lusaka City Kitwe City Respondent % Respondent % Available/ only mode 17 9 54 25.5 Easy access, convenient 15 8 31 14.5 Comfortable 4 2 51* 23.5 Low cost/ fare or save money 73 37.5 54 25.5 Short trip/ distance 19 10 4 2 Can’t walk, difficult to use bus 14 7 0 0 Health purpose or fitness 4 2 3 1.5 Own vehicle 7 3.5 5 3 Efficient & effective, fast 36 18.5 8 4 Others* 5 2.5 1 0.5 Total 194 100 211 100 * Others include the answers preferred, no vehicle is available, secured travel mode. 7.3 Mobility and trips during lockdown 7.3.1 Travel pattern During lockdown most of the respondents lived in their own house. However, a few (19% and 15% respectively in Lusaka and Kitwe) were in other places (e.g. village, another part of the city, other city) before the lockdown and they returned home during lockdown (Appendix Table E4-6). Only a very few respondents (6% in both cities) avoided travel, but the remainder travelled and went outside of home during lockdown. Table 37 shows the frequency of their travel during the lockdown; almost half of the respondents in both cities travelled 2-3 times per week. A large portion in Lusaka travelled once per week, while in Kitwe a large number travelled 4-5 times or 5+ times per week. Table 37: Respondent’s travel frequency, Lusaka and Kitwe city during lockdown Travel Frequency (trip per Week) Lusaka Kitwe Respondent % Respondent % None 12 6 12 6 Weekly 1 (or 3-4 per month) 63 32.5 5 2 Weekly 2-3 times 79 40 96 48 Weekly 4-5 times 31 15 47 23 Weekly 5+ times 13 6.5 44 22 Total 198 100 204 100 7.3.2 Trip characteristics Table 38 describes the characteristics of trips, including purpose, distance, travel time, travel cost, and mode used during lockdown. The main purposes for travel during lockdown are work, personal needs and purchase grocery or shopping. Trip distance for the majority in Lusaka is small, such as less than 0.5 km or 0.5-1 km, while in Kitwe is longer such as 2.1-5 km and 5.1-10 km. Most trips in Lusaka were on foot (because of short distances) or by bus while in Kitwe the majority were by bus or taxi. The main reasons for selecting a travel mode were mentioned as ‘efficient or easy access’ and ‘low cost’ in Lusaka while in Kitwe it was mentioned that they ‘like the mode’ or ‘preferred mode’ by many respondents. 59 FINAL REPORT: IMPACTS OF COVID-19 ON MOBILITY OF PHYSICALLY CHALLENGED PEOPLE AND OLDER PEOPLE Travel time for most of the trips during lockdown was 6-15 minutes or 16-30 minutes in both cities. Less travel time was needed because of short distances for many trips as well as less traffic congestion. The travel cost for the majority in Lusaka is very low e.g. below K 10 (GBP 0.4) or K 11-20 (GBP 0.4-0.75). In Kitwe travel cost is higher such as K 80+ (GBP 3+) for some 25.5% and also in the lower range such as below K10 (GBP 0.4 ) for some 19.5%. Table 38: Respondent’s trip characteristics, Lusaka and Kitwe city during lockdown Categories Lusaka City Kitwe Unguja Number of Trips % Number of Trips % Trip Purpose Grocery 54 27 57 27 Personal Need 60 30 39 18.5 Doctor Visits 27 13.5 17 8.5 Work 40 20 76 36 Education 3 1.5 7 3 Social 17 8 15 7 Recreation 0 0 0 0 Others/ Business 0 0 0 0 TOTAL 201 100% 211 100% Trip Distance Below 0.5 km 54 27.5 6 3 0.5 – 1 km 51 26 15 7.5 1.1 - 2 km 29 15 19 9.5 2.1 - 5 km 32 16 67 31 5.1 - 10 km 21 10.5 74 35 10.1 - 20 km 4 2 15 7 20+ km 5 2.5 13 6 Outside of the city 00 00 2 1 Total 196 100% 211 100% Travel Mode Walking 103 51 31 14.5 Wheelchair 13 6.5 8 4 Bicycle 2 1 5 2.5 Bus 52 26 64 30 Car 16 8 85 40 Motorcycle or pathao 2 1 00 00 Taxi 13 6.5 18 9 Total 201 100% 211 100% Reason for using the travel mode Available/ only mode 27 13.5 30 14 Efficient or Easy access 80 40 23 11 Preferred option 27 13.5 113 53.5 Low cost/ affordable or save money 67 33 45 21.5 60 FINAL REPORT: IMPACTS OF COVID-19 ON MOBILITY OF PHYSICALLY CHALLENGED PEOPLE AND OLDER PEOPLE Categories Lusaka City Kitwe Unguja Number of Trips % Number of Trips % Total 201 100% 211 100% Travel time Below 5 minutes 18 9 6 3 6 - 15 minutes 62 31 38 18.5 16 - 30 minutes 72 36 93 44 31 - 45 minutes 18 9 37 17.5 45 minutes – 1 hour 17 9 23 11 1 - 2 hour 7 3 5 2 2+ hours 7 3 9 4 Total 201 100% 211 100% Trip Cost (K) K 0 – 10 128 63.5 41 19.5 K 11 – 20 19 9.5 32 15 K 21 – 30 14 7 32 15 K 31 – 40 5 2.5 29 14 K 41 – 50 5 2.5 8 4 K 51 – 60 6 3 8 4 K 61 – 70 3 1.5 2 1 K 71 – 80 5 2.5 5 2 K 80+ 16 8 54 25.5 Total 201 100% 211 100% 7.4 Mobility and trips before COVID-19 7.4.1 Travel pattern Table 39 shows the average frequency of trips before COVID-19; the majority in both cities travelled many trips i.e. 5+ or 2-3 trips per week; it was even several times per day for many respondents in Lusaka. A large portion of the respondents in both cities also travel very rarely, a few times in a month. Table 39: Respondent’s travel frequency, Lusaka and Kitwe city before COVID-19 Frequency of Trips Lusaka City Kitwe City Respondents % Respondents % Few times/ year 14 7 5 2 Few times/ month 48 24 36 17 1/ month 5 2.5 1 0.5 1/ week 10 5 5 2 2-3/ week 33 16.5 37 17.5 4-5/ week 26 13 10 5 5+/ week 38 19 110 52 Several times/ day 27 13.5 7 3 Total 201 100 211 100 61 FINAL REPORT: IMPACTS OF COVID-19 ON MOBILITY OF PHYSICALLY CHALLENGED PEOPLE AND OLDER PEOPLE Almost 57% and 71% of the respondents respectively in Lusaka and Kitwe mentioned that on a typical day before COVID-19 they usually travelled or went outside of home at least once in a day (see in Appendix Table E4-12). The characteristics of the trips are discussed in the next section. 7.4.2 Trip characteristics Trip characteristics, including purpose, distance, travel time, travel cost, and mode used for travel before COVID-19 are shown in Table 40. In Lusaka, the main purposes of the trips are for work (32.5%), personal needs (34%) and visiting doctors or purchasing medicine (12.5%). In Kitwe, the main purposes are for work (43.5%), grocery purchase or shopping (10.5%), and social or visiting relatives (24%). The average distance of trips before COVID-19 has a smooth variation from below 0.5 km to 20 km though the majority is in the range 1.1-2 km or 2.1-5 km in Lusaka but 2.1-5 km or 5.1-10 km in Kitwe. The most used travel modes are on foot (41.5%), bus (37.5%) and taxi (9%) in Lusaka; bus (37%), car (20%), taxi (23%), and walking (13%) in Kitwe. The proportion of trips on bicycle or motorcycle in both cities is very low. The main reasons for using the travel mode in Lusaka were mentioned as: low cost or affordability; and efficient and easy access. In Kitwe, an important reason is low cost or affordability. Travel time for the majority is 6-15 minutes or 16-30 minutes in Lusaka, and 16-30 or 31-45 minutes in Kitwe, though several respondents mentioned 1-2 hours or 2+ hours. Travel cost for most trips in Lusaka is very low, i.e. below K10 (GBP 0.4) or K21-30 (GBP 0.75-1.15) while in Kitwe it is very high i.e. K80+ (GBP 3+). Table 40: Respondent’s trip characteristics, Lusaka and Kitwe city before COVID-19 Categories Lusaka City Kitwe Unguja Number of Trips % Number of Trips % Trip Purpose Grocery 13 6.5 22 10.5 Personal Need 68 34 25 12 Doctor Visits 25 12.5 12 5.5 Work 65 32.5 92 43.5 Education 7 3 7 3 Social 20 10 50 24 Recreation 3 1.5 3 1.5 TOTAL 201 100% 211 100% Trip Distance Below 0.5 km 24 12 2 1 0.5 – 1 km 35 17.5 12 5.5 1.1 2 km 53 26.5 23 11 2.1 - 5 km 47 23.5 44 21.5 5.1 - 10 km 29 14 91 43 10.1 - 20 km 5 2.5 14 6.5 20+ km 4 2 16 7.5 Outside of the city 4 2 9 4 Total 201 100% 211 100% Travel Mode Walking 83 41.5 27 13 Wheelchair 9 4.5 7 3.5 Bicycle 3 1.5 5 2 Bus 75 37.5 78 37 62 FINAL REPORT: IMPACTS OF COVID-19 ON MOBILITY OF PHYSICALLY CHALLENGED PEOPLE AND OLDER PEOPLE Categories Lusaka City Kitwe Unguja Number of Trips % Number of Trips % Car 10 5 42 20 Motorcycle or Pathao 1 0.5 0 0 Taxi or Uber 19 9 49 23 Other (Train & bus) 1 0.5 3 1.5 Total 201 100% 211 100% Reason for using the travel mode Available/ only mode 23 11 25 12 Efficient & easy access 68 34 26 12 Preferred option 22 11 95 45 Low cost/ fare or save money, affordability 88 44 65 31 Total 201 100% 211 100% Travel time Below 5 minutes 8 4 3 1.5 6 - 15 minutes 48 24 25 12 16 - 30 minutes 74 37 80 38 31 - 45 minutes 36 18 64 30 45 minutes – 1 hour 23 11 18 8.5 1 - 2 hours 4 2 9 4 2+ hours 8 4 12 6 Total 201 100% 211 100% Trip Cost (K) None or Not Applicable 91 45 35 16.5 Below K 10 00 00 00 00 K 11 – 20 38 19 39 18.5 K 21 – 30 21 10.5 38 18 K 31 – 40 12 6 19 9 K 41 – 50 5 2.5 7 3.5 K 51 – 60 5 2.5 9 4.5 K 61 – 70 9 4.5 4 2 K 71 – 80 4 2 2 1 K 80+ 16 8 58 27 Total 201 100% 211 100% 7.5 Changes and difficulties due to COVID-19 7.5.1 Impact of COVID-19 on mobility and trips Only 38% and 63.5% of the respondents in Lusaka and Kitwe respectively mentioned that their typical travel and mobility have changed due to COVID-19 (Appendix Table E4-13). Their reported main changes are: • Less travel and movement to remain safe (fear or afraid of COVID-19 infection); • Avoiding public transport by using a private vehicle, taxi or walking; 63 FINAL REPORT: IMPACTS OF COVID-19 ON MOBILITY OF PHYSICALLY CHALLENGED PEOPLE AND OLDER PEOPLE • Maintain physical distancing and wear face mask while travel and use hand sanitiser; • Increased travel cost (bus fare and fuel price); • Less buses are available. More than half of the respondents (58% in Lusaka and 66% in Kitwe) mentioned that their trip cost has been changed and mostly increased, due to COVID-19 (Table E4-14). Occupation have not changed after COVID-19 for many respondents, only 16% in Lusaka and 6% in Kitwe indicated change (Table E4-15). It is not surprising to find change for a very small portion because many of the respondents were not working before COVID-19, as the sample of this research is elderly and disabled persons. The major changes reported are: shifted or changed job pattern or business type, reduced working days, loss of job (unemployed). Nevertheless, almost half of the respondents (69% in Lusaka and 41.5% in Kitwe) mentioned that their household income has decreased after COVID-19 (Table E4-16). Figure 26 shows the effect of the COVID-19 on the modal distribution of trips in Lusaka and Kitwe. In Kitwe, the usage of public transport and paratransit modes have reduced while active modes and private modes have increased during lockdown and post-lockdown compared with before COVID-19. Whereas in Lusaka, the proportion of trips in active modes and private modes has increased but decreased in public transport both during COVID-19 lockdown and post-lockdown compared with the before COVID-19. The respective increase or decrease during the lockdown was relatively high compared with the post-lockdown period. The proportion of trips on paratransit and private modes in Lusaka during lockdown is almost the same as it was before COVID-19. However, during post-lockdown the proportion of trips on paratransit decreased but increased on private modes. This situation indicates that the availability of public transport might have decreased particularly during the lockdown and/ or the elderly or disabled people might have avoided the use of public transport to reduce the risk of getting infected from COVID-19 virus. Also, the increased use of active transport and private modes is due either to the unavailability of public transport or because no proper physical distancing is maintained in public transport. Figure 26: Modal distribution of trips, Lusaka and Kitwe during and before COVID-19 Figure 27 shows the typical travel frequency of the respondents. In Kitwe, the travel frequency of most of the respondents before the pandemic was 5+ trips per week, which is slightly affected during post-lockdown and significantly affected during the lockdown. Similarly, the travel frequency of most of the respondents in Lusaka before the pandemic was 5+ trips per week or several times per month, which is significantly affected during the lockdown and post-lockdown. For both cities, the highest proportion of the respondents are observed to have 2-3 trips per week during lockdown. 0 10 20 30 40 50 60 70 Public transport Private mode Paratransit Active modes Public transport Private mode Paratransit Active modes Lusaka Kitwe % of Respondents Before COVID-19 Lockdown COVID-19 (post-lockdown) 64 FINAL REPORT: IMPACTS OF COVID-19 ON MOBILITY OF PHYSICALLY CHALLENGED PEOPLE AND OLDER PEOPLE Figure 27: Respondent’s travel frequency, Lusaka and Kitwe during and before COVID-19 Figure 28: Effects of COVID-19 on travel purpose, Lusaka and Kitwe city Figure 28 illustrates that the trips made during lockdown mostly consist of the purposes of work, grocery, personal need, and doctor visits. This shows that only trips with a necessary purpose were made during the lockdown. It can be interpreted that the situation during COVID-19 post-lockdown and before COVID-19 remained the same for work trips in Lusaka, while in Kitwe during post-lockdown work trips have increased and social trips decreased as compared to before COVID-19 and during the lockdown. 7.5.2 Difficulties and expectations In general, finding public transport and using it for a trip in Lusaka and Kitwe is not easy. Figure 29 shows a significant portion of the respondents in both cities mentioned manageable while a small portion mentioned difficult or very difficult about finding and using public transport. Similarly, in terms of finding or navigating a location of the city, almost half of the respondents mentioned ‘manageable’. 0 10 20 30 40 50 60 None Few times/year Few times/month 1/month 1/week 2-3/week 4-5/week 5+/week Several times/day None Few times/year Few times/month 1/month 1/week 2-3/week 4-5/week 5+/week Several times/day Lusaka Kitwe % of Respondents COVID-19 (post-lockdown) Lockdown Before COVID 0 5 10 15 20 25 30 35 40 45 50 Grocery Personal Need Doctor visits Work Social Recreation Others Grocery Personal Need Doctor visits Work Social Recreation Others Lusaka Kitwe % of Respondents COVID-19 (post-lockdown) Lockdown Before COVID 65 FINAL REPORT: IMPACTS OF COVID-19 ON MOBILITY OF PHYSICALLY CHALLENGED PEOPLE AND OLDER PEOPLE Figure 29: Level of ease to find and navigate public transport during lockdown The respondents were asked if they have faced any difficulties related to travel and mobility during and before COVID-19. Figure 30 shows almost half of the respondents in both cities, but significantly higher in Kitwe during lockdown, had a travel problem. Before COVID-19, 36% and 42% respectively in Lusaka and Kitwe faced a travel problem which is 45% and 43% respectively during COVID-19 post-lockdown. During lockdown, 39% and 59% in Lusaka and Kitwe respectively faced a travel problem. Nevertheless, the respondents were asked if they have any new or additional travel problem due to COVID-19. Almost 46% and 83% in Lusaka and Kitwe respectively feel additional travel problems due to COVID-19. Of the remainder, who do not feel any additional travel problem due to COVID-19, 27% and 43% of them respectively in Lusaka and Kitwe mentioned that the magnitude of the travel problem compared to before COVID-19 is now higher due to COVID-19. The reported travel difficulties before COVID-19 in both cities are similar; these are: • Cannot walk (due to backpain or too old) or difficult to travel, always need someone to help; • Public transport is not friendly/ accessible for disabled and elderly people, most buses are not accessible for disabled and trouble in fitting the wheelchair in bus or no room for wheelchair; • Buses remain overcrowded and no access, difficult to board/ alight; • Public transport is not convenient, bus stop is far from home; • Poor road condition, crossing and bus station – no walkways are provided and no provision for wheelchair users - most of the public and private buildings have no elevators. Figure 30: Respondents facing travel issues, Lusaka and Kitwe The difficulties during COVID-19 (post-lockdown) and during lockdown are the same. However, a few additional difficulties occur due to restrictions or regulations imposed. The added difficulties are: • Reduced travel due to fear of COVID-19 or imposed restrictions on travel and movement; • Increased travel cost (bus fare, gasoline price, switching from bus to taxi), as shown in Appendix Figure E4- 1; • Need to use face mask and wearing it for long time is uncomfortable for breathing; • Need to use hand sanitiser regularly; 0 10 20 30 40 50 60 Eery Easy Easy Manageable Hard Very Hard Eery Easy Easy Manageable Hard Very Hard Lusaka Kitwe % of Respondents Level of ease/ difficultly Find & use Public Transport Find (nevigate) or identify a location 45 43 39 59 36 42 0 10 20 30 40 50 60 70 Lusaka Kitwe Before COVID Lockdown COVID-19 (post-lockdown) 66 FINAL REPORT: IMPACTS OF COVID-19 ON MOBILITY OF PHYSICALLY CHALLENGED PEOPLE AND OLDER PEOPLE • Limited public transport (e.g. buses) are available so longer waiting time or walk; • Reduced seating capacity in bus for maintaining physical distancing; • Lack of compliance to maintain physical distancing (not properly maintained in buses/ public places) and wearing face mask; • Walking is tiring and no one to help for pushing the wheelchair. Nevertheless, the respondents were asked if they have any expectation or suggestion for improving travel and mobility. Almost 36% of the respondents from each city provided their suggestions for during COVID-19 period which are similar for both cities. These are: • Impose restriction on travel and movement of people to avoid unnecessary trips; • Strictly following the health guidelines (e.g. maintain physical distancing, wearing face mask) and monitoring to adhere COVID-19 guidelines; • Provision of hand sanitisers in vehicles, disinfecting and hand wash facilities in vehicles and stations; • Less passengers in public transport to ensure physical distancing; • Use personal or own vehicle and walking or cycling. Beside these, the respondents mentioned some measures that could improve the overall mobility and access of elderly and disabled people even if there is no COVID-19; these are: • Improved public transport accessible for elderly and disabled people, spacious design to accommodate room for wheelchairs and easy movement in bus. Infrastructure including buildings and roads should have provisions for elderly and wheelchair users; • Reduced fare rates in public transport for elderly and disabled people; • Proper bus station design and should be in the centre of residential area; • More walkways and need to accommodate all types of pedestrians; • Provide better transport service, reduce congestion, more buses and prevent overcrowding in buses; • Subsidise wheelchairs and walking canes for elderly and disabled to help them navigate the city. 67 FINAL REPORT: IMPACTS OF COVID-19 ON MOBILITY OF PHYSICALLY CHALLENGED PEOPLE AND OLDER PEOPLE 8. Summary of the findings and comparison This chapter provides a summary of the findings from the eight cities of the four different countries that have been discussed in the previous four chapters. A comparison is made between the cities. This chapter is structured according to the following sections: • Mobility and trips of the respondents before COVID-19, particularly the frequency and purpose of trips; • Mobility and trips during COVID-19 (both lockdown and post-lockdown); • Major changes in mobility and trips of the respondents due to COVID-19; and • The travel difficulties of the respondents in different cities. 8.1 Mobility and trips before COVID-19 As can be seen in Table 41, before COVID-19, the frequency of trips for most of the respondents in all the cities was 2-3 trips or 4-5 trips or even 5+ trips per week. A small number made several trips per day, only once in a week or once or a few times per month. A further small number, particularly in Dhaka, Karachi, Zanzibar and Lusaka travel just a few times per year: this is mainly because of their physical disability and thus difficulties for travel. Table 41: Respondent’s frequency of trips before COVID-19 (%) Frequency Dhaka Khulna Karachi Lahore Dar-esSalaam Zanzibar Lusaka Kitwe Few times/ year 16 1.5 9 2 0 5 7 2 Few times/ month 10.5 1.5 6 8 0.5 2.5 24 17 1/ month 4 3 4 2 0.5 0.5 2.5 0.5 1/ week 7 5.5 7 7 3 19 5 2 2-3/ week 18 30 11 17 40.5 39.5 16.5 17.5 4-5/ week 13.5 42.5 16 39 47.5 31 13 5 5+/ week 27.5 12.5 21 25 8 2.5 19 52 Several times/ day 3.5 3.5 25 1 0 0 13.5 3 As can be seen in Table 42, the main purposes for the trips in almost all the cities are for work, grocery/ shopping, or personal needs. A significant portion of the trips are also for grocery, doctor visits or social purposes such as visiting relatives or friends. Very few trips are made for recreation. Table 42: Respondent’s purpose of trips before COVID-19 (%) Purpose Dhaka Khulna Karachi Lahore Dar-esSalaam Zanzibar Lusaka Kitwe Grocery 24 13.5 19 10 7 17 6.5 10.5 Personal Need 9.5 12 14 1 14 18 34 12 Doctor visits 13 10 7 13 7 8 12.5 5.5 Work 24 50 29 73 49 44 32.5 43.5 Social 17.5 10.5 23 2 8 16 10 24 Recreation 9 0 8 3 0 0 1.5 1.5 Others 3 4 0 0 15 0 3 3 The trip distance before COVID-19 has a smooth variation from below 1 km to 20 km though the majority are within 5 km. For short distances, many respondents walk to save money and/ or have a healthy leisure activity. Active modes, such as walking and cycling, contribute about 20% of the trips in each city except Khulna. A significant portion of the trips in Khulna are on paratransit, namely easybikes. The proportion of 68 FINAL REPORT: IMPACTS OF COVID-19 ON MOBILITY OF PHYSICALLY CHALLENGED PEOPLE AND OLDER PEOPLE trips on paratransit is significant in every city except Dar-es-Salaam and Zanzibar where public transport modes such as bus or daladala serve the majority. Trips on private vehicles in Karachi and Lahore are higher due to having a higher car ownership rate. 8.2 Mobility and trips during COVID-19 During the COVID-19 lockdown, as can be seen in Table 43, most of the respondents in all the cities avoided travel and did not make any trips, except Lusaka and Kitwe. In Lusaka and Kitwe only a very few (6%) avoided travelling because there was no traffic ban or a strong enforcement of lockdown. Nevertheless, during the lockdown the frequency of travel was much less than before COVID-19 lockdown. For those who travelled during lockdown, in most of the cities the frequency was mostly once or 2-3 times per week, though 4-5 trips per week were made by many in Dar-es-Salaam, Zanzibar, Lusaka and Kitwe. Table 43: Respondent’s frequency of trips during COVID-19 lockdown (%) Frequency of Travel Dhaka Khulna Karachi Lahore Dar-esSalaam Zanzibar Lusaka Kitwe None 80.5 53 70 53 37 59 6 6 Few times/ year 0 0 0 0 0 0 0 0 Few times/ month 2 2.5 2 0.5 0 0 0 0 1/ month 5.5 2.5 3.5 0.5 1 1 0 0 1/ week 5 12.5 3 25.5 8 6.5 32.5 2 2-3/ week 3 27 7 6.5 33 18.5 40 48 4-5/ week 0.5 0 9 7.5 20 15 15 23 5+/ week 0.5 1 5 5 1 0 6.5 22 Several times/ day 2.5 1.5 0.5 1 0 0 0 0 Table 44: Respondents’ purpose of trips during COVID-19 lockdown (%s) Trip Purpose Dhaka Khulna Karachi Lahore Dar-es-Salaam Zanzibar Lusaka Kitwe Grocery 50 8 25 12 14 25 27 27 Personal Need 7.5 0 21 1 5 5 30 18.5 Doctor visits 7.5 7 10 42 9 9 13.5 8.5 Work 15 46 35 40 52 59 20 36 Social 9 2 6 0 1 2 8 7 Recreation 5.5 1 3 6 0 0 0 0 Others 5.5 36 0 0 19 0 1.5 3 Table 44 shows the main purposes for travel during lockdown are purchasing grocery (or shopping more generally), work, and doctor visits, while the number of leisure trips (i.e. social gatherings and recreational trips) is very low. Social and recreation trips were avoided to remain safe from being infected. A significant proportion of trips in several cities are for other purposes, such as praying (worship or visiting a mosque) in Khulna or begging in Dar-es-Salaam. The distance of trips during lockdown is short - most of the respondents were avoiding travelling longer distances. More than 50% of the trips in Dhaka, Khulna and Karachi are within 1 km. In other cities, most trips are between 2 and 5 km. A major proportion are walking trips; 61%, 43% and 51% in Dhaka, Khulna and Lusaka respectively (refer to Table 8 and 38). A large portion of trips on motorcycle were observed in Karachi (19%), Lahore (21%) and Zanzibar (20%). A large portion of trips are on easybike (28.5%) and rickshaw (28%) respectively in Khulna and Lahore. However, the travel mode for a high percentage of trips was bus/ daladala in Dar-es-Salaam (58%), Zanzibar (67%), Lusaka (26%) and Kitwe (30%). During lockdown buses were operating in Tanzanian and Zambian cities and the larger proportion of trips on public transport, as compared to private vehicles, is due to cost savings or lower trip cost. The main reasons for using a particular travel mode during lockdown are: short distance, low cost, easy access and availablity. 69 FINAL REPORT: IMPACTS OF COVID-19 ON MOBILITY OF PHYSICALLY CHALLENGED PEOPLE AND OLDER PEOPLE Table 45: Respondent’s frequency of trips post-COVID-19 lockdown Frequency of Trip Dhaka Khulna Karachi Lahore Dar-esSalaam Zanzibar Lusaka Kitwe None 1 1 0 0 0 0 0 0 Few times/ year 20 3 12 1 0.5 8.5 8.5 4 Few times/ month 10.5 4 10 2.5 0.5 0 4.5 13 1/ month 10 5 4 1 0.5 2 5 0.5 1/ week 11.5 12 11 24 1 19 16.5 1.5 2-3/ week 19.5 26 11 21.5 32.5 40 28 18.5 4-5/ week 11.5 41.5 16 50 59 27.5 22 13 5+/ week 14 6 20 0 6 3 12 47.5 Several times/ day 2 1.5 17 0 0 0 3.5 2 On the other hand, as can be seen in Table 45, during COVID-19 post-lockdown, the frequency of travel is once or 2-3 trips or 4-5 trips per week for the majority in all the cities. In Karachi, Lusaka and Kitwe a large proportion of the respondents were found to have very high travel frequency. Almost half of the respondents in Khulna (41.5%), Lahore (46%) and Dar-es-Salaam (59%) make 4-5 trips per week while in Zanzibar (40%) it is 2-3 trips per week. Many respondents travel 5+ trips per week in Karachi (20%), Lusaka (12%) and Kitwe (47.5%); however, the proportions of respondents are less compared to the situation before COVID-19 which were 21%, 19% and 52% respectively. There are several respondents who travel just a few times in a year or month or one trip per week; the proportion is more during post-lockdown compared to before COVID-19. This clearly reveals that the respondents travel less during COVID-19 (post-lockdown) than before COVID-19. Nevertheless, most of the respondents in all the cities mentioned that physical distancing was followed during their travel. Table 46: Respondent’s purpose of trips post-COVID-19 lockdown Trip Purpose Dhaka Khulna Karachi Lahore Dar-esSalaam Zanzibar Lusaka Kitwe Grocery 23.5 15 19 8 6 16.5 10.5 10.5 Personal Need 10.5 11 16 0 16 21.5 24 10 Doctor visits 18 10.5 8 24 10 8 17 7.5 Work 21 49 37 61 45 38.5 17 31 Social 14 10 16 4 7 15 12 15 Recreation 7 0 6 3 1 1 0.5 1.5 Others 6 4.5 0 0 15 0 19 24.5 As can be seen in Table 46, the main purposes for trips are work, grocery or shopping, doctor visits – similar to the purposes during lockdown time. A small proportion of social trips (around 10%) were observed in all the cities; though the proportion is higher than in lockdown time it is lower than before the COVID-19 situation. However, recreation trips are less, as in lockdown time, compared with before COVID-19. Trips are mostly for short distance (within 5 km) though a small proportion are for long distance such as 10 to 20 km. Walking and buses are the major travel modes. Car is the travel mode for a significant proportion of trips in Dhaka (14%), Karachi (28%), Lahore (16%) and Kitwe (37.5%) in post-lockdown time, while before COVID-19 it was 13%, 32%, 15% and 0% respectively. Motorcycle is also significant in Khulna (9%), Karachi (21%), Lahore (24%), and Zanzibar (11%), which before COVID-19 had trip proportions of 12.3%, 19%, 29% and 13% respectively. Rickshaw in Dhaka and Lahore are also significant, as is easybike in Khulna. The proportion of rickshaw trips in Lahore is higher during post-lockdown (32%) than in lockdown (28%) or before the COVID-19 70 FINAL REPORT: IMPACTS OF COVID-19 ON MOBILITY OF PHYSICALLY CHALLENGED PEOPLE AND OLDER PEOPLE situation (26%). The main reasons for using a particular travel mode are: availability, easy access, short distance, low cost, comfort. Comfort of the mode was not very important for the respondents during lockdown time. 8.3 Changes in mobility and trips due to COVID-19 Travel and mobility of elderly and physically challenged people have changed due to COVID-19, as can be seen in Figure 31. The change was reported by 30%, 35%, 38% and 63% of the respondents in Khulna, Karachi, Lusaka and Kitwe, respectively. In Dhaka and Lahore, the change was reported by a lower number of respondents, 18% and 12% respectively. In Dar-es-Salaam only 2% of respondents reported change whilst the figure for Zanzibar was 0%. Many respondents in all the cities except Dar-es-Salaam and Zanzibar also mentioned that they are facing additional travel problems due to COVID-19. Figure 31: Proportion of respondents changing travel or facing additional issues due to COVID-19 An increase in travel cost due to COVID-19 was reported by a proportion of the respondents in all the cities except in Dar-es-Salaam and Zanzibar. In Dhaka and Karachi around 15% experienced such an increase, whilst in Khulna, Lusaka and Kitwe the figure was around 60% and in Lahore around 40% (Figure 32). A large proportion of the respondents in all the cities mentioned that their household income has decreased due to COVID-19. Occupation has not changed for many respondents after COVID-19 because most of the respondents were not working before COVID-19, due to being elderly and/ or disabled people. Figure 32: Proportion of respondents increased travel cost & decreased household income due to COVID 0 10 20 30 40 50 60 70 % of Respondents Changes in travel & mobility Aditional travel problems 0 20 40 60 80 100 120 % of Respondents Increased travel cost Decreased household income 71 FINAL REPORT: IMPACTS OF COVID-19 ON MOBILITY OF PHYSICALLY CHALLENGED PEOPLE AND OLDER PEOPLE 8.3.1 Trip frequency A reduction of trips was found in all the cities due to COVID-19. The major reduction was particularly during the lockdown when most of the respondents avoided travel and did not make any trips. They avoided travel either to remain safe from virus infection or due to the unavailability of public transport or due to the closure of business/ commerce institutions. However, only a very few in Lusaka and Kitwe avoided travel because there was no such strong lockdown with related traffic bans and enforcement. Nevertheless, for those who travelled during the lockdown, their frequency of travel was much less compared with before the COVID-19 situation. For instance, the travel frequency of many respondents in all the cities except Lusaka and Kitwe before the pandemic was 4-5 trips or 5+ trips per week, which decreased to once or 2-3 trips per week during the lockdown (as seen in Tables 41 and 43). The reduction of trips in Lusaka and Kitwe is not much as there was no such strong complete lockdown. Moreover, several respondents in Karachi, Lusaka and Kitwe made 4- 5 trips or even 5+ trips per week during lockdown. In Karachi this was mainly due to respondents having a personal vehicle (and thus not being affected much by the lockdown). In Lusaka and Kitwe this was mainly due to respondents using buses and taxis, which were not banned. During post-lockdown, the travel frequency of the respondents has increased compared to lockdown time. However, a reduction of trips was found in post-lockdown compared with before COVID-19 (as seen in Tables 41 and 45). For example, during post-lockdown the frequency of travel is 2-3 trips or 4-5 trips per week for a large portion of the respondents in all the cities. Several respondents travel more than 5 trips per week, though the proportion is less than the before COVID-19. In contrast, the proportion of the respondents who travel just for few times in a year or month or once per week is higher in post-lockdown than before COVID19. 8.3.2 Accompanied As can be seen in Figure 33, several respondents in all the cities are accompanied or escorted by another person during their travel. The proportion of the respondents who are accompanied for their travel during COVID-19 post-lockdown is higher than the before COVID-19 situation. Figure 33: Proportion of respondents accompanied by another person during their travel 8.3.3 Mode of trip As can be seen in Figure 34, the percentages of trips made by any mode before COVID-19 and after lockdown are generally similar in all the cities except for paratransit and private vehicles in Lusaka and Kitwe. A significant reduction in paratransit, but increase in private vehicles, is observed after lockdown in Lusaka and Kitwe in comparison to before COVID-19. Nevertheless, during post-lockdown, a slight decrease in usage of public transport and increase in private vehicles is observed in all the cities. During lockdown, the usage of public transport has reduced while active modes and private modes have increased compared with before COVID-19. The usage of paratransit modes during lockdown has increased in all the cities except in Dhaka, Khulna, Dar-es-Salaam and Zanzibar. The proportion of paratransit trips in Dhaka and Khulna has reduced because of traffic bans and strict enforcement, so that many operators were unable to drive during lockdown. On the other hand, in Dar-es-Salaam and Zanzibar the proportion of paratransit trips remained the same 0 10 20 30 40 50 60 COVID-19 post-lockdown Before COVID-19 72 FINAL REPORT: IMPACTS OF COVID-19 ON MOBILITY OF PHYSICALLY CHALLENGED PEOPLE AND OLDER PEOPLE during and before COVID-19. Paratransit modes in many cities provided individual taxi-type services with higher fare both during lockdown and post-lockdown time. Figure 34: Means of travel mode during and before COVID-19 in different cities The effect due to COVID-19 over mobility was mainly affecting the people who do not own their private vehicle. Most of the respondents in all the cities mentioned that during lockdown they maintained proper physical distancing for their trips (Figure 35). However, the proportion of the respondents maintaining physical distancing in the post-lockdown period is slightly less compared to the lockdown period in most of the cities, while Dar-es-Salaam and Zanzibar it is very much less. Figure 35: Proportion of the respondents in different cities maintaining physical distancing during travel 8.4 Travel difficulties of elderly and physically challenged people in LICs Elderly and physically challenged people in LICs are facing a range of travel difficulties. Their travel difficulties are similar in all the case study cities. The usual travel problems before COVID-19 mentioned by the respondents can be summarised into two major groups: (a) overall transport problems of the city faced by everybody, and (b) the travel difficulties faced by elderly and physically challenged people for being disabled. These difficulties are: • Public transport is not accessible for physically challenged people, and no room for wheelchair users; • No pedestrian paths, and existing paths or infrastructure are not accessible for disabled people; • Less public transport facility, less variety of modes, poor public transport services; 0 10 20 30 40 50 60 70 80 Public Private Paratransit Active Public Private Paratransit Active Public Private Paratransit Active Public Private Paratransit Active Public Private Paratransit Active Public Private Paratransit Active Public Private Paratransit Active Public Private Paratransit Active Dhaka Khulna Karachi Lahore Dar-es-Salaam Zanzibar Lusaka Kitwe % of Respondents COVID-19 (post-lockdown) Lockdown Before COVID 0 10 20 30 40 50 60 70 80 90 100 % of Respondents Post-lockdown Lockdown 73 FINAL REPORT: IMPACTS OF COVID-19 ON MOBILITY OF PHYSICALLY CHALLENGED PEOPLE AND OLDER PEOPLE • Traffic congestion and more travel time, air pollution, garbage on street; • Difficulties of getting into bus, drivers not stopping buses properly. In general, finding and riding on public transport or finding a location in LIC cities is not easy. Though the major proportion of the respondents in most cities found public transport ‘manageable’, a significant portion mentioned it is difficult or very difficult (Figure 36). Only in Khulna the majority mentioned that finding a public transport mode is easy because they can find an easybike anywhere of the city whenever they need a ride. Figure 36: Level of difficulty to find public transport in different cities Due to COVID-19 more travel difficulties are added for elderly and disabled people. The difficulties during lockdown and post-lockdown are similar, though a few additional problems occur due to restrictions or regulations imposed during lockdown. The added difficulties during lockdown are: • Limited availability of public transport vehicles, so longer waiting time; • Reduced travel due to imposed restrictions on travel and movement; • More walk due to unavailability or limited public transport. The additional travel difficulties due to COVID-19 during post-lockdown are: • Reduced travel or fear of being infected by COVID-19 during movements out of home; • Increased travel cost; • Reduced seating capacity in bus for maintaining physical distancing; • Wearing face mask is uncomfortable for breathing; • Lack of compliance for maintaining physical distancing and wearing face mask or using sanitisation. 8.5 Reflections Changes have been observed in mobility of the respondents in all cities due to COVID-19. The major changes particularly during the lockdown period, compared with before COVID-19, are avoiding travel or less frequency of trips. The proportion of social trips and recreation trips are less both in lockdown and postlockdown compared to before COVID-19. However, the changes in travel and mobility of the respondents due to COVID-19 in different cities are associated with the nature of the lockdown or the response measures of the respective city. For instance, the changes in Bangladeshi and Pakistani cities are more than in Tanzanian and Zambian cities as there were effective lockdowns (travel bans) in the former. Frequency of trips reduced during COVID-19 and reduced significantly during lockdown. 0 10 20 30 40 50 60 70 80 90 Very hard Hard Manageable Easy Very Easy Very hard Hard Manageable Easy Very Easy Very hard Hard Manageable Easy Very Easy Very hard Hard Manageable Easy Very Easy Very hard Hard Manageable Easy Very Easy Very hard Hard Manageable Easy Very Easy Very hard Hard Manageable Easy Very Easy Very hard Hard Manageable Easy Very Easy Dhaka Khulna Karachi Lahore Dar-es-Salaam Zanzibar Lusaka Kitwe Find & use Public Transport Find (nevigate) or identify a location 74 FINAL REPORT: IMPACTS OF COVID-19 ON MOBILITY OF PHYSICALLY CHALLENGED PEOPLE AND OLDER PEOPLE Trip distance is short for the majority during COVID-19. Active modes such as walking and cycling as well as paratransit modes increased, while public transport usage reduced. Reduced availability of transport and increased travel cost (at the same time as reduced household income) occurred for many. 75 FINAL REPORT: IMPACTS OF COVID-19 ON MOBILITY OF PHYSICALLY CHALLENGED PEOPLE AND OLDER PEOPLE 9. Conclusion and research uptake 9.1 Research uptake/ dissemination activities To maximise benefits, as the research uptake strategy, the following activities will be organised: • A Webinar to share initial findings with the stakeholders, academia and professionals; • Disseminating the results in social media; • A policy brief or summary factsheet. A workshop will be organised in each city for strategic engagement of around 20 key local stakeholders (e.g. city authority personnel, policymakers, academics, transport providers) for disseminating the preliminary findings and validating the results. Considering the present health and safety issues due to COVID-19, the workshop will be organised virtually - using an online platform. A single workshop/ Webinar will be organised for all the cities where participants from different cities will join virtually. A Webcast/ Podcast highlighting the major findings will be uploaded to social media (e.g. Facebook, LinkedIn) to reach the wider society. Similarly, a short video clip (around one or two minutes) about the summary of the research will be prepared and uploaded to social media. A policy brief or summary factsheet will be prepared by June 2021 for disseminating the key results to the policy-makers of eight case study cities to make them aware about mobility needs and constraints of elderly and disabled people, as well as to guide them on responses and/ or recovery plans in a changed transport world due to COVID-19. 9.2 Low-income countries planned for upscale This research has potential for scaling up from the case study cities in the four LIC delivery countries, namely Bangladesh, Pakistan, Tanzania and Zambia. The results will be helpful and transferrable to other cities of the four delivery countries as well as to neighbouring LICs, e.g. Afghanistan, Kenya, Malawi, Myanmar and Zimbabwe. Moreover, the methodology of this research could be applied in other countries across the globe. Thus, scaling up of the project will be possible regionally as well as globally. The researcher in Bangladesh will collaborate with a particular municipality - KCC in Khulna - which was one of the case study cities in Bangladesh. The Chief Town Planner of KCC has already agreed to support the research and will take into consideration the results and suggested guidelines of this research while implementing relevant projects. Besides KCC, the research findings and suggested guidelines will be shared and pursued to the National Grassroot Disability Organisations (NGDO) - an NGO working for rights and betterment of physically challenged people in Bangladesh - and Dhaka Transport Coordination Authority (DTCA) in Bangladesh. Similarly, research uptake activities in other cities, namely Karachi, Dar-es-Salaam, and Lusaka, will be carried out by the researchers in their respective cities. For example, the researcher from Karachi will be able to collaborate with Karachi Regional Transport Authority to facilitate the provision of transport infrastructure and services that are friendly for elderly and physically challenged people. The researcher from Tanzania will hand over a copy of this report to the Mayor of Dar-es-Salaam City Council and will advocate addressing the travel issues and problems faced by elderly and physically challenged people. The researcher from Zambia will discuss with a representative of Lusaka City Authority about initiatives to incorporate the issues of elderly and physically challenged people in projects related to urban development and transport planning. 9.3 Planned next steps The planned next steps before October 2021 are: • Presenting the major findings in a conference (online); and • Submission for a peer-reviewed journal publication. 76 FINAL REPORT: IMPACTS OF COVID-19 ON MOBILITY OF PHYSICALLY CHALLENGED PEOPLE AND OLDER PEOPLE Possible conferences could be TRANSED (International Conference on Mobility & Transport for Elderly and Disabled Persons) or EASTS (Eastern Asia Society for Transport Studies), while the possible journals could be TRB Transport Research Record (TRR), Transportation Research Part A or Case Studies on Transport Policy. 9.4 Conclusion The travel behaviour of elderly and physically challenged people are different to those of physically enabled and young people. Some problems related to their mobility are different than those faced by physically enabled and young people, whilst other problems are similar. The COVID-19 pandemic has had a profound impact on the mobility of all groups. The main purpose of the research reported above was to understand the mobility of physically challenged and elderly people in LICs during the COVID-19 pandemic, especially concerning their main travel problems due to COVID-19 with case studies in eight LIC cities. The outcome of this research will have a beneficial impact on transport in the target LICs and cities. For instance, the results will be helpful for policy formulation to improve mobility and thus provide better access to transport and services for elderly and physically challenged people, both during COVID-19 and post-COVID19 periods. The suggestions of this research will be helpful in addressing social inclusion and equity issues in transport planning and policy formulation. Thus, the lives of elderly and persons with disability will be improved. The results will be helpful for city authorities and governments for making policy decisions, formulating strategies and making investment plans. The research provides an avenue for further research on various topics. One such topic could involve developing a tool for rapid assessment of urban transport infrastructure and public transport services in LIC cities to ascertain whether they are friendly for elderly and disabled people. Another topic could involve undertaking a demonstration project to showcase good practices for elderly or disabled friendly transport. 77 FINAL REPORT: IMPACTS OF COVID-19 ON MOBILITY OF PHYSICALLY CHALLENGED PEOPLE AND OLDER PEOPLE 10. References 1. United Nations (2007). World Population Ageing, https://www.un.org/en/development/desa/population/publications/pdf/ageing/WorldPopulationAgeing Report2007.pdf (date accessed 15/1/2021). 2. McPherson, K. (2020). Making Transport in Low-Income Countries Resilient to Pandemics: a Planning Guide. Project Report HVT/L1L166 of COVID-19 Research and Response Transport Recovery Fund, TRL, UK. 3. Giuliano, G., H.H. Hu and K. Lee (2003). “Travel patterns of the elderly: the role of land use.†METRANS transportation center. Available from http://www.reconnectingamerica.org/assets/Uploads/bestpractice104.pdf (date accessed 2/1/2021). 4. Mohan, D. (2005). “Traffic Injuries and Fatalities in India.†The Road Ahead. Quarterly Magazine of the World Health Organization (WHO), TRIPP/WHO Collaboration Centre: 3–8. 5. Kim, S. and G. Ulfarsson (2004). “Travel mode choice of the elderly: Effects of personal, household, neighborhood, and trip characteristics.†Transportation Research Record: Journal of the Transportation Research Board 1894. 6. Jamal, S. and A. Paez (2020). “Changes in Trip-Making Frequency by Mode during COVID-19.†Findings, Available from https://doi.org/10.32866/001c.17977 (date accessed 10/1/2021). 7. Bhaduri, E., B.S. Manoj, Z. Wadud, A.K. Goswami and C.F. Choudhury (2020). “Modelling the effects of COVID-19 on travel mode choice behaviour in India.†Transportation Research Interdisciplinary Perspectives 8(100273): 1-16. 8. Richardson, S. J., C. B. Carroll, J. Close, A.L. Gordon, J. O’Brien, T.J. Quinn, L. Rochester, A.A. Sayer, S.D. Shenkin, N. van der Velde, J. Woo, M.D. Witham (2020). “Research with older people in a world with COVID-19: identification of current and future priorities, challenges and opportunities.†Age and Ageing 49: 901–906. Available from doi: 10.1093/ageing/afaa149 9. Anislie, D. and J. Foubert (2020). “Coronavirus and the social impacts on disabled people in Great Britain: May 2020.†Article of Office for National Statistics, UK. Released Date: 11 June 2020. 10. De Vos, J. (2020). “The effect of COVID-19 and subsequent social distancing on travel behavior.†Transportation Research Interdisciplinary Perspectives 5 (100121). Available from https://doi.org/10.1016/j.trip.2020.100121 (date accessed 19/1/2021). 11. de Haas, M., R. Faber, M. Hamersma (2020). “How COVID-19 and the Dutch ‘intelligent lockdown’ change activities, work and travel behaviour: Evidence from longitudinal data in the Netherlands.†Transportation Research Interdisciplinary Perspectives 6(100150). Available from https://doi.org/10.1016/j.trip.2020.100150 (date accessed 19/1/2021). 12. DfT (2020). Transport use during the coronavirus (COVID-19) pandemic. Available from https://www.gov.uk/government/statistics/transport-use-during-the-coronavirus-covid-19- pandemic (date accessed 4/1/2021). 13. Molloy, J., C. Tchervenkov, Hintermann, K.W. Axhausen (2020). “Tracing the Sars-CoV-2 impact the first month in Switzerland-March to April 2020.†Arbeitsberichte Verkehrs- Und Raumplanung (1503). Available from https://doi.org/10.3929/ethz-b-000414874 (date accessed 1/2/2021). 14. Beck, M.J., D.A. Hensher (2020). “Insights into the impact of COVID-19 on household travel and activities in Australia - The early days under restrictions.†Transport Policy 96: 76–93. https://doi.org/10.1016/j.tranpol.2020.07.001 15. Bucsky, P. (2020). “Modal share changes due to COVID-19: The case of Budapest.†Transportation Research Interdisciplinary Perspectives 100141. https://doi.org/10.1016/j.trip.2020.100141 16. Hadjidemetriou, G.M., M. Sasidharan, G. Kouyialis, A.K. Parlikad (2020). “The impact of government measures and human mobility trend on COVID-19 related deaths in the UK.†Transportation Research Interdisciplinary Perspectives 6(100167). Available from https://doi.org/10.1016/j.trip.2020.100167 17. Mohammadian, A. (Kouros), A. Shamshiripour, E. Rahimi, R. Shabanpour (2020). TRB Webinar: How Much Will COVID 19 Affect Travel Behavior. 18. Cheng, L., X. Chen, S. Yang, Z. Cao, J. De Vos, and F. Witlox (2019). “Active travel for active ageing in China: The role of built environment.†Journal of Transport Geography. 19. Hu, X., J. Wang, and L. Wang (2013). “Understanding the travel behavior of elderly people in the developing country: A case study of Changchun, China.†Procedia- Social and Behavioral Sciences 96: 873- 880. 78 FINAL REPORT: IMPACTS OF COVID-19 ON MOBILITY OF PHYSICALLY CHALLENGED PEOPLE AND OLDER PEOPLE 20. Ipingbemi, O. (2010). “Travel characteristics and mobility constraints of the elderly in Ibadan, Nigeria.†Journal of Transport Geography. doi:10.1016/j.jtrangeo.2009.05.011. 21. Liu, W., H. Lu, Z. Sun, and J. Liu (2017). “Elderly’s Travel Patterns and Trends: The Empirical Analysis of Beijing.†Sustainability 9: 981. doi: 10.3390/su9060981. 22. Rahman, M. S. U. (2018). “Travel pattern and mobility constraints of disabled people: a case study on Dhaka city, Bangladesh.†Presented in 15th International Conference on Mobility and Transport for Elderly and Disabled Persons (TRANSED XV), Taipei, Taiwan, 12-15 November 2018. 23. Srichuae, S., V. Nitivattananon, and R. Perera (2015). “Aging society in Bangkok and the factors affecting mobility of elderly in urban public spaces and transportation facilities.†IATSS Research. Available from http://dx.doi.org/10.1016/j.iatssr.2015.12.004 (date accessed 22/1/2021). 24. Widiyastuti, D. and H. Ermawati (2019). “Travel Motivation Factors of Elderly in Yogyakarta City: Push and Pull Factors.†IOP Conf. Ser.: Earth Environ. Sci. 25. Jahangir, S., S. Mowri and A. Bailey (2020). Urban Mobility Infrastructures and the COVID-19 Pandemic: Wellbeing of Older Adults in Bangladesh. Presentation of the Knowledge Exchange Event, EQUIMOB Research Group (https://inclusivemobilities.sites.uu.nl/), Utrecht University, The Netherlands. 26. Anwari, N., M. T. Ahmed, M. R. Islam, M. Hadiuzzaman, S. Amin (2021). “Changes in Travel Behaviour due to the Covid-19 Crisis: A Case Study for a Developing Countryâ€. Transportation Research Interdisciplinary Perspectives, doi: https://doi.org/10.1016/j.trip.2021.100334 27. Jennings, G. and H. Allen (2020). Gaining or losing ground? Ensuring that ‘post-COVID-19’ transportation serves the needs of women with low-income in Sub-Saharan African (SSA) cities. Project Report HVT/L1S115 of COVID-19 Research and Response Transport Recovery Fund, HVT, UK. 28. FCDO (2021). About Us - the Foreign, Commonwealth & Development Office (FCDO). Available from https://www.gov.uk/government/organisations/department-for-internationaldevelopment/about#priorities (date accessed 14/1/2021) 29. Rahman, M. S. U., P. Timms, and F. Montgomery (2012). “Using three-dimensional (3-D) physical models to improve public participation in transport planning: case study on integrating BRT systems with rickshaws in Dhaka city.†Proceedings of CODATU XV (Cooperation for Urban Mobility in the Developing World) Conference- the role of urban mobility in (re)shaping cities, Addis Ababa, Ethiopia, 22-25 October 2012. Available from: http://www.codatu.org/wp-content/uploads/S.-Rahman-P.-Timms-F.-MontgomeryARTICLE-Codatu-XV-2012-EN.pdf (date accessed 9/1/2021).) 30. RAJUK (2016). Dhaka Structure Plan (Draft) 2015-30. Rajdhani Unnayan Katripakkho (RAJUK) (Capital Development Authority), Dhaka, Bangladesh. 31. Roy, S., T. Sowgat, M. U. Ahmed, S.M.T. Islam, N. Anjum, J. Mondal and M.M. Rahman (2018). Bangladesh National Urban Polices and City Profiles for Dhaka and Khulna. Khulna University, Center for Sustainable and Healthy and Learning Cities and Neighborhoods (SHLC). Available from http://www.centreforsustainablecities.ac.uk/research/bangladesh-national-urban-policies-city-profilesdhaka-khulna/ 32. Kabir, A. (2019). Report on Sustainable Urban Transport Index for Khulna, Bangladesh. United Nations, Economic and Social Commission for Bangladesh (ESCAP). Available from https://www.unescap.org/sites/default/d8files/knowledge-products/Khulna_%20Bangladesh.pdf 33. Mangi, M.Y., Z. Yue, S. Kalwar and A. Z. Lashari (2020). “Comparative Analysis of Urban Development Trends of Beijing and Karachi Metropolitan Areas.†Sustainability 12(2): 451. 34. Qureshi, S. (2010). “The fast growing megacity Karachi as a frontier of environmental challenges: Urbanization and contemporary urbanism issues.†Journal of Geography and Regional Planning 3(11): 306-321. 35. Hasan, A. and M. Raza (2015). Responding to the transport crisis in Karachi. IIED and Urban Resource Center. Available from http://pubs.iied.org/10733IIED.html (date accessed 23/1/2021). 36. Pakistan Bureau of Statistics (2020). City population. Available from https://www.citypopulation.de/php/pakistan-distr-admin.php?adm1id=716 (date accessed 22/1/2021). 37. Mkalawa, C.C. and P. Haixiao (2014). “Dar-es-Salaam city temporal growth and its influence on transportation.†Urban Planning and Transport Research 2(1):423-446. DOI: 10.1080/21650020.2014.978951 Available from https://www.tandfonline.com/doi/full/10.1080/21650020.2014.978951 (date accessed 17/1/2021). 79 FINAL REPORT: IMPACTS OF COVID-19 ON MOBILITY OF PHYSICALLY CHALLENGED PEOPLE AND OLDER PEOPLE 38. Mendiate, C. (2016). “A spatial application of an opportunity costing methodology for the assessment of the climate value of cycling.†Procedia - Social and Behavioral Sciences 216:518 – 534. 39. https://www.transformative-mobility.org/assets/publications/6.-TUMI-City-profile-and-story-Lusaka.pdf (date accessed 14/1/2021). 40. Kitwe City Council https://www.kcc.gov.zm/about-kitwe/ (date accessed 25/1/2021). 41. Macrotrends. (2020). Lahore, Pakistan Metro Area Population 1950-2020. Available from https://www.macrotrends.net/cities/22046/lahore/population#:~:text=The%20current%20metro%20are a%20population,a%204.22%25%20increase%20from%202017 (date accessed 25/1/2021). 42. New Age (2020) The Daily New Age, Dhaka, 2020. 43. Abid, K., Y.A. Bari, M. Younas, S.T. Javaid and A. Imran (2020). “Progress of COVID-19 epidemic in Pakistan.†Asia-Pacific Journal of Public Health. 44. Waris, A., A.U. Khan, M. Ali, A. Ali and A. Baset (2020). “COVID-19 outbreak: current scenario of Pakistanâ€. New Microbes and New Infections 100681. 45. Asia, T.C.G. (2020). Pakistan’s COVID-19 Crisis. Available from https://d2071andvip0wj.cloudfront.net/b162-pakistan-covid-19.pdf (date accessed 17/1/2021). 46. Board, N. I. T. (2020). Pakistan Cases Details. Available from https://covid.gov.pk/stats/pakistan (date accessed 17/1/2021). 47. Department, P.S.H.C. (2020). COVID-19 Positive Cases in Punjab. Available from https://pshealthpunjab.gov.pk/Home/Covid19 (date accessed 17/1/2021). 48. Sindh, M.O.H. (2020). District wise Statistics COVID 19, https://www.sindhhealth.gov.pk/DistrictwiseStatistics-COVID-19 (date accessed 17/1/2021). 49. Bank, W. (2020). The World Bank in Pakistan. Available from https://www.worldbank.org/en/country/pakistan/overview (date accessed 17/1/2021). 50. Waheed, R., S. Sarwar, and M.K. Khan (2020). “The impact of COVIDâ€19 on Karachi stock exchange: Quantileâ€onâ€quantile approach using secondary and predicted dataâ€. Journal of Public Affairs 20(4): e2290. Available from https://www.ncbi.nlm.nih.gov/pmc/articles/PMC7435569/ 51. Ministry of Health (2020), Tanzania. 52. Rahman, M. S. U. (2013). Integrating BRT with Rickshaws in Developing Cities: A Case Study on Dhaka City, Bangladesh. Unpublished PhD Thesis, Institute for Transport Studies (ITS), The University of Leeds, UK. Available from http://etheses.whiterose.ac.uk/id/eprint/6871 (date accessed 25/1/2021). 53. Pramanik, M. A. and M.S.U. Rahman (2019). “Operational characteristics of paratransit in medium-sized city: a case study on E-rickshaws in Rangpur City, Bangladesh.†Journal of Bangladesh Institute of Planers (JBIP) 12: 45-62. Available from http://www.bip.org.bd/SharingFiles/journal_book/20200620235930.pdf 54. Noman, S.M., A. Ahmed, and M.S. Ali (2020). “Comparative analysis of public transport modes available in Karachi, Pakistan.†SN Applied Sciences 2: 1-13. 80 FINAL REPORT: IMPACTS OF COVID-19 ON MOBILITY OF PHYSICALLY CHALLENGED PEOPLE AND OLDER PEOPLE APPENDIX A: CITY PROFILE / DESCRIPTION OF THE CITY A1. DHAKA CITY (BANGLADESH) Dhaka, the capital city of Bangladesh, is one of the highly dense cities of the world with 10,484 persons per sq.km. Total land area of the city is 1,528 sq.km and the population is 14.5 million with male female gender ratio 113. Figure A1. Map of Dhaka city with existing public transport routes Transportation system in Dhaka is road-based and the role and contribution of railway or water transport is very minimal in terms of passenger transport. Total length of road network is 1,296 km of which 44% is narrow road (DTCA, 2019). Dhaka is one of the least motorised cities in the world with approximately 30 motorised vehicles per 1,000 population (STP, 2005). However, the traffic volume is very high; the motorised vehicles in major roads and rickshaws in local or narrow streets (Rahman, 2013). At present buses are the only available public transport mode in Dhaka; yet no metro or bus rapid transit (BRT) system available. Modal share of trips in Dhaka city in 2015 are (RAJUK, 2016): car (7.22%), bus (36.97%), rickshaw (37.69%), others (0.001%), rail and water transport (0.003%), and walk (17.73%). 0 5 Kilometers Main roads 81 FINAL REPORT: IMPACTS OF COVID-19 ON MOBILITY OF PHYSICALLY CHALLENGED PEOPLE AND OLDER PEOPLE Bus service in Dhaka is very poor; mostly overcrowded and women or disadvantaged people do not have easy access (Rahman and Nahrin, 2012). A variety of informal travel modes or para-transit are available in Dhaka. The rickshaw is a common and widely available mode in Dhaka; at present there are almost 600,000 rickshaws are available for hire (Rahman, 2013). Average trip time is 45 minutes, and the speed of motorised vehicles reduces to only 6.5 km/ hour during peak hours and average length of the bus trips is 5.8 km (Rahman, 2013). A2. KHULNA CITY (BANGLADESH) Khulna, the 3rd largest city in Bangladesh, is in the southern part of the country. Total land area of Khulna city is 45.65 sq. km (Roy, et al. 2018), and population 1.5 million (Kabir, 2019) with male female ratio 108. Total length of road network in Khulna city is 640 km (KCC, 2020). Existing road infrastructure such as the walkways and road intersections are poorly designed and managed. The major roads of the city often remain congested due to haphazard parking or stopping of buses and easy-bikes. Public transport system in KCC is very limited. Existing city bus service available only in one route – between Rupsha Bus Station and Fultola Bus Station – about 23 km. Bus services are very limited and poor. As a result, the number of easy-bikes increased rapidly during the last few years. The number of registered easy-bikes and rickshaws in KCC is 8,000 and 17,000 respectively (KCC, 2020). Average trip speed on bus, car and autorickshaw is 41 km/h, 52 km/h and 28 km/h respectively (KDA, 2018). Modal share of trips in Khulna are: easybike (37%), rickshaw (18%), motorcycle (11%), bicycle (5%), walking (21%) (Kabir, 2019). Bus ridership average in is 28% with average trip distance 2 to 3 km (Kabir, 2019). Figure A2. Map of Khulna city with existing public transport routes 82 FINAL REPORT: IMPACTS OF COVID-19 ON MOBILITY OF PHYSICALLY CHALLENGED PEOPLE AND OLDER PEOPLE A3. KARAHI CITY (PAKISTAN) Karachi is one of the megacities of Pakistan located in the south of Sindh province that connects Pakistan with waterways via the Arabian Sea. The city consists of total area 3530 sq. km surrounded by Dadu, Thatta and Lasbela districts in north, northeast and northwest direction respectively (Mangi et. al. 2020). The population of Karachi is more than 20 million, which is estimated to be 31.6 million in the year 2030. There are five districts of Karachi further divided into 18 towns and 6 cantonments with 1300 sq. km of developed area (Qureshi, 2010; Shibuya, 2012). Being the financial hub of the country, Karachi generates around 10-15% of GDP for Pakistan (Ellis et. al. 2018; Hasan, 2016). Figure A3. Map of Karachi showing the distribution of towns (Shaikh & Ali, 2016) Figure A4. Road Network of Karachi showing major arterials and distributors (Hasan & Raza, 2015) 83 FINAL REPORT: IMPACTS OF COVID-19 ON MOBILITY OF PHYSICALLY CHALLENGED PEOPLE AND OLDER PEOPLE The transportation network of Karachi comprises mainly of road-based specially for intra-city travel while it also includes air, water, rail-based systems. The road network of 10,000 km length that consists of 93% of local roads and less than 5% of major arterial in Karachi includes three highways (Super-Highway M-9, National Highway N-5, RCD highway N-25), six arterials (Korangi Road, Shahrah-e-Faisal Road, University Road, Shahrah-e-Pakistan Road, Chaudry Fazal Ellahi Road, and RCD Highway) and one expressway (Lyari Expressway) that connects north and south directions (Shibuya, 2012). The Jinnah International Airport in Karachi is one the busiest airports in Pakistan serving approximately 6,212,485 passengers each year. Rail in Pakistan is mainly used as inter-city travel by Pakistan Railway and there are a few railway tracks in Karachi. The intra-city rail existed in Karachi in 1969 but not operational in recent era. The government is working on for rehabilitation of Karachi circular railway (Shibuya, 2012). Figure A5. Modal split for distribution of vehicles (left) and passengers (right) (Hasan & Raza, 2015) The public transport in Karachi mostly consists of informal vehicles including Chingchi, minibuses and buses. The routes for these modes are designed by private sector and approved by Regional Transport Authority (Noman et. al. 2020). Of the road traffic composition in Karachi, almost 83.8% are private vehicles that carry only 37.6% of trips while only 4.5% are public transport vehicles serving around 42% of trips. A4. LAHORE CITY (PAKISTAN) Lahore is the second-most populous city (density 7,000 persons/km2 ) of Pakistan and situated in northeastern province Punjab. According to Pakistan Bureau of Statistics, the total population of Lahore is 12.6 million; with the growth rate of 4.04% expected to be 22 million by 2025. The area of Lahore is about 1,772 km2 and as of 2017 the estimated GDP $127 billion. Lahore District is a subdivision of the Punjab and is further divided into nine administrative zones. The transport system in Lahore is mainly consisting with following: Lahore mass transit projects; road transport (e.g. rickshaw and taxi); railways; airport. Lahore Mass Transit projects are: Metro bus system; Orange Line; Blue Line; Purple Line (SkyscraperCity, 2020). 84 FINAL REPORT: IMPACTS OF COVID-19 ON MOBILITY OF PHYSICALLY CHALLENGED PEOPLE AND OLDER PEOPLE Figure A6. Map of Lahore (left) and town wise Division (right) Figure A7. Lahore Public Transit Network (left); Lahore Mass Transit Projects (right) PMA runs the entire Lahore Metrobus Service (MBS) along with all its connecting feeder buses. Lahore Metrobus Service has become the primary mode of transport now for many locals after it became operational in February 2013. It is the first Bus Rapid Transit (BRT) system of its kind in Pakistan. Orange Line Rail Mass Transit System (LRMTS) is the Pakistan’s first metro train service has been officially inaugurated on 25 October 2020. This Orange Line of Lahore Metro covers 27 km with 26 stations both elevated and underground, expected to offer a quick commute to around 250,000 passengers daily. Blue line is a proposed project that will cover 24 km from Chauburji Chowk to College Road. Purple line is another project for Lahore, becoming an airport to rail link over 32 km. Uber and Careem are available in the city. They need to be booked in advance by App. Motorcycle ride is also available which have been introduced by private companies. Local and auto-rickshaws are also available for ride on low prices. The major hub for all Pakistan Railway services in northern Pakistan is Lahore Junction Station. It includes services to Peshawar and national capital Islamabad-Rawalpindi, and long-distance services to Karachi and Quetta. The main public transportation system Lahore is operated by the Lahore Transport Company (LTC) and Punjab Mass Transit Authority (PMTA). There are many options for public transportation within Lahore; people choose the type of transportation as per priority of that time for them. 85 FINAL REPORT: IMPACTS OF COVID-19 ON MOBILITY OF PHYSICALLY CHALLENGED PEOPLE AND OLDER PEOPLE Figure A8. Feeder Bus 15 Heading towards Bhatti Chowk (left); Test Run of Lahore Orange Line Metro (right) A5. DAR-ES-SALAM CITY (TANZANIA) The city of Dar-es-Salaam, one of the fastest growing cities in the region and the world, has a total surface area of 1,393 sq. km. Figure A9. Map of Dar-es-Salaam City and the Municipalities 86 FINAL REPORT: IMPACTS OF COVID-19 ON MOBILITY OF PHYSICALLY CHALLENGED PEOPLE AND OLDER PEOPLE According to the 2012 population census, the city had a population of 4.36 million which is estimated 6.7 million in 2020. Gender ration of the city is 48.7% male and 51.3% female. It is the major city of Tanzania and the hub of commercial activities. There are more than 575 major industrial establishments in Dar-es-Salaam. Administratively, Dar-es-Salaam has a regional administration headed by the Regional Commissioner and a City Council administration headed by the Mayor of Dar-es-Salaam. The city has five municipal councils (Temeke, Kinondoni, Ilala, Ubungo and Kigamboni) and by their embedded administrative functions they form municipals of the Dar-es Salaam Region. The city has established Bus Rapid Transit (BRT) systems in 2012 and since 2016 operating by the government agency Dar-es-Salaam Bus Rapid Transit Agency (DART). A6. ZANZIBAR CITY (TANZANIA) Zanzibar Island is a semi-autonomous region of Tanzania. It is composed of the Zanzibar Archipelago in the Indian Ocean, 25–50 km (16–31 miles) off the coast of the mainland and consists of many small islands and two large ones: Unguja (the main island, referred to informally as Zanzibar) and Pemba Island. Figure A10. Map of Zanzibar Zanzibar City is a capital of Zanzibar. It’s located on the West Coast of Unguja on the main Island of Zanzibar. The population of Zanzibar city estimated to be more than 700,000 in the 2020 (Macrotrends, 2020), which makes it by far the largest settlement on the islands of Zanzibar, and the sixth largest in Tanzania. Zanzibar city comprises of two main parts, Stone Town and Ng`ambo (literally The Other Side). Stone Town is the historical core of the city, former capital of Zanzibar Sultanate; as because of its unique architectural and culture it was declared as UNESCO World Heritage Site in 2000. Ng`ambo is the much larger area, modern area that developed around Stone Town soon after Zanzibar Revolution. Tourism in Zanzibar is a more recent activity, driven by government promotion that caused an increase from 19,000 tourists in 1985, to 376,000 in 2016 (Glenn-Marrie, 2015). A7. LUSAKA CITY (ZAMBIA) Zambia is one of the most urbanised countries in Sub-Saharan Africa with almost 46% of the population living in towns. Lusaka is Zambia’s capital, and largest commercial and political centre. The total population of 87 FINAL REPORT: IMPACTS OF COVID-19 ON MOBILITY OF PHYSICALLY CHALLENGED PEOPLE AND OLDER PEOPLE Lusaka city is now over 2.8 million, which has been doubled in the last decade, and is projected to rise to 5.1 million by 2035(UN-Population Data). Currently, over 70% population in Lusaka live in informal settlements and peri-urban areas, which are absorbing most of the urban growth and characterised by poor living conditions and major health threats (UN-Habitat 2012). Most of the residents’ face threat of eviction and are vulnerable to the absence of clean water and adequate sanitation facilities, absence of adequate waste disposal as well poor road network. Lusaka is characterised by lack of serviced land, high competition and prices for land, political interference in the land market, complicated and bad-kept record for land usage, slow issuing of land titles and occupancy licenses, and proliferation of slums (UN-Habitat 2012). Figure A10. Map of Lusaka city (Hampwaye, et. al. 2016) Urban development in Lusaka has been driven by population growth, increased expenditure in infrastructure (roads in particular), and a booming real estate sector. The United Nations Department of Economic and Social Affairs considers that existing development plans fail to accommodate and integrate 65% to 70% of urban residents living at the margins in unplanned settlements (Li and Siame 2020). Thus, Lusaka’s urban structure and form is characterised by large swaths of informal settlements, rapid growth of gated communities on the edges of the city and along arterial road, and rapid disappearance of farmland and green spaces. The transport sector has played a pivotal role in enabling economic growth and human development. Transport infrastructure has been provided by the public sector, often with the support of international development partners. However, public transport services depend almost exclusively on the private sector. To maintain its economic growth trajectory, Zambia needs to adapt its transport infrastructure and services to meet the needs of an increasingly urban economy. The transport system in Lusaka has been overrun by a rapid increase in demand and is highly inefficient – resulting in severe congestion and urban inefficiency. The rate of urbanisation and rise of vehicle ownership has outstripped the capacity of existing transport services and infrastructure. Urban expansion has physically surpassed the city administrative boundary and spilled into adjacent areas, engulfing nearby suburbs and absorbing semi-urban areas and rural hinterlands. The congestion is further compounded by a growing suburban lifestyle where gated communities are becoming increasingly common. The lack of reliable nonmotorised transport infrastructure also hinders efficient urban mobility, as over a quarter of trips are made on foot. The compounded challenge of urban transport has been attributed to triple factors, namely, rapid 88 FINAL REPORT: IMPACTS OF COVID-19 ON MOBILITY OF PHYSICALLY CHALLENGED PEOPLE AND OLDER PEOPLE population growth, fast rising suburbia cultures and lack of an integrated urban transport system and infrastructure. The result has been, over 65% of Lusaka population has no daily access to motorised means of transport. A8. KITWE CITY (ZAMBIA) Kitwe is a trading centre and a mining hub in the Copperbelt province of Zambia and the second largest city of the country. Kitwe’s development as a city began with the discovery of rich sulphide ore deposits at Nkana by the Bwana Mkubwa Company in 1927. Like most urban centres on the Copperbelt of Zambia, urban growth of Kitwe has followed the presence of mining activities. However, several unplanned settlements have been formed in the city as those could not be absorbed into the formal housing system. According to the 2010 Census, population of Kitwe has been estimated about 0.52 million. The average annual population growth rate for the district is 3.2% and is the most densely populated city in Copperbelt Province at 666.1 per sq. km (CSO, 2010). Figure A11. Location map of Kitwe city in the Copperbelt Province The city has however experienced growth as a result of emerging service industry supplying the mines and other retail and manufacturing activities. Real estate has also become another engine of growth for the city. The presence of the country’s second largest university – Copperbelt University – has contributed to the growth of the city’s property investments and other establishments such as shopping malls and office parks. However, the City continue to have a poorly developed transport systems, with small buses being the most used for getting around in the city. 89 FINAL REPORT: IMPACTS OF COVID-19 ON MOBILITY OF PHYSICALLY CHALLENGED PEOPLE AND OLDER PEOPLE References DTCA (2019). Annual Report 2018-19. Dhaka Transport Coordination Authority, Dhaka, Bangladesh. Ellis, P. D., J.S. Friaa and J.K. Kaw (2018). Transforming Karachi into a livable and competitive megacity: a city diagnostic and transformation strategy. Hampwaye, G., M. Mataa, G. Siame and O. Kamanga (2016). City regions food system situation analysis, Lusaka Zambia. FAO, International Network of Resource Centres on Urban Agriculture and Food Security (RUAF) and University of Zambia. FAO Plant Production and Protection Division (AGP). Available on http://www.fao.org/3/a-bl822e.pdf . Habitat, U. N. (2012). Zambia urban housing sector profile. Nairobi, Kenya: UNON publishing services section. Retrieved 29 March, 2015. Hasan, A. (2016). Emerging urbanisation trends: The case of Karachi. Retrieved from Hasan, A. and M. Mohib, M. (2003). The case of Karachi, Pakistan. Hasan, A., and Raza, M. (2015). Responding to the transport crisis in Karachi. IIED Working Paper, IIED and Urban Resource Center, IIED. Available on https://pubs.iied.org/10733iied KCC (2020). Data from the planning department of Khulna City Corporation (KCC), Khulna. Li, H. and G. Siame (2020). “Nature and Impact of Chinese and South African Engagement on the Development of the City of Lusaka.†The African Review 47(2): 311-335. Rahman, M. S. U. and K. Nahrin (2012). “Bus services in Dhaka city – users’ experiences and opinions.†Journal of Bangladesh Institute of Planners (JBIP) 5: 93-105. Shaikh, M. A. and M.S. Ali (2016). “Spatial distribution and accessibility to public sector tertiary care teaching hospitals in Karachi: A Geographic Information Systems application.†J Pak Med Assoc 66(7): 889-892. Shibuya, M. (2012). The Study for Karachi Transportation Improvement Project. Final Report Volume 1 (Master Plan). Retrieved from https://openjicareport.jica.go.jp/pdf/12086369_01.pdf SkyscraperCity. (2020). Retrieved from SkyscraperCity: https://www.skyscrapercity.com/threads/lahore-rapidmass-transit-system-orange-line-infrastructure-complete-%E2%80%8E.1696650/page-154#post-142921988 STP (2005). Urban Transport Policy: The Strategic Transport Plan (STP) for Dhaka. BCL and Louis Berger Group Inc., Dhaka. World Population Review. (2020). Retrieved from World Population Review: https://worldpopulationreview.com/world-cities/lahore-population 90 FINAL REPORT: IMPACTS OF COVID-19 ON MOBILITY OF PHYSICALLY CHALLENGED PEOPLE AND OLDER PEOPLE APPENDIX B: NEIGHBORHOOD LOCATIONS OF HOUSEHOLD SURVEY Dhaka, Bangladesh (2-12 November 2020) Khulna, Bangladesh (7- 18 November 2020) 1. Uttara 11 & 7 2. Uttara Azampur: Sector 6 - Uttar Khan – Chalaban - Dakkhin Khan 3. Nikunjo - Khilkhet 4. Basundhara – Banani - Baridhara 5. Baddah - Rampura 6. Khilgaon – Goran - Basabo 7. Malibagh - Mogbazar 8. Sayedabad - Jatrabari 9. Sanir Akhra - Dania 10. Zurain – Dhulaipar - Muradpur 11. Old Dhaka: Wari – Narinda - Sutrapur 12. Old Dhaka: Bongsal – Armanitola - Lalbagh 13. Aarambag – Tikatuli – Komolapur Quarters 14. Fakirapul- Polton - Shantinagar 15. Azimpur – Polashi - DU 16. Jigatola - Hazaribag 17. Dhanmondi – Kolabagan - Lalmatia - Mohammadpur 18. Shamoli – Shekhertek – Ring Road Housing Baidul Aman 19. Shewrapara – Kazipara – Monipur – Pirer Bag 20. Kathalbagan – Poribag - Tejkunipara 21. Cantonment: Kochukhet – Kafrul - Ibrahimpur 22. Cantonment: Banani DOHS & Baridhara DOHS 23. Kollyanpur - Tolarbag – Paikpara 24. Mirpur 2 & 6 25. Mirpur 11 & 12 26. Mirpur Pallabi – Duari para – Eastern Housing 27. Kalshi Slum 28. Gulshan Slum 29. Syedabad Doyaganj Swiper colony 30. Mohammadpur Ring Road slum 31. Mirpur 14 CRP slum 1. Fullbari Gate 2. Shenpara 3. Munshipara 4. Religate 5. Moddhodanga 6. Doulatpur Residential Area 7. Doulatpur Industrial Area 8. Islambag 9. KDA Residential Area 10. Khalishpur Housing State 11. Goalkhali Residential Area 12. Navy Staff Quarters 13. Mujgunni Residential Area 14. Khalishpur Residential Area 15. Rayer Mahal 16. Boro Boyra 17. Sonadanga Residentail Area Phase 1 18. Sonadanga Residentail Area Phase 2 19. Boyra 20. Mohammadnagar 21. Seikhpara 22. Bosupara 23. Goborchaka 24. East Baniakhamar 25. West Baniakhamar 26. Banorgati 27. Farazipara 28. Nirala Residential Area 29. Bagmara 30. Munshipara 31. West Tootpara 32. South Tootpara 33. Jinnahpara 34. Lobonchora 35. Jorakol Bazar Karachi, Pakistan (2-20 November 2020) Lahore, Pakistan (4-20 November 2020) 1. Bin Qasim 2. Clifton- DHA Phase 1 3. Clifton- NHS Zamzama 4. Gulshan- Saima Classic 5. Gulshan- Gulzar e hijri 6. Gulberg- Azizabad 7. Gulberg- Ancholi 8. Saddar- Garden 9. Saddar- Aram Bagh 1. Ravi Town-Lajpat Road 2. Ravi Town - Rehman Garden 3. Ravi Town - Shahdara Mor 4. Gulberg Town- Shahdara Station 5. Gulberg Town - Bagbanpura 6. Gulberg Town – Naseerabad 7. Nishtar Town- Sufiabad 8. Nishtar Town - Crest Road 9. Nishtar Town - Nor Masjid 91 FINAL REPORT: IMPACTS OF COVID-19 ON MOBILITY OF PHYSICALLY CHALLENGED PEOPLE AND OLDER PEOPLE 10. Orangi- Islam Nagar 11. Orangi- Sector 15-C 12. Korangi 13. Jamshed Town- Mehmoodabad 14. Jamshed Town-Tareq Road 15. Liaquatabad 16. Landhi 17. North Karachi- Anda Mor 18. North Karachi- Sector 11B 19. Lyari- Minawali Colony 20. North Nazimabad- Gol Market 21. North Nazimabad- Shadman 22. Malir Cantonment 23. Gadap 24. Shah Faisal- Sadat Colony 25. Model Colony, Malir 26. Goth Laji Salar, Kiemari 10. Shalamar Town- Bagbanpura 11. Shalamar Town- UET 12. Shalamar Town- Sing Pura 13. Wagha Town- Muhammad Nagar 14. Wagha Town- Baseen 15. Aziz Bhatti Town- Islam Nagar 16. Aziz Bhatti Town- Tajpura 17. Aziz Bhatti Town- Fatehgarh 18. Data Ganj Bakhsh Town- Sunat Nagar 19. Data Ganj Bakhsh Town- Anarkali 20. Data Ganj Bakhsh Town- Islamia College 21. Iqbal Town- Babu Sabu 22. Iqbal Town- Sabzazar 23. Iqbal Town- Racecourse 24. Samnabad Town- Wahdat Colony 25. Samnabad Town- Chauburji 26. Samnabad Town- Rasool Park Dar-es-Salaam, Tanzania (9-28 November 2020) Zanzibar, Tanzania (11 Nov – 5 December 2020) 1. Survey 2. Mlalakuwa 3. Mwenge 4. Makongo 5. Magomeni 6. Mwananyamara 7. Sinza 8. Mawasiliano, 9. Manzese 10. Kimara 11. Tabata Shule 12. Segerea 13. Riverside 14. Msewe 15. Buza 16. Chang`ombe 17. Buza 18. Tandika 19. Nasa “B†20. Kilimahewa 21. Devis Conner 22. Keko 23. Gongo la Mboto, 24. Mbagala 25. Buguruni 26. Gerezani 27. Kariakoo 28. Mchafukoge 29. Posta 30. Kigogo 31. Tegeta 32. Mbezi juu 33. Mbezi beach 34. Mbezi Makonde 35. Tegeta Kunduchi 36. Tegeta Kibaoni 1. Bububu 2. Kisakasaka 3. Kwarara 4. Kisauni 5. Kwamani 6. Mabatini 7. Legeza mwendo 8. Mtopepo 9. Mwera 10. Stone town 11. Jitimai 12. Skuli 13. Taveta 14. Sai 15. Mzalendo 16. Mpendae 17. Kwa Mchina 18. Jang`ombe 19. Amani 20. Welezo 21. Kichangani 22. Kijangwani 23. Tunguu 24. Kilimahewa 25. Kiembe samaki 26. Sahuri Moyo 27. Darajani 28. Kwerekwe 29. Saateni 30. Tomondo 92 FINAL REPORT: IMPACTS OF COVID-19 ON MOBILITY OF PHYSICALLY CHALLENGED PEOPLE AND OLDER PEOPLE Lusaka, Zambia (18-25 November 2020) Kitwe, Zambia (19-26 November 2020) 1. 10 Miles 2. Chaisa 3. Chawama 4. Chazanga 5. Chilenje 6. Chipata Township 7. Emasidale 8. Fairview 9. Garden 10. George Compound 11. Jack Compound 12. John Howard 13. John Laing 14. Kabanana 15. Kabwata 16. Kalikiliki Compound 17. Kalingalinga 18. Kalundu 19. Kamwala 20. Kanyama 21. Kasisi Area 22. Kwamwena 23. Lilayi 24. Linda Compound 25. Longacres 26. Makeni 27. Matero 28. Mass Media 29. Maziyopa 30. Meanwood Phase 2 31. Misisi Compound 32. Mtendere 33. Ngwerere 34. Northmead 35. Olympia 36. Presidential Housing Initiative Area (PHI) 37. Rhodes Park 38. Roma Township 39. Zingalume 1. Bulangililo 2. Chachacha 3. Chamboli 4. Chibuluma 5. Chimwemwe 6. Kapoto 7. Kwacha 8. Luangwa 9. Mindolo 10. Miseshi 11. Mulenga 12. Ndeke 13. Ndeke Village and Ndeke Compound 14. Nkana East 15. Nkana West 16. Old Kwacha 17. Parklands 18. River Side 19. Town Centre 20. Twatasha 21. Wusakile 22. Zambia Compound 93 FINAL REPORT: IMPACTS OF COVID-19 ON MOBILITY OF PHYSICALLY CHALLENGED PEOPLE AND OLDER PEOPLE APPENDIX C: QUESTIONNAIRE FOR DATA COLLECTION 94 FINAL REPORT: IMPACTS OF COVID-19 ON MOBILITY OF PHYSICALLY CHALLENGED PEOPLE AND OLDER PEOPLE 95 FINAL REPORT: IMPACTS OF COVID-19 ON MOBILITY OF PHYSICALLY CHALLENGED PEOPLE AND OLDER PEOPLE APPENDIX D: SAMPLE SIZE FROM ONLINE SURVEY Table D2. Distribution of respondents from different city received from online survey Country City Respondents Total Bangladesh Dhaka 16 16 Khulna 00 Other city 00 Village/Rural Area 00 Pakistan Karachi 77 88 Lahore 5 Other city 3 Village/Rural Area 3 Zambia Lusaka 7 15 Kitwe 8 Other city 00 Village/Rural Area 00 96 FINAL REPORT: IMPACTS OF COVID-19 ON MOBILITY OF PHYSICALLY CHALLENGED PEOPLE AND OLDER PEOPLE APPENDIX E: SOCIO-ECONOIC PROFILE OF THE RESPONDENTS E1. BANGLADESH (Dhaka and Khulna) Table E1-1. Age group of the respondents Age Group Dhaka (F) Dhaka (%) Khulna (F) Khulna (%) Total Sample (F) Below 20 * 15 6 2 1.00 16 21-40 * 17 7 1 0.50 26 41-60 * 18 7 9 4.50 27 61-70 155 61 179 89.50 334 71-80 35 14 7 3.50 37 80+ 13 5 2 1.00 15 Total 253 100 200 100 453 Note: * below 60 years are the disabled persons. Table E1-2 shows the disability types of the respondents who have disability or physically challenges. Several respondents may have multiple disability; however, they were asked to report only the major disability type. Table E1-2. Disability types of the respondents from Dhaka and Khulna city Disability Types Dhaka (F) Dhaka (%) Khulna (F) Khulna (%) Total (F) None 201 79 161 80.50 362 Visually impaired or Blind 4 1.5 2 1.00 6 Crutch User 7 3 9 4.50 16 Deaf or hearing problem 3 1 00 00 3 Dumb or speech problem 13 5 00 00 13 Knee/ joint Pain 6 2.5 21 10.50 27 Mentally Impaired 11 4.5 00 00 11 Wheelchair Bound 8 3.5 6 3.00 14 Learning difficulties & development disability 00 00 1 0.50 1 Total 253 100 200 100 453 Table E1-3 Dependency for daily needs of the respondents Dependency for daily needs Dhaka (F) Dhaka (%) Khulna (F) Khulna (%) Do himself / herself 162 64 143 71.5 Dependent on family members or relatives 91 36 57 28.5 Total 253 100 200 100 97 FINAL REPORT: IMPACTS OF COVID-19 ON MOBILITY OF PHYSICALLY CHALLENGED PEOPLE AND OLDER PEOPLE Table E1-4. Household size of the respondents from Dhaka and Khulna city Household Size Dhaka (F) Dhaka (%) Khulna (F) Khulna (%) Total (F) 1 person 5 2 1 0.5 6 2-3 persons 51 20 27 13.5 78 4-5 persons 138 55 141 70.5 279 6-8 persons 49 19 27 13.50 76 8+ persons 10 4 4 2.00 14 Total 253 100 200 100 453 Table E1-5 Travel alone or accompanied Travel alone or accompanied Dhaka (F) Dhaka (%) Khulna (F) Khulna (%) Travel alone 152 59 168 84 Accompanied by family member 79 32 30 15 Accompanied by neighbour or friend 22 9 2 1 Total 253 100 200 100 Figure E1-1 and Table E1-6 respectively show the education attainment of the respondents and their occupation before COVID-19. About 18.5% and 26% respondents in Dhaka and Khulna respectively are now retired. Those who are retired, their most prolonged profession were employee of government or private sector (69% and 96% respectively), business (7% and 2% respectively), and worker (23% and 2% respectively). Of the retired, only 23% in Dhaka and 7% in Khulna are now working while the remaining are not engaged in any job. Figure E1-1. Education attainment of the respondents in Dhaka and Khulna city Table E1-6. Occupation of the respondents Occupation Dhaka (F) Dhaka (%) Khulna (F) Khulna (%) Total (F) Unemployed 21 9 5 2.5 26 Housewife 58 25.5 20 10 78 Business or enterprise 40 17.5 57 28.5 97 Employee (govt./ private) 12 5 42 21 54 36% 28% 15% 8% 8%5% Dhaka Illiterate Primary SSC HSC Graduate Masters & above 3%10% 14% 26% 34% 13% Khulna Illiterate Primary SSC HSC Graduate Masters & above 98 FINAL REPORT: IMPACTS OF COVID-19 ON MOBILITY OF PHYSICALLY CHALLENGED PEOPLE AND OLDER PEOPLE Occupation Dhaka (F) Dhaka (%) Khulna (F) Khulna (%) Total (F) Worker 26 11.5 18 9 44 Student 3 1.5 2 1 5 Retired 42 18.5 52 26 94 Other 26 11.5 4 2 30 Total 228 100 200 100 428 Figure E1-2 shows the respondents’ access to the household vehicle. Access to the household vehicle might be influenced by the ability of driving; as 68% in Dhaka and 42.5% in Khulna do not know how to drive the vehicle owned by household. Figure E1-2. Access to the household vehicle of the respondents in Dhaka and Khulna city Table E1-7. Stayed in this house or location during lockdown Where stayed during lockdown Dhaka (F) Dhaka (%) Khulna (F) Khulna (%) This place/ house 235 93 191 95.5 Other place (village/ other city) 18 7 9 4.5 Total 253 100 200 100 Table E1-8. Respondents’ usual trips on a typical day before COVID-19 Total Trips per Day Dhaka (F) Dhaka (%) Khulna (F) Khulna (%) None 3 1.5 0 0 2 167 75.5 190 95 4 35 16 10 5 6 16 7 0 0 Total 221 100 200 100 Table E1-9. Respondents’ change in typical travel behaviour and mobility due to COVID-19 Change in Travel Behaviour or Mobility Dhaka (F) Dhaka (%) Khulna (F) Khulna (%) Yes (changed) 46 18 60 30 No Change (Same as it was Before) 207 82 140 70 0 5 10 15 20 25 30 35 40 Always/Most of the time When needed Rarely or sometimes Never Khulna (%) Dhaka (%) 99 FINAL REPORT: IMPACTS OF COVID-19 ON MOBILITY OF PHYSICALLY CHALLENGED PEOPLE AND OLDER PEOPLE Table E1-10. Respondents’ change in trip cost due to COVID-19 Change in Trip Cost Dhaka (F) Dhaka (%) Khulna (F) Khulna (%) Same as it was before 205 81.5 56 28.00 Increased 32 13 143 71.50 Decreased 14 5.5 1 0.50 Total 251 100 200 100 Table E1-11. Respondents’ change in occupation after COVID-19 Change in occupation Dhaka (F) Dhaka (%) Khulna (F) Khulna (%) No Change 233 93 192 96.5 Yes, Changed 18 7 7 3.5 Total 251 100 199 100 Table E1-12. Respondents new or additional travel problem/ constraint due to COVID-19 that was not before Additional problem for travel Dhaka (F) Dhaka (%) Khulna (F) Khulna (%) Yes, additional problems* 8 3 35 17.5 No** 244 97 165 82.50 Total 252 100 200 100 * Those who mentioned additional travel problem; the problems are: • Uncomfortable of waring the face mask, breathing problem because of mask; • Cannot travel in public bus, need to maintain physical distancing; • Scared of going outside of home; • Transport cost increased e.g. high rickshaw fare; • vehicle is not available or fewer vehicle available. ** Those who mentioned NO additional travel problems; the magnitude of the problem (they usually faced before COVID-19) are now: Problems in same magnitude Dhaka (F) Dhaka (%) Khulna (F) Khulna (%) Increased the magnitude of the problem 12 5.5 98 57 Same as it was before 213 94.5 74 43 Total 225 100 172 100 From the online survey, all the respondents are elderly people (no response from disabled people) who belong to middle- or higher-income groups (household monthly income Tk 50,000 and above) and 60% have household vehicle with access always or when needed. Almost 56% are male. Due to COVID-19, 56% do not feel any additional problem for travel and 83% have no change in travel cost, though 75% mentioned they travel less. During lockdown, 69% had no travel problem. Before COVID-19, 69% did not feel any travel problem as used car (56%) or taxi (6%) or walk (38%), 75% had no cost or applicable, 19% Tk 202-500 and 6% Tk 101-200. 100 FINAL REPORT: IMPACTS OF COVID-19 ON MOBILITY OF PHYSICALLY CHALLENGED PEOPLE AND OLDER PEOPLE E2. PAKISTAN (Karachi and Lahore) Table E2-1 briefly delineates the socio-economic profile of the respondents. Figure E2-1 shows the gender distribution of the respondents with physical challenges or disability; the majority are males whilst women make up only 31% and 26% in Karachi and Lahore, respectively. Table E2-1. Demographics of the respondents from Karachi and Lahore city Categories Karachi (N=209) Lahore (N=237) Number of Respondents % Number of Respondents % Sample Collected Disabled 30 14% 2 0.8% Physically fit Older 114 55% 156 66% Older with Disability 65 31% 79 33% Age Group Below 20 17 8% 0 0% 21-40 13 6% 2 1% 41-60 21 10% 68 29% 61-70 123 59% 135 57% 71-80 25 12% 25 11% Above 80 10 5% 7 3% Gender Male 144 69% 175 74% Female 65 31% 62 26% Figure E2-1. Gender distribution with physical challenges of the respondents from Karachi and Lahore city Figure E2-1 shows that the data also covers some other types of disabilities: wheelchair-bound; mentally impaired; blind or vision impaired; deaf or with hearing problems; dumb or with speech problems; and crutch users. The percentages for these groups are 10%, 24%, 8%, 2%, 8%, and 10% respectively for Karachi and 20%, 1%, 5%, 4%, 0% and 10% respectively for Lahore. 101 FINAL REPORT: IMPACTS OF COVID-19 ON MOBILITY OF PHYSICALLY CHALLENGED PEOPLE AND OLDER PEOPLE Figure E2-2. Disability types of the respondents from Karachi and Lahore city Table E2-2 provides the family size distribution of the respondents for both cities. Only a few respondents, 2.5% and 2% in Karachi and Lahore respectively, live in care homes for the elderly. Table E2-2. Household size of the respondents in Karachi and Lahore Categories Karachi Lahore Number of Respondents % Number of Respondents % Household Size 1 1 0.5% 0 0% 2 – 3 30 14.5% 6 3% 4 – 5 88 42% 40 18% 6 – 8 61 29% 109 50% 8+* 29 14% 65 30% Total 209 100 220 100 Note: * Several of them live in care homes. Figure E2-3 shows the education attainment of the respondents; in Karachi 38% are graduates and 20% received primary education while in Lahore it is 33% and 27% respectively. 102 FINAL REPORT: IMPACTS OF COVID-19 ON MOBILITY OF PHYSICALLY CHALLENGED PEOPLE AND OLDER PEOPLE Figure E2-3: Education level the respondents in Karachi and Lahore city Figure E2-4. Occupation of the respondents in Karachi and Lahore city The retired people had previously been involved in a variety of professions including teaching, engineering, management, business, and journalism. Only 4 respondents are working after retirement. 103 FINAL REPORT: IMPACTS OF COVID-19 ON MOBILITY OF PHYSICALLY CHALLENGED PEOPLE AND OLDER PEOPLE Figure E2-5. Personal monthly expenditure (PKR/ month) of the respondents in Karachi and Lahore city Table E2-3. Respondents’ access to the household vehicle in Karachi city Access to Household Vehicle Karachi (F) Karachi (%) Always/ Most of the time 79 46 When needed 45 26 Rarely or sometimes 29 17 Never 19 11 Total 172 100 Table E2-4. Respondents’ usual trips on a typical day before COVID-19 Total Trips per Day Karachi (F) Karachi (%) Lahore (F) Lahore (%) 2 trips 104 50 110 50 3 or more trips 104 50 110 50 Total 208 100 220 100 E3. TANZANIA (Dar-es-Salaam and Zanzibar) Table E3-1. Demographics of the respondents from Dar-es-Salaam and Zanzibar city Categories Dar-es-Salaam City (N=203) Zanzibar Unguja (N=155) Number of Respondents % Number of Respondents % Category of the Respondents or Sample Disabled 36 18% 6 3% Physically fit Older 152 76% 123 80% Older with Disability 15 6% 26 17% Age Group Below 20 2 1 00 00 104 FINAL REPORT: IMPACTS OF COVID-19 ON MOBILITY OF PHYSICALLY CHALLENGED PEOPLE AND OLDER PEOPLE Categories Dar-es-Salaam City (N=203) Zanzibar Unguja (N=155) Number of Respondents % Number of Respondents % 21-40 20 10 1 0.65 41-60 13 6 5 3.35 61-70 107 53 112 72.25 71-80 58 28.5 29 18.75 Above 80 3 1.5 8 5 Gender Male 127 63% 88 57% Female 76 37% 67 43% The respondents below 60 years are the disabled people. Figure E3-1. Gender distribution with physical challenges of the respondents from Dar-es-Salaam and Zanzibar city Figure E3-2 shows different types of disability of the respondents. A large portion of data is obtained from elderly people and for them knee/ joint pain is the most common weakness. The data also covers some other types of disabilities that are wheelchair-bound, mentally impaired, blind or vision impaired, deaf or hearing problem, dumb or speech problem, and crutch users, with percentages of 22%, 2%, 4%, 1%, and 9% respectively for Dar-es-Salaam and 12%, 9%, 5%, 5%, 1% and 6% respectively for Zanzibar. 0 10 20 30 40 50 60 70 80 90 100 Physically Fit Older Disabled Older and Disabled (%) Dar es Salaam City Male Female 0 10 20 30 40 50 60 70 80 90 100 Physically Fit and Older Disabled Older and Disabled (%) Zanzibar Unguja Male Female 105 FINAL REPORT: IMPACTS OF COVID-19 ON MOBILITY OF PHYSICALLY CHALLENGED PEOPLE AND OLDER PEOPLE Figure E3-2. Disability types of the respondents from Dar-es-Salaam and Zanzibar city Table E3-2. Household size of the respondents in Dar-es-Salaam and Zanzibar Household Size (person) Dar-es-Salaam City Zanzibar City Frequency % Frequency % 1 0 0 0 0 2-3 39 23 11 7.5 4-5 58 34.5 25 17.5 6-8 62 37 50 35 8+ 9 5.5 57 39 Total 168 100 143 100 Table E3-3. Dependency for daily needs of the respondents Dependency for daily needs Dar-es-Salaam (F) Dar-es-Salaam (%) Zanzibar (F) Zanzibar (%) Do himself / herself 134 66 85 55 Dependent on family member/ relatives 68 34 70 45 Total 202 100 155 100 Table E3-4. Travel alone or accompanied Travel alone or accompanied Dar-es-Salaam (F) Dar-es-Salaam (%) Zanzibar (F) Zanzibar (%) Travel alone 162 83 122 79 Accompanied by family member 24 12 31 20 Accompanied by neighbour/ friend 10 5 2 1 Total 196 100 155 100 5% 6% 5% 1% 62% 9% 12% Zanzibar Unguja Blind Crutch User Deaf Dumb Kneel/Joint Pain Mentally Impaired Wheelchair Bound 4% 9% 1% 62% 2% 22% Dar es Salaam City Blind Crutch User Deaf Kneel/Joint Pain Mentally Impaired Wheelchair Bound 106 FINAL REPORT: IMPACTS OF COVID-19 ON MOBILITY OF PHYSICALLY CHALLENGED PEOPLE AND OLDER PEOPLE Table E3-5. Respondents’ access to the household vehicle Access to vehicle Dar-es-Salaam (F) Dar-es-Salaam (%) Zanzibar (F) Zanzibar (%) Always/ Most of the time 15 52 18 40 When needed 10 34 19 42 Rarely or sometimes 4 14 7 16 Never 00 00 1 2 Total 29 100 45 100 Table E3-6. Stayed in this house or location during lockdown Stayed in house or this place Dar-es-Salaam (F) Dar-es-Salaam (%) Zanzibar (F) Zanzibar (%) Yes 199 98.5 142 91.5 No (at village/ other city) 3 1.5 13 7.5 Total 202 100 155 100 If lived at village or other city, what travel mode used to come in this place Bus 3 100 12 92 Personal vehicle 0 0 1 8 Figure E3-3 shows the educational attainment of respondents; many have primary education in both cities, i.e. 50% for Dar-es-Salaam and 44% for Zanzibar. Illiteracy is also pronounced (33% and 30% respectively) while about 1% have a Masters’ degree in both Dar-es-Salaam and Zanzibar. Figure E3-3. Education level of respondents Dar es Salaam City (Left) and Zanzibar Unguja (Right) Figure E3-4 illustrates the distribution of the respondents’ occupations before COVID-19. The data obtained from Dar-es-Salaam shows that the dominating categories are petty trading or business-owning (42%) and unemployed (39%) while some (9%) are retired. For Zanzibar, a high proportion of respondents are businessowning (24%), unemployed (25%) and unemployed homemakers (20%). The difference is cultural as most female respondents in Zanzibar who are unemployed declare to be housewives while for Dar-es-salaam they are engaged in small business (petty trading). 6% 1% 2% 8% 50% 33% Dar es Salaam City Graduate Maasters HSC SSC Primary Illiterate 3% 1% 7% 15% 44% 30% Zanzibar Unguja Graduate Masters HSC SSC Primary Illiterate 107 FINAL REPORT: IMPACTS OF COVID-19 ON MOBILITY OF PHYSICALLY CHALLENGED PEOPLE AND OLDER PEOPLE Figure E3-4. Occupation of the respondents in Dar-es-Salaam and Zanzibar E4. ZAMBIA (Lusaka and Kitwe) A significant portion of the respondents in Lusaka belong are in the age group 41-60 years, who are physically challenged. Table E4-1 shows the different types of disability of the respondents; a very high proportion of the disability covered is a knee/ joint pain and wheelchair-bound or crutch user. Table E4-1. Age group of the respondents from Lusaka and Kitwe city Age Group Lusaka (F) Lusaka (%) Kitwe (F) Kitwe (%) Below 20 * 9 4.5 9 4 21-40 * 11 5.5 32 15 41-60 * 42 21 93 44.5 61-70 76 38 47 22.5 71-80 39 19.5 15 7 80+ 23 11.5 14 7 Total 200 100 210 100 Note: * below 60 years are the disabled persons. Table E4-2. Disability types of the respondents from Lusaka and Kitwe city Disability Types Lusaka (F) Lusaka (%) Kitwe (F) Kitwe (%) None 59 29 138 65 Blind 13 6.5 6 3 Crutch User 16 8 11 5 Deaf or hearing problem 12 6 7 3.5 Dumb or speech problem 12 6 6 3 Knee/ joint Pain 70 35 18 8.5 Mentally Impaired 1 0.5 6 3 42% 1% 3% 9% 5% 39% 1% Dar es Salaam City Bussiness Employee (Gvt/Pvt) Housewife Private Retired Unemployed Worker 24% 3% 20% 10% 9% 25% 9% Zanzibar Unguja Bussiness Employee (Gvt/Pvt) Housewife Private 108 FINAL REPORT: IMPACTS OF COVID-19 ON MOBILITY OF PHYSICALLY CHALLENGED PEOPLE AND OLDER PEOPLE Disability Types Lusaka (F) Lusaka (%) Kitwe (F) Kitwe (%) Wheelchair Bound 17 8.5 15 7 Learning difficulties & development disability 1 0.5 4 2 Total 201 100 211 100 Table E4-3. Household size of the respondents in Lusaka and Kitwe city Household Size Lusaka (F) Lusaka (%) Kitwe (F) Kitwe (%) 1 8 4 3 1.5 2-3 34 17 19 9 4-5 56 28 79 37.5 6-8 69 34 99 47 8+ 33 * 16 11 5 Total 201 100 211 100 * 3 respondents live in care homes for elderly. Table E4-4. Dependency for daily needs of the respondents Dependency for daily needs Lusaka (F) Lusaka (%) Kitwe (F) Kitwe (%) Do himself / herself 127 63 131 62 Dependent on family member/ relatives 74 37 80 38 Total 201 100 211 100 Table E4-5. Travel alone or accompanied Travel alone or accompanied Lusaka (F) Lusaka (%) Kitwe (F) Kitwe (%) Travel alone 131 65 135 64 Accompanied by another person 70 35 76 36 Total 201 100 211 100 Table E4-6. Stayed in this house or location during lockdown Where stayed during lockdown Lusaka (F) Lusaka (%) Kitwe (F) Kitwe (%) This place/ house 163 81 179 85 Other place (village/ other city) 38 19 32 15 Total 201 100 211 100 Table E4-7. Respondents’ access to the household vehicle Access to vehicle Lusaka (F) Lusaka (%) Kitwe (F) Kitwe (%) Always/ Most of the time 18 33 59 71 When needed 14 25 11 13 Rarely or sometimes 17 31 13 16 Never 6 11 00 00 Total 55 100 83 100 109 FINAL REPORT: IMPACTS OF COVID-19 ON MOBILITY OF PHYSICALLY CHALLENGED PEOPLE AND OLDER PEOPLE Table E4-8. Education attainment of the respondents from Lusaka and Kitwe city Education Lusaka (F) Lusaka (%) Kitwe (F) Kitwe (%) Illiterate 48 24 9 4 Primary-grade 7 44 22 10 5 Junior Secondary- Grade 9 37 18 21 10.5 Senior Secondary- Grade 12 27 13.5 55 26 Graduate 38 19 100 47 Masters & above 7 3.5 16 7.5 Total 201 100 211 100 Table E4-9. Occupation of the respondents before COVID-19 in Lusaka and Kitwe city Occupation Lusaka (F) Lusaka (%) Kitwe (F) Kitwe (%) Unemployed 49 25 31 14 Housewife 10 5 17 8 Business or entrepreneur 54 27 41 19.5 Employee 20 10 71 33 Worker 17 8.5 12 5.5 Student 9 4.5 7 3 Retired 42 21 32 15 Total 201 100 211 100 Of the retired, only 25% in Lusaka and 56% in Kitwe are now working while the remaining are not doing any work. Table E4-10. Most prolonged occupation of the retired respondents from Lusaka and Kitwe city Occupation Lusaka (F) Lusaka (%) Kitwe (F) Kitwe (%) Business 4 9.5 00 00 Employee (govt./ private) 22 52.5 13 40.5 Worker 12 28.5 19 59.5 Other 4 9.5 00 00 Total 42 100 32 100 Table E4-11. Individual expenditure of the respondents from Lusaka and Kitwe Individual Expenditure (ZMW/ month) Lusaka (F) Lusaka (%) Kitwe (F) Kitwe (%) Below 250 114 57 47 22.5 251- 1,000 28 14 75 35.5 1,001- 2,500 23 11.5 19 9 2,501- 5,000 17 8.5 52 24.5 5,000 + 19 9 18 8.5 Total 201 100 211 100 110 FINAL REPORT: IMPACTS OF COVID-19 ON MOBILITY OF PHYSICALLY CHALLENGED PEOPLE AND OLDER PEOPLE Table E4-12. Respondents’ usual trips on a typical day before COVID-19 Total Trips Lusaka (F) Lusaka (%) Kitwe (F) Kitwe (%) None 43 20 34 16 1-2 121 57 149 70.5 3-4 44 20.5 24 11.5 5 + 5 2.5 3 1.5 Total 213 100 211 100 Table E4-13. Respondents’ change in typical travel behaviour and mobility due to COVID-19 Change in Travel Behaviour or Mobility Lusaka (F) Lusaka (%) Kitwe (F) Kitwe (%) Yes (changed) 77 38 134 63.5 No Change (Same as it was Before) 124 62 77 36.5 Table E4-14. Respondents’ change in trip cost due to COVID-19 Change in Trip Cost Lusaka (F) Lusaka (%) Kitwe (F) Kitwe (%) Decrease / Increase 116 58 140 66 Same as it was before 85 42 71 34 Total 201 100 211 100 Table E4-15. Respondents’ change in occupation after COVID-19 Change in occupation Lusaka (F) Lusaka (%) Kitwe (F) Kitwe (%) No Change 170 84 199 94 Yes, Changed 31 16 12 6 Total 201 100 211 100 Table E4-16. Changes in household income due to COVID-19 Change in income Lusaka (F) Lusaka (%) Kitwe (F) Kitwe (%) Decrease 138 69 88 41.5 Increase 4 2 12 5.6 Stable 59 29 111 53 Total 201 100 211 100 111 FINAL REPORT: IMPACTS OF COVID-19 ON MOBILITY OF PHYSICALLY CHALLENGED PEOPLE AND OLDER PEOPLE Figure E4-1. Respondents’ trip cost in Lusaka and Kitwe city during COVID-19 and before COVID-19 0 10 20 30 40 50 60 70 K0-10 K11-20 K21-30 K31-40 K41-50 K51-60 K61-70 K71-80 K81+ K0-10 K11-20 K21-30 K31-40 K41-50 K51-60 K61-70 K71-80 K81+ Lusaka Kitwe % of Respondents Before COVID-19 Lockdown COVID-19 (post-lockdown) Prof. Dr. M. Shafiq-Ur Rahman Department of Urban & Regional Planning (URP) Jahangirnagar University Savar, Dhaka 1342, Bangladesh Tel: (+88) 01711398754 Email: shafiq_urp@yahoo.com Web: www.juniv.edu/teachers/shafiq_urp