
Overview
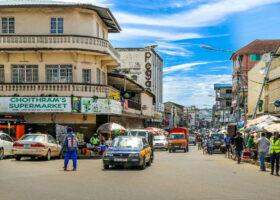
This study takes the concept of pop-up bicycle infrastructure, which developed in importance during the 2020-2021 COVID-19 pandemic in cities across the UK, Europe, and the US, and investigates the potential of applying these principles to user-led bicycle mobility interventions in Sub-Saharan African cities. Through engagement with the public sector, users, and civil society organisations in three SSA cities – Nairobi (Kenya), Kampala (Uganda), and Cape Town (South Africa) – the study considers the opportunities that rapid interventions, led by user-needs, might offer in these countries, but also the challenges and barriers that might be encountered in planning and implementation.
Publications with the same themes

Publications with the same study countries


Related news & events

News

Blog
Blog
News

News
News

Blog

News

Blog
PDF content (text-only)
FINAL REPORT: Learning from COVID-19 pop-up bicycle infrastructure: an investigation into flexible and user-led bicycle planning in Cape Town, Nairobi, and Kampala COVID-19 Response & Recovery Transport Research Fund March 2021 HVT029.L3M096 – Rahul Jobanputra, Gail Jennings This research was funded by UKAID through the UK Foreign, Commonwealth & Development Office under the High Volume Transport Applied Research Programme, managed by IMC Worldwide. The views expressed in this report are those of the authors and do not necessarily reflect the UK government’s official policies, nor those of any individuals and organisations referred to in this report. IMC Worldwide Ltd, the HVT Programme and the UK government shall not assume any responsibility for the results of works based on the use of this report. Users accept this publication is a guidance document only. Users accept that they need to take their own technical and legal advice before issuing Agreements, Terms and Conditions and other legally binding documentation related to implementing any recommendations. Reference No. HVT029.L3M096 Lead Organisation/ Consultant R Jobanputra Partner Consultant(s) G Jennings Title Learning from COVID-19 pop-up bicycle infrastructure: an investigation into flexible and user-led bicycle planning in Cape Town, Nairobi, and Kampala Type of document Project Report Theme Low carbon transport Sub-theme Technology and Innovation Author(s) Gail Jennings, Rahul Jobanputra, Constant Cap, Genevivie Ankunda, Seith Mugume Lead contact R Jobanputra Geographical Location(s) UK, South Africa, Kenya, Uganda Abstract This study takes the concept of pop-up bicycle infrastructure, which developed in importance during the 2020-2021 COVID-19 pandemic in cities across the UK, Europe, and the US, and investigates the potential of applying these principles to user-led bicycle mobility interventions in Sub-Saharan African cities. Through engagement with the public sector, users, and civil society organisations in three SSA cities – Nairobi (Kenya), Kampala (Uganda), and Cape Town (South Africa) – the study considers the opportunities that rapid interventions, led by user-needs, might offer in these countries, but also the challenges and barriers that might be encountered in planning and implementation. Keywords Sub-Saharan Africa; pop-up bicycle infrastructure; tactical urbanism Funding UKAid, FCDO Acknowledgements We gratefully acknowledge the input of our interviewees, survey respondents and stakeholders who provided information, insights and personal experiences. We also warmly thank Holger Dalkmann, Technical Lead on the IMC project team, for his committed involvement and considered insights. Cover Photo: Photographed by the author in Cape Town, January 2021 – a painted bicycle crossing, which did not follow cyclists’ desire lines, is painted over. Citation: Jennings, G, Jobanputra, R, Cap, C, Ankunda, G, Mugume, S (2021) Learning from COVID-19 pop-up bicycle infrastructure: an investigation into flexible and user-led bicycle planning in Cape Town, Nairobi, and Kampala. Project Report, COVID-19 Response & Recovery Research, UKAID through the UK Foreign, Commonwealth & Development Office, HVT Applied Research Programme i FINAL REPORT: Learning from COVID-19 pop-up bicycle infrastructure: an investigation into flexible and user-led bicycle planning in Cape Town, Nairobi, and Kampala CONTENTS Executive Summary vi 1. Project overview 1 1.1 Transport challenges being addressed by this research 1 1.2 Project objectives 3 1.3 Project scope 3 1.4 Proposed project outcome 4 1.5 Alignment with the HVT research themes, priorities, and programme objectives 4 1.6 Alignment with FCDO priorities 5 2. Method and approach 1 2.1 Literature review 1 2.2 Stakeholder consultation 1 2.3 Route assessment criteria 2 2.4 Research questions and data collection methods 5 2.5 Assumptions and limitations of this approach 5 3. Cycling policy and mode share in case cities before COVID-19 7 3.1 Cape Town, South Africa 7 3.2 Nairobi County, Kenya 7 3.3 Kampala, Uganda 10 4. Background and application of pop-up bicycle infrastructure during the pandemic 12 4.1 Tactical urbanism 16 4.2 Pilot, or demonstration projects 17 4.3 Attempts to implement pop-up infrastructure in case cities during 2020 17 5. Studies from case cities: Cape Town, Nairobi, Kampala 20 5.1 Cape Town 20 5.2 Nairobi, Kenya 24 5.3 Kampala, Uganda 27 6. Key findings and considerations 32 6.1 Learnings among case cities 32 6.2 Findings related to pop-up infrastructure: motivations and mode share 35 6.3 Findings related to existing road infrastructure 36 6.4 Acceptability of temporary infrastructure and poor enforcement 36 6.5 Institutional challenges: the case of Nairobi 39 6.6 Policy and regulatory environment: experiences, barriers 39 6.7 Opportunities to develop temporary interventions 40 6.8 Summary of stakeholder responses regarding route selection 43 7. Research uptake and next steps 44 7.1 Initial stakeholder dialogue 44 7.2 Continuing stakeholder dialogue 44 7.3 Research uptake 45 7.4 Project outputs (to date) 45 ii FINAL REPORT: Learning from COVID-19 pop-up bicycle infrastructure: an investigation into flexible and user-led bicycle planning in Cape Town, Nairobi, and Kampala 7.5 Project outputs (forthcoming) 45 8. Concluding reflections 46 References 47 APPENDICES Appendix A: Project schedule 52 Appendix B: Stakeholder questions (guide) 54 TABLES Table 1: Project alignment with HVT and SCDO themes and priorities 4 Table 2: Route selection matrix 4 Table 3: Research questions and data collection methods 5 Table 4: Examples pop-up bicycle lane installation outside Europe 13 Table 5: Summary of 2020 guidance for pop-up pedestrian and cycling facilities 14 Table 6: Cape Town: Assessment of proposed routes 21 Table 7: Number of lanes, road shoulder, presence of parking: proposed bicycle routes Cape Town 24 Table 8: Cape Town: Functional road classes and details 24 Table 9: Nairobi: Assessment of proposed routes 24 Table 10: Number of lanes, road shoulder, presence of parking: proposed bicycle routes Nairobi 27 Table 11: Kampala: Assessment of proposed routes 28 Table 12: Number of lanes, road shoulder, presence of parking: proposed bicycle routes Kampala 30 Table 13: Kampala: Functional road classes and details 30 Table 14: Cape Town: review of policy/ statutory requirements in relation to infrastructure provision 40 FIGURES Figure 1: Emergency bicycle lane in Bogota, Colombia, March 2020. 3 Figure 2: Social media commentary on Cape Town bicycle infrastructure prioritisation and siting 3 Figure 3: Bike-bus route from Khayelitsha, Cape Town, to the central city 4 Figure 4: Social media comment on the quality of bicycle infrastructure in Nairobi 8 Figure 5: Poor enforcement of NMT facilities ¬ the ‘shame of ‘grabbed’ walkways in Nairobi 9 Figure 6: Bicycle infrastructure development in Nairobi CBD 10 Figure 7: Bicycle activist Amanda Ngabirano cycles on Kampala's flagship bicycle pilot in the CBD 11 Figure 8: Examples of European cities adding pop-up bicycle lanes and other cycling interventions 13 Figure 9: City of Cape Town removal of a bicycle crossing point which did not follow cyclist desire-lines 16 Figure 10: Cape Town NGO describes attempt to reallocate road space for physical distancing 18 Figure 11: Concept drawing of pop-up lanes on Kiira Road, Jinja, Uganda 19 iii FINAL REPORT: Learning from COVID-19 pop-up bicycle infrastructure: an investigation into flexible and user-led bicycle planning in Cape Town, Nairobi, and Kampala Figure 12: Maps showing proposed network of pop-up lanes for Jinja, Uganda 19 Figure 13: Bicycle routes proposed by users in Cape Town (central Cape Town and metro South East) 23 Figure 14: Bicycle routes proposed by users in Cape Town Far South 23 Figure 15: Bicycle routes proposed by users in Nairobi, Kenya 27 Figure 16: Bicycle routes proposed by users in Kampala, Uganda 30 Figure 17: Social media post on pop-infrastructure applications 32 Figure 18: Western Cape provincial government opening a pedestrian bridge outside Cape Town 33 Figure 19: City of Cape Town removing bicycle lanes in Albert Road after complaints 34 Figure 20: Cartoon showing approach to space for cycle lanes In the Global North 35 Figure 21: Poor enforcement of painted bicycle lanes in Albert Road, Cape Town 37 Figure 22: Poor enforcement of walking and cycling facilities, Nairobi 37 Figure 23: A bicycle commuter describes her experience with painted bicycle lanes in Cape Town 38 Figure 24: Bicycle advocacy group in Cape Town calls for safer bicycle infrastructure 38 ACRONYMS COVID-19 Novel Coronavirus 2019 CCT City of Cape Town FCDO Foreign, Commonwealth & Development Office GKMA Greater Kampala Metropolitan Area HVT High Volume Transport Applied Research Programme IMC IMC Worldwide Ltd KCCA Kampala Capital City Authority LIC Low-income country NMT Non-Motorised Transport (walking, cycling, skateboarding, trolleypushing, etc); the terms Active Transport or Active Mobility are not commonly used in African cities to date. SSA Sub-Saharan Africa iv FINAL REPORT: Learning from COVID-19 pop-up bicycle infrastructure: an investigation into flexible and user-led bicycle planning in Cape Town, Nairobi, and Kampala DEFINITIONS AND TERMS USED NMS Nairobi Metropolitan Services (constituted by the Kenya Government to handle some of the functions of the Nairobi City County Government) boda-bodas Motorcycle-taxis (and sometimes bicycle taxis), a key mode of ‘public’ transport in Nairobi and Kampala, but non-existent in Cape Town. ‘flexible’, ‘provisional’, ‘temporary’, ‘emergency’, ‘infrastructure-lite’ or ‘pop-up’ bike lanes Temporary bicycle infrastructure includes signage, motorised lane removals, street closures, the removal of individual parking spaces or curb side, narrowing motor vehicle lanes, designating streets as local access only, or closing entire streets. Light separation is used for visibility such as spray paint, duct tape, jersey barriers, planters, posts, or delineators. There appear to be instances where the term ‘pop-up’ bicycle lanes are applied to infrastructure that is not developed as an emergency or even short-term, but that specifically requires only adjustments to existing roads rather than new build. accessibility ‘Accessibility is the umbrella concept to measure the ease of reaching a destination, whether it is a park in one’s neighbourhood or a job 30 km away. It can be variously measured in terms of the quality and performance of the transport network, access to transport, access to opportunities, or in terms of meaning of accessibility within people’s lives, and the consequent social outcomes.’ (1) bicycle transport In this report variously referred to as bicycle mobility, utility cycling, or simply ‘cycling’, but always refers to cycling as a means of transport, not recreation or sport. City Improvement District (CID) A City Improvement District (CID) also known as a Special Ratings Area (SRA) is a non-profit organisation operating within a defined geographic area within which property owners agree to pay a levy for supplementary and complementary services set to enhance the physical and social environment of the area guerrilla urbanism Unsanctioned, unauthorised, or unscripted urban practices. (2) lockdown According to Collins Dictionary 2020, lockdown is defined as ‘the imposition of stringent restrictions on travel, social interaction, and access to public spaces’ meaningful ‘access’ Cycling facilities can only effectively provide access if the intended beneficiaries have a ‘propensity to’ cycle, and where land-use patterns enable accessibility-by-bicycle in a meaningful way. The access and mobility provided by bicycle infrastructure must be meaningful: the intended beneficiaries must be able to ‘use’ this access to do with it what they really need to do. Meaningful access is more likely when there is a good mix of neighbourhood destinations, and shorter distances between origins and destinations (although people in SSA cities have been shown to be comfortable with longer distances). (3,4) v FINAL REPORT: Learning from COVID-19 pop-up bicycle infrastructure: an investigation into flexible and user-led bicycle planning in Cape Town, Nairobi, and Kampala paratransit ‘Paratransit’ refers to demand-driven, unscheduled public transport provided by small operators, typically in mini- to medium-sized buses. Paratransit is sometimes called ‘informal’, but operators are not always informal businesses, and they are not necessarily unregulated. Paratransit accounts for between 50-98% of passenger trips in SubSaharan cities. Paratransit vehicles are known by different names in different countries: dala dalas in Tanzania, danfos in Nigeria, matatus in Kenya and Uganda, trotros in Ghana, car rapides in Senegal, gbakas in Côte d’Ivoire, chapas in Mozambique, and ‘minibus-taxis’ in South Africa. (5) physical distancing As defined by the World Health Organisation (WHO) uses the term physical distancing and provides several guidance scenarios: • protect yourself and others from COVID-19 – physical distancing, wearing a mask, keeping rooms well ventilated, avoiding crowds, cleaning your hands, coughing into a bent elbow or tissue. • what to do keep yourself and other safe from COVID-19: maintain a distance of at least 1-metre; make wearing a mask a normal part of being around other people. • how to make your environment safer: avoid the 3Cs – spaces that are closed, crowed of involve close contact. • don’t forget the basics of good hygiene – hand washing, touching your eyes, nose and mouth, clean and disinfect surfaces. policy-transfer Policy-transfer does not refer to a specific policy or strategic document, but to knowledge about policies, administrative arrangements, institutions, etc, in one time and/or place is used in the development of policies, administrative arrangements and institutions in another time and/or place (6) Policy goals, policy content, policy instruments, programmes, institutions, technologies, ideologies, ideas, attitudes, and negative lessons, are all part of policy-transfer. (7) propensity to cycle Where intended beneficiaries are able to and wish to cycle as a transport mode. (3,4,8) tactical urbanism Tactical urbanism is either a city or a citizen-led, quick and affordable way in which to test and demonstrate change – it is an approach premised on using short-term, low-cost and scalable interventions as a way to catalyse long-term change’. (9) transport justice The provision of adequate transportation to every one [not only those who drive], and thereby the mitigation of the social disparities and inequities that have been created over the past decades. (10) transport poverty/ exclusion The systemic denial of mobility resources sufficient to access daily life-supporting activities … upon already socially disadvantaged or vulnerable individuals and communities.1 1 Source: Karen Lucas, webinar, 12/11/2020 vi FINAL REPORT: Learning from COVID-19 pop-up bicycle infrastructure: an investigation into flexible and user-led bicycle planning in Cape Town, Nairobi, and Kampala EXECUTIVE SUMMARY Purpose Lockdown and post-lockdown COVID-19 transport constraints by governments in Sub-Saharan African (SSA) cities during 2020 focused on road and rail-based public and paratransit transport, with curfews, movement restrictions, and physical distancing requirements; these resulted in reduced trip frequencies, reduced vehicle capacity, and ultimately longer wait times at paratransit and public transport stops. By all accounts, walking took on even greater importance as a transport mode in SSA cities, as transport fares increased and incomes reduced. (11) During these lockdowns, movement patterns were almost entirely disrupted. Even after initial lockdowns early in 2020, once more extensive travel/movement was permitted and markets were opened, people continued to work from home or online where possible; larger gatherings were prohibited, schooling and other education travel was intermittent, curfews were enforced, and many businesses remained closed. Emergency or pop-up bicycle lanes, although installed elsewhere, did not feature in SSA by the time of publication (February 2021), although they could have served purposes of physical distancing and mitigated the need for crowded public transport; if appropriately situated they could have increased the meaningful options2 available to commuters as they returned to work. Described variously in this report as temporary, flexible, agile, or infrastructure-lite, pop-up bicycle lanes are a tactical urbanism intervention whereby vehicle road space is rapidly reallocated to bicycle traffic, for certain periods of the day or all day, using paint or temporary and moveable delineators such as bollards, barriers, or planters. During the pandemic, these measures were largely implemented due to emergency regulation and an increased ‘tolerance for experimentation’. (12) Tactical urbanism and piloting are not approaches readily used in SSA cities to date. The reason why these have not been considered in SSA cities as a response to transport needs is investigated in this research, especially as several technical resources and design guides exist about how to plan, choose materials for, install, or adjust such projects. While the opportunity presented by the initial lockdowns for the implementation of pop-bicycle infrastructure has passed, there is value in investigating the opportunities presented by temporary or flexible bicycle infrastructure, particularly in resource-poor countries with low levels of cycling but with multiple demands for safer, affordable mobility options. Such interventions are one of a basket of tactical urbanism tools – approaches that use relatively quick and affordable ways in which to test and demonstrate change, then review and revise before resources are committed to a project. These low-cost and scalable interventions are also able to catalyse long-term change (9), and draw on local knowledge to ensure that users’ mobility needs are met. This study takes the concept of pop-up bicycle infrastructure and investigates the potential of these principles to develop priority routes for bicycle travel in three case cities in SSA – Cape Town (South Africa), Nairobi (Kenya), and Kampala (Uganda). Method To achieve the study’s aims, we reviewed literature on bicycle promotion in low-cycling countries, and bicycle master planning and network design. We concluded that a network development approach that includes the principles of transport justice/inclusion and accessibility was most appropriate in the case cities with historic spatial inequity. As the cost of persuading people to take up cycling as a mode is significant, we also determined that a focus on people who already exhibit a propensity to cycle was most likely to achieve demonstrable success. 2 Refer to Definitions vii FINAL REPORT: Learning from COVID-19 pop-up bicycle infrastructure: an investigation into flexible and user-led bicycle planning in Cape Town, Nairobi, and Kampala To determine routes and understand the challenges and barriers that might be encountered in planning and implementing flexible interventions, we engaged stakeholders in the public sector, bicycle commuters, and civil society organisations in these three cities, and assessed responses by means of a matrix to identify the preferred routes. In Cape Town, in-depth interviews were conducted with 10 individuals, and we drew further on both scholarly and practitioner route-mapping exercises that together represented input from more than 100 bicycle commuters3 . In addition to individual interviews (five per city), online questionnaires were completed by 146 stakeholders in Nairobi and 129 in Kampala. We also reviewed transport policy and strategy, to determine whether there existed an enabling environment or stumbling blocks in case cities toward installing temporary interventions. The study also reflects on the city- and country-specifics that mean policy-transfer (see Definitions) of global practice is never a straightforward matter, and why pop-up infrastructure was not a self-evident intervention during 2020. Findings Findings are presented in terms of: Learnings among case cities: overall, Cape Town exhibits a less enabling environment than do Nairobi and Kampala, with a battery of policy, strategy and other documentation that can serve to gatekeep user-led approaches to bicycle planning, and that limits agility and openness to change. Both Nairobi and Kampala are at an earlier phase of bicycle activism, where authorities are less set in their approach and where there is more opportunity to influence the way forward. In particular there is an opportunity for other LICs to learn from Cape Town’s experiences with its relatively static bicycle master planning, approach to stakeholder engagement, and infrastructure design and implementation, and instead use tactical urbanism approaches to demonstrate change, test and revise, before resources are committed to projects. Findings related to pop-up infrastructure – motivations and mode share: from the work undertaken in this study, it is not difficult to see why pop-up bicycle infrastructure was not readily considered in the case cities. Where pop-up infrastructure was developed outside SSA, in many instances cities were fast-tracking plans that already existed: this highlights the importance of pilots and plans that are ready for action. Further, walking mode shares in SSA cities are substantially higher than those in EU cities and other cities where pop-up infrastructure was developed (mostly); thus where emergency infrastructure might have been proposed, the primary beneficiaries would have needed to be pedestrians. In addition, pop-up facilities for walking and cycling were seized upon as opportunities for unprecedented public health interventions elsewhere, with a focus on the ‘active’ nature of these modes; in African cities, on the other hand, there are already high levels of walking, with their own set of public health challenges, and narratives to increase walking and cycling focus more on their potential for congestion mitigation and poverty-alleviation than on their physical activity. Findings related to existing road infrastructure: in all three case cities, the lower order road infrastructure (in most instances where people choose to cycle as direct routes) is largely one lane (in each direction), with marginal road shoulders and limited road reserves; higher order roads are dual two- or three lanes. Few have the available space that would enable bicycle infrastructure to be installed without substantial political will and demonstration of value (whether in terms of cost, lives saved, air quality, climate impact, mode shift, etc). Pop-up demonstration facilities or pilots are able to provide some of this evidence (or not). Acceptability of temporary infrastructure and poor enforcement: a challenge is that while there are low levels of acceptance of infrastructure-lite facilities – because of both enforcement and safety concerns – these interventions are provided for in official guidelines and are an obvious tactical urbanist approach. Painted lanes, within urban contexts of poor enforcement and high road safety risks (speed, driver behaviour, driving while affected by alcohol), may have greater value as temporary, proof-of-concept interventions, and with careful monitoring and evaluation, lead to more permanent, more acceptable solutions. Overwhelmingly, the 3 There are possibly some current 10 000 utility cyclists in Cape Town (13) viii FINAL REPORT: Learning from COVID-19 pop-up bicycle infrastructure: an investigation into flexible and user-led bicycle planning in Cape Town, Nairobi, and Kampala reasons given by activists and cyclists in their calls for segregated facilities is because they offer protection from motorised traffic. Stakeholder perspectives: commuter cyclists choose direct routes, not necessarily quiet, ‘safer’ roads; and commuter cyclists routinely ride distances longer than the 5-8 km that is drawn from international good practice guidelines. Despite a vocal social media presence of cyclists opposed to infrastructure-lite (see above), there are many commuter cyclists willing to ride without the best-practice segregated facilities recommended in guidelines; commuter cyclists are willing to share road space with mixed traffic despite speed differentials that are higher than those recommended in guidelines. This echoes work conducted elsewhere in SSA, which shows that a lack of cycling infrastructure does not necessarily hamper cyclists who travel, and that a high percentage of utility cyclists travel distances more than 15 km one way. Route proposals and approaches: pop-up bicycle infrastructure does not need to comprise Class 1 or segregated facilities; design guidelines do exist in South Africa and Uganda for shared facilities, but not for any temporary barriers or separation; this Report recommends that such guidelines be developed and approved. Such interventions would require some measure of applying the steps outlined in Table 5. Bicycle infrastructure and BRT: Both Nairobi and Kampala, and other LIC cities, are considering BRT services; a learning from Cape Town is that it is not necessarily the right approach to use an expedient opportunity such as BRT to ‘add on’ bicycle infrastructure, just because there is funding or ‘space’. If infrastructure is of exemplary standard but in areas that current cyclists do not travel, or in remote areas that are not safe, the bicycle lanes cannot be seen as worthwhile investments. Attempts to divert cyclists from their desire lines are rarely successful, and the cost of marketing unpopular routes should not be discounted. Overall, this Report suggests that pop-up infrastructure, based on user-needs, could draw attention to measures that are lighter, quicker, and cheaper to implement, and that can be trialled and quickly reallocated or moved if they have unintended adverse impacts or could be better implemented elsewhere. When the focus is on current users and those with an evident propensity to ride, ahead of attracting entirely new users, the high cost of marketing and persuasion is reduced – at the same time, an increase in cycling on one route is likely to raise awareness and contribute to increases in cycling overall. A challenge is that bicycle lanes and their installation have become contested interventions in resource-poor cities, and their legitimacy is questioned, but infrastructure-lite interventions have low user acceptance in terms of road safety and are poorly enforced. Trialling user-proposed routes with light-touch infrastructure, using context-specific planning principles together with local stakeholders, may give decision-makers confidence to develop accepted routes – and thereby avoid delegitimising bicycle travel through backtracking, and limit the rhetoric around unused facilities or mis-directed resources. Where emergency regulation has no doubt facilitated more agile regulation during COVID-19 – and played a key role in the ability of cities to install emergency infrastructure – this same rapid regulatory approach has given birth to backlashes against ‘control’ by governments of citizens, and the abrogation of rights. This is a delicate path to be negotiated. Increasing the share of bicycle transport, and making bicycle travel safer, is the stated goal in a growing number of cities in LICs – whether to meet climate goals, improve air quality and congestion, or to attend to poverty alleviation. Pop-up bicycle facilities that function as carefully designed pilots are able to assist cities meet these goals and targets, through the collation of evidence to motivate and support both political and technical decision-making. 1 FINAL REPORT: Learning from COVID-19 pop-up bicycle infrastructure: an investigation into flexible and user-led bicycle planning in Cape Town, Nairobi, and Kampala 1. Project overview 1.1 Transport challenges being addressed by this research In South Africa, Kenya, and Uganda, the COVID-19 containment responses – in terms of transportation – began in March 2020 and focused mainly on public transport and paratransit4 , the mainstay of travel in SubSaharan Africa (SSA). Governments directed their efforts toward attempting to regulate public transport capacities, and in South Africa proposing complex ‘peak-flattening’ measures and costly facilities cleansing – largely failing in these attempts, and conceding in some eventualities to full-capacity paratransit despite other lockdown constraints still being in place. (14) Measures initially included curfews and restricting all movement other than for essential workers and for essential travel, and then reducing vehicle capacities (between 50-70% capacity) and developing physical distancing, sanitising, mask-wearing, and ventilation protocols for all travel. These interventions by and large followed good practice recommended globally as well as specifically for SSA. (15) At the time of writing (February 2021), curfews, capacity restrictions, masks, sanitising, and ventilation requirements remain. Governments at the same time paid scant attention to non-motorised alternatives to public transport, such as walking and cycling. Although neither explicitly encouraged nor singled out for restriction other than in terms of trip purpose5 and curfews, walking appears to have increased in importance as a means of travel in African cities during this time (11,16) – largely because of cost6 , reduced transport options, and greater opportunities for physical distancing. In a survey7 conducted by UN Environment Share the Road Programme, Walk 21 Foundation, and UK Aid / High Volume Transport, to investigate walking and cycling changes during 2020 throughout Africa, respondents reported limited actions to make cycling safer during the pandemic; where actions did take place, these had already been planned pre-COVID-19 (in line with this Report’s findings). Physically distanced public transport was still perceived by the majority of respondents as the safest way for people to travel during COVID-19 (42.9%). (16) Bicycle transport8 offers the same benefits as walking in terms of physical distancing, yet, like walking, was neither subject to specific regulations nor actively encouraged in any practical, meaningful way. (17–19) The media reported an increase in interest in cycling as a mode of transport in all three case cities, (20,21) although we have been unable to find systematic surveys or detailed data collection to verify these claims. In South Africa, during the March–April 2020 lockdown, walking and cycling were expressly prohibited as exercise; while limitations on private and public transport modes were described in the transport regulations, no mention was made of utility walking and cycling. The Western Cape Government, for example, directed that utility cycling was prohibited alongside sport, and that walking was permitted only if you did not drive: ‘Only bus services, taxi services (including minibus-taxis), e-hailing services and private motor vehicles may be used to travel for these purposes during the lockdown. If you do not have a vehicle you are allowed to walk to purchase essential goods.’9 Cycling as transport was even regarded as an attempt to circumvent exercise regulations in South Africa. (14) This despite the World Health Organization (WHO) recommendation that, wherever feasible, one should ‘consider riding bicycles or walking’ as the main way in which to move around during the COVID-19 outbreak, (22) and the hope among the SSA bicycle advocacy sector that the pandemic 4 ‘Paratransit’ refers to demand-driven, unscheduled public transport provided by small operators, typically in mini- to medium-sized buses, and accounts for between 50-98% of passenger trips in Sub-Saharan cities. (5) The terms public transport and paratransit are to some extent used interchangeably in this report, as the majority of ‘public’ transport is in fact paratransit. 5 In South Africa walking was prohibited as a form of exercise in the first five weeks of lockdown, and for a further month as exercise other than during a 6am-9am time-slot. (14) 6 Lockdowns had significant impacts on loss of livelihoods in SSA. 7 This cites the survey report as it stands in December 2020; the report is not yet in final publication form. 8 In this report variously referred to as bicycle mobility, utility cycling, or simply ‘cycling’, but always refers to cycling as a means of transport, not recreation or sport. 9 Western Cape Government communication reference 200402-002018. 2 FINAL REPORT: Learning from COVID-19 pop-up bicycle infrastructure: an investigation into flexible and user-led bicycle planning in Cape Town, Nairobi, and Kampala could catalyse a shift toward less motorised and congested African cities. (19,23) New utility cyclists and pedestrians were shamed on social media for ‘trying to find various ways to disobey’ the regulations. As a sustainability journalist wrote in response to people ‘going for walks, cycles, or runs [to the shops]’: ‘the more loopholes you find and use, the longer it will take us to deal with this pandemic, and the longer we will suffer’.10 One of South Africa’s professional cyclists even stated that ‘no one in SA rides to do shopping, so they shouldn’t start now’.11 (14) In Uganda, while the president was reported as saying bicycle travel was safer than public transport during the pandemic, (18) no specific temporary facilities were developed for this mode; a 1.95 km, 2-3m wide segregated bicycle lane and pedestrian facility in Kampala’s CBD, shared on social media (18) as a COVID-19 intervention, was unable to impact mobility significantly because of its short distance, and had been planned as a showcase project as early as 2013. Yet globally, bicycle mobility had been promoted as a particularly safe high-volume, low-carbon means of travel, in terms of physical distancing protocols. Although pop-up bicycle facilities became increasingly visible in cycling exemplar European cities and a number of US and Latin American cities, these are almost entirely absent in SSA cities. (17) Bicycle mobility enables effective physical-distancing with a reduced need for enforcement. While bicycle travel in SSA cities is a minor mode in SSA (at between 0.5-3% of trips), (24) this is not because there is no latent demand – utility cycling is a stated policy direction in most SSA countries – but because bicycle promotion measures have fallen short, and infrastructure development is frequently contested and, when developed strictly in accordance with guidelines, is a lengthy, costly, and at times contested process. (25–28) This study investigates routes that could have served as pop-up bicycle routes during 2020 and suggests that there is value in applying the principles of agile, pop-up infrastructure to bicycle network planning going forward. Bicycle lanes and their installation have become contested interventions in resource-poor cities, and their legitimacy has been questioned. (29–34) Lighter, quicker measures, that are cheaper to implement and that can be trialled and quickly re-allocated or adapted, will be able to provide early evidence of impact and success, and bolster political and budgetary support for longer-term adoption. The study also reflects on the city- and country-specifics that mean policy-transfer (see Definitions) of global practice is never a straightforward matter, and why pop-up infrastructure was not a self-evident intervention in SSA cities during 2020. 10 Facebook (author name known), 27 March 2020 11 Twitter (author name known), 27 March 2020 3 FINAL REPORT: Learning from COVID-19 pop-up bicycle infrastructure: an investigation into flexible and user-led bicycle planning in Cape Town, Nairobi, and Kampala Figure 1: Emergency bicycle lane in Bogota, Colombia, March 2020. Source: WRI.org 1.2 Project objectives This study takes the concept of pop-up bicycle infrastructure, which developed in importance during the 2020-2021 COVID-19 pandemic in cities across the UK, Europe, and the US, and investigates the potential of applying these principles to user-led bicycle mobility interventions in Sub-Saharan Africa. Through engagement with the public sector, users, and civil society organisations in three SSA cities – Nairobi (Kenya), Kampala (Uganda), and Cape Town (South Africa) – the study: • puts forward routes for immediate bicycle mobility interventions, based on bicycle user engagement and policy review; and • considers not only the opportunities that rapid interventions, led by user-needs, might offer in these countries, but also the challenges and barriers that might be encountered in planning and implementation. 1.3 Project scope 1.3.1 Initial project intention The original project proposal to which this Report responds was drafted during early phases of lockdown easing in SSA (8 June 2020). The intention was to identify bikeable, high-volume priority routes for returning workers in Kampala (Uganda) and Nairobi (Kenya), with Cape Town (South Africa) as an initial proof-ofconcept, and to develop quick-win interventions such as pop-up bicycle lanes, for possible implementation by the relevant transport authorities. Through engagement with users and decision-makers, this study intended to investigate bicycle mobility routes that already had high levels of interest by users in the three project cities, and that offered meaningful origin-destinations within a distance acceptable to potential beneficiaries. The study would then propose quick-win interventions that could provide greater levels of protection than cyclists in these cities currently have (bicycle infrastructure is notoriously poor quality, or non-existent), (25,27) and that could offer the opportunity for rapid evaluation and possible long-term entrenchment. After proposal evaluation and procurement processes, the research grant was awarded in October 2020, by which time project cities had re-opened economies, and movement constraints had, by and large, been lifted. The urgency of pop-up bicycle lanes had waned – and similar infrastructure elsewhere that served emergency purposes was being dismantled. Although SSA cities have experienced more devastating ‘second waves’ of 4 FINAL REPORT: Learning from COVID-19 pop-up bicycle infrastructure: an investigation into flexible and user-led bicycle planning in Cape Town, Nairobi, and Kampala infection, SSA economies are insufficiently resilient to contend with further hard lockdowns, and at the time of writing (February 2021), these have been avoided. 1.3.2 Revised project intention In the light of the above, and in keeping with the rapid nature of flux during 2020, this study shifted focus (in consultation with the IMC project team and technical advisor Holger Dalkmann) to follow the proposed project steps (including identifying which bicycle routes are used or preferred by users/stakeholders) but to pay greater attention to understanding the current policy positions regarding temporary bicycle lanes and flexible pilots in the project cities, and negotiating the regulations and processes required to implement and pilot them. The project purpose is not to design and implement pop-up interventions. The project initially intended to develop a ‘tool-kit’ of how to plan and develop flexible or pop-up interventions; however, subsequent to our project proposal, a number of such tool-kits have been developed and published, two of which in particular focus on the Global South – mostly India and Colombia. A summary of this guidance can be found in Table 5. (8,9,35,36) In line with FCDO priorities, the emphasis is on the low-income project countries: Uganda and Kenya. This work speaks to an expressed need among transport practitioners for honest lessons-learned and contextspecific policy transfer; (37) these need not necessarily be COVID-19 specific, but have climate, resourcing, and stakeholder engagement value in the long term. 1.4 Proposed project outcome Although the opportunity presented by the initial lockdowns in early 2020 for the implementation of popbicycle infrastructure has passed, there is still value in investigating temporary or flexible bicycle infrastructure, particularly in resource-poor countries with current low levels of cycling but with multiple demands for safer, affordable mobility options. Such interventions are relatively quick and affordable ways in which to test and demonstrate change, then review and revise before resources are committed to a project. Rapid response routes could range from the reallocation of street space to active forms of travel, or the use of signage, reduced speeds, and other interventions. They are also ways in which to draw on local knowledge to ensure that users’ mobility needs are met. This study therefore moves beyond the immediacy of COVID-19 response and recovery, to also understand current policy positions regarding temporary bicycle lanes and flexible pilots. The study reflects on the cityand country-specifics that mean policy-transfer (see Definitions) of global practice is never a straightforward matter, and why pop-up infrastructure was not a self-evident intervention during 2020. Both the literature and stakeholder engagement suggest that in SSA cities, pilots (in terms of bicycle or other tactical street interventions) are seldom used to rigorously document usage, shape change, and share lessons. (27,37) This research could be taken forward by both advocates and decision-makers and provide support to civil society in making the case for lower-cost, rapid or pilot bicycle route interventions; this delivers the opportunity for rapid yet evidence-based evaluation, and possible long-term entrenchment with more permanent infrastructure. 1.5 Alignment with the HVT research themes, priorities, and programme objectives Table 1: Project alignment with HVT and SCDO themes and priorities HVT Research Priority Response Climate change mitigation and adaptation Promotion of bicycle transport as a competitive to poorquality public transport (air quality concerns in particular). 5 FINAL REPORT: Learning from COVID-19 pop-up bicycle infrastructure: an investigation into flexible and user-led bicycle planning in Cape Town, Nairobi, and Kampala HVT Research Priority Response Inclusion, gender, and road safety Bicycle users are particularly vulnerable as road users, and this work investigates the challenges to infrastructure-lite approaches in terms of road safety gains. Policy and regulation (including engineering) The research investigates policy and regulation positions of LICs in respect of temporary changes to transport infrastructure and possible changes needed to facilitate the proposals made to modify infrastructure, including engineering (where appropriate). Technology and innovation (including data and decision support systems) The focus on the value on stakeholder engagement and citizen-led involvement in decision-making rather than a reliance on quantitative data (understanding latent demand). Research uptake and capacity building The research has been undertaken with local transport practitioners in Kenya and Uganda and includes the use of additional resources in these cities by others where needed. Stakeholder capacity building in LIC cities has also been undertaken in terms of the introduction of the ‘new concepts’ and possibilities proposed by this research. 1.6 Alignment with FCDO priorities In terms of alignment with FCDO’s priorities, HVT’s website (38) states that: ‘The research areas to be investigated under the HVT programme are closely aligned to FCDO priorities such as strengthening global peace, security and governance, promoting global prosperity, tackling extreme poverty and helping the world’s most vulnerable. ‘Not all groups and communities have equal access to services and opportunities, even when infrastructure is improved. Ensuring that the most marginalised have increased access to opportunities is a key principle of FCDO’s priority to leave no-one behind. The HVT programme undertakes to implement research projects in fragile or conflict-affected states to improve opportunities for the most vulnerable.’ 1 FINAL REPORT: Learning from COVID-19 pop-up bicycle infrastructure: an investigation into flexible and user-led bicycle planning in Cape Town, Nairobi, and Kampala 2. Method and approach An investigation in Cape Town, Nairobi, and Kampala was undertaken by a local project team member in each city. In keeping with government restrictions (local and international), the project was carried out using online engagement, and relied on both primary and secondary data, and observations and insights provided from indepth interviews and survey information from stakeholders within the public, private, and civil-society sector. Physical on-street observations as well as Google Street View observations were conducted along the proposed corridors. A copy of the proposed original work plan is included in Appendix A. Highlights from this work plan are provided in the text below. 2.1 Literature review This Report combines a literature scan of journal papers, policy reports and infrastructure guidelines, as well as social media and newspaper articles. We focused our attention on literature concerning bicycle promotion in low-cycling countries; bicycle master planning, infrastructure design, and network development; and approaches to transportation provision in cities that reflect inequitable access and mobility. In terms of infrastructure guidance, we considered case city-specific infrastructure manuals, and tool-kits concerning pop-up infrastructure and tactical urbanism, published within the last years. We concluded that a network development approach that includes the principles of transport justice/inclusion and accessibility, was most appropriate in the case cities with their particular colonial- and apartheid-based spatial inequities. 2.2 Stakeholder consultation In Cape Town, in-depth interviews were conducted with civil society organisations including the Bicycling Empowerment Network, Open Streets Cape Town, Future Cities Cape Town, The Greater Tygerberg Partnership, City Improvement District (CID) officials, political party groups, individual researchers, academics, facilitators of ‘bike-bus’ commuter groups (some of which represent close to 100 commuters on a particular route), and Khaltsha Cycles, as well as individuals who work in bicycle advocacy and who have themselves conducted engagement regarding potential interventions and who have mapped preferred routes. A number of interviewees spoke on condition of anonymity. In Nairobi, 146 cyclists responded to an online questionnaire (using Google forms, and distributed by means of stakeholder WhatsApp groups). Respondents included individual cyclists and members of organised cycling groups. Online interviews were conducted with stakeholders from different organisations that have an interest in this field, including academics, representatives of Safer Cities Nairobi Initiative (a collaboration between UNHabitat and Nairobi City County), Institute for Transportation and Development Policy (ITDP), and the Flone Initiative (an organisation that focuses on inclusive public and non-motorised transport). In Kampala, 129 respondents completed a google-form questionnaire. In-depth interviews through online platforms, telephone conversations and face to face interactions were conducted with policy makers and NGOs, for example ITDP, the Uganda Ministry of Works and Transport (MoWT), Training, Education & Empowerment for Neighbourhood Sustainability (TEENS), Uganda National Urban Forum, and the Uganda Sustainable Transport Network. 2.2.1 Bilateral interviews Interview guidance is included as Appendix B, Stakeholder Questions. These questions were aimed at uncovering and understanding traffic congestion levels, identifying origins and destinations, and the propensity to cycle among target audiences and within proposed routes. Questions also centred on any attempts undertaken among stakeholders to implement agile bicycle interventions or tactical urbanism projects, the challenges encountered, and possible direction for greater likelihood of success. 2 FINAL REPORT: Learning from COVID-19 pop-up bicycle infrastructure: an investigation into flexible and user-led bicycle planning in Cape Town, Nairobi, and Kampala 2.2.2 Online surveys Online survey forms were developed by the project team, and further customised for the context of cycling in Kampala and in Nairobi. The questionnaire was validated by a number of independent consultants before being widely circulated on social media platforms such as WhatsApp, LinkedIn, and email. The surveys were not conducted in Cape Town. Our stakeholder engagement asked questions firstly (i) to establish where cyclists travel, and secondly (ii), to answer questions about the proposed routes in a route selection matrix to determine the most meaningful opportunity to implement ‘quick-win’ and permanent bicycle infrastructure: Our stakeholder surveys and questions asked: • Where should bicycle lanes be best positioned in Nairobi/Kampala for impact now and/or in the short-term future? • On what routes are there current volumes (pre- and during COVID-19) of people cycling as a mode of transport? • If you were to suggest temporary or trial bicycle lanes that serve your cycling needs, on which roads would you suggest them? In Kampala and Nairobi, quantitative statistical analysis of the responses obtained from the online surveys was undertaken using MS Excel to determine vital cycling statistics based on the sample size received. The responses were used to help identify the priority routes for bicycle pop-up infrastructure in both Kampala and Nairobi. 2.3 Route assessment criteria In the UK, Lovelace, Talbot, Morgan and Lucas-Smith (8) developed a method to prioritise pop-up ‘active transport infrastructure’ which they titled the Rapid Cycleway Prioritisation Tool. Here the focus was on road space reallocation specifically where cities had ‘spare space’ along continuous road sections that have high latent cycling demand. The Tool was deployed in cities in England to help prioritise emergency funds for new cycleways nationwide. High latent demand was analysed by means of the authors’ previously developed Propensity to Cycle Tool, (39) and considered matters such as road speed, trip purpose, land use, road width, the number of lanes on a road, etc. and data derived from OpenStreet Map. The authors were concerned, however, that their tool relied on data rather than on community engagement, and that it was thus rather ‘top-down’. Longer-term network master planning generally relies on analysis of much the same variables as the Rapid Cycleway Prioritisation Tool, but with a focus on feasibility of infrastructure development and latent demand ahead of evident or stakeholder demand and community engagement, or even current usage12. Key decisionmaking variables instead focus on the presence and type of on-street parking, posted speed limits, traffic demand volumes and road geometry, link geometry (road shoulders, sight distances, slope, pinch points turning lanes, etc), intersection geometry, and kerbs. In the SSA context, destinations are assumed to be education facilities, shopping centres, business districts and public transport interchanges, and origins assumed to be places of residence (most often, high-density areas). A ‘build-it-and-they-will-come’ assumption often prevails, and lack of user data, stakeholder engagement, or pilot evaluation, is a concern. (27,40–42) Spatial multi-criteria analysis (SMCA) may benefit route selection processes, (41) as this, according to proponents, is more able to attend to conflicting objectives among various stakeholders; an SMCA model proposes that the result – a high-level strategic identification of route choices – should be followed up by detailed analysis, to ensure compliance with standards where possible. Proxies (and a proxy guideline) are 12 Interviews conducted December 2020, transcribed by the author 3 FINAL REPORT: Learning from COVID-19 pop-up bicycle infrastructure: an investigation into flexible and user-led bicycle planning in Cape Town, Nairobi, and Kampala recommended when data is not available. Directness (shortest distance possible) is identified as one of the more essential qualities of a cycle route for commuters, above attractiveness and coherence. Concepts such as context-sensitive multi-modal road planning in African cities include additional decisionmaking factors related to adjacent land-use, the socio-economic characteristics of the population served by the road, and the environment context within which the road is situated; (43) this method, however useful, reflects primarily on the suitability of routes already identified, rather than identifying routes themselves. (41) Bicycle planning is beset then by a curious mix of insufficiently nuanced attention to latent demand but a neglect of actual usage. Research prepared in Cape Town in 2020 (13) is of the view that the strategies of starter cycling cities (a concept that would include our case cities) often do not sufficiently acknowledge the ‘nature, quantum or location of potential demand for cycling’. But given the absence of revealed data to describe distinguishing characteristics of utility cyclists in Cape Town, and thereby a difficulty in estimating demand, authors Hitge and Joubert (13) propose a model that uses travel behaviour theory as the basis for understanding who is more likely to cycle than others. A challenge, however, is that there is equally a dearth of travel behaviour insight for cyclists in African cities, other than work that focuses on the even more marginal group of middle-class utility cyclists, who own their own vehicles but choose to ride. While a data-driven approach to estimating the potential market for cycling has value, in SSA cities there is frequently a lack of data, thus local knowledge and community engagement and needs are more insightful proxies than the road speed, street lighting or road class usually proposed. (41) It may also be that prominent corridors are indeed where cyclists do wish to travel, which emerges as the case in our case cities because of route directness. Further recent research conducted in SSA also suggests that stakeholders are rarely adequately included in the identification of optimal routes, and that methods for route selection are insufficiently open and transparent (41) – leaving stakeholders dissatisfied and bicycle lanes unused in favour of travelling with mixed road traffic instead. Cape Town in particular has drawn criticism for developing bicycle infrastructure in wealthy areas, viewed primarily as recreational interventions, rather than in areas where people ride as transport. (40) Figure 2: Social media commentary on Cape Town bicycle infrastructure prioritisation and siting ‘This is the skewed spending crap that wakes me up in the morning and has me active in advocacy.’ Source: Twitter, 2 February 2021 In the light of the above, local knowledge is therefore the primary data on which bicycle routes were assessed for this study. In addition, we applied a ‘bicycle justice’ filter to the route proposals, to ensure that routes attend to user needs rather than straightforward ‘feasibility’. Particularly in cities with a legacy of spatial and transport inequity through colonial and apartheid policies, the provision of transportation and allocation of road space must serve to redress transport inequity and exclusion (see Definitions, above), and offer accessibility (see Definitions) above mobility. Bicycle justice scholars caution that many assumptions underlying arguments for bicycles as pro-poor or socially just ‘have been left unexamined’, (3,34) and suggest that the degree to which bicycling infrastructure advances transport inclusion is unclear. For a bicycle programme to serve the needs of users it must ensure inclusive participation and grassroots advocacy; invest in existing communities; recognise and plan for the diversity of cyclists and cycling travel patterns and uses, and integrate cycling into broader community development processes. (4,34) The access and mobility provided by bicycle infrastructure must be meaningful: the intended beneficiaries must be able to ‘use’ this access to do with it what they really need to do. (1,3,4) Cycling can only effectively serve as an attractive, rapid ‘physical-distancing’ mode if the intended beneficiaries are already able to and wish to (have a ‘propensity to’) cycle. Cities that installed pop-up infrastructure elsewhere in 2020 had substantially higher bicycle mode shares than do SSA cities. There are many barriers that prevent people from cycling in SSA cities as a transport mode, and lack of infrastructure is 4 FINAL REPORT: Learning from COVID-19 pop-up bicycle infrastructure: an investigation into flexible and user-led bicycle planning in Cape Town, Nairobi, and Kampala merely one of them – although also evidently not a barrier for the many who do ride. (28,44) But an existing desire to cycle is key, and not necessarily highly prevalent in SSA cities. (34,45) For these reasons, our study focuses on current cyclists, or where there are indications of a propensity to ride. Decision-making for rapid interventions that offer limited segregation from traffic require a focus on actual demand ahead of latent demand, rather than involving the lengthy, costly and not always successful attempts to create bicycle commuters from among a population aspiring to better quality motorisation. (13,34,40,45,46) Understanding and meeting the needs of existing cyclists will go some way toward developing a successful strategy to grow the mode, as case city strategies do recognise. Table 2, below, indicates our route selection matrix, showing assessment indicators, including rationale for use, and method of assessment Figure 3: Bike-bus route from Khayelitsha, Cape Town, to the central city Source: Social media, February 2020 Table 2: Route selection matrix Indicator Definition/ Rationale for use Method of assessment Propensity to cycle Cycling facilities can only effectively provide access if the intended beneficiaries are able to and wish to (have a ‘propensity to’) cycle, and where land-use patterns enable accessibility-by-bicycle in a meaningful way. (3,4,47) Stakeholder interviews, literature review, policy review, observation, bicycle availability/bicycle distribution projects, bicycle organisations Meaningful access The access and mobility provided by bicycle infrastructure must be meaningful: the intended beneficiaries must be able to ‘use’ this access to do with it what they really need to do. (3,4,47,48) Stakeholder engagement Congestion mitigation If bicycle travel is to serve as able to relieve pressure on public transport, with its reduced carrying capacity during COVID-19 Peak travel data (See travel data Project Report L3M192) 5 FINAL REPORT: Learning from COVID-19 pop-up bicycle infrastructure: an investigation into flexible and user-led bicycle planning in Cape Town, Nairobi, and Kampala Indicator Definition/ Rationale for use Method of assessment restrictions (9,22,49,50); Project Report L3M192 Scalability and acceptability A good pilot, or temporary facility, is that it be scalable, should it be successful; and it is more likely to be successful if it has been planned with maximum acceptability to and consultation with all relevant stakeholders Stakeholder engagement, Strava commuter data, bike-bus map routes, policy, network and master plan reviews Ease of implementation The key to pop-up facilities, even if serving as a pilot, are that they are relatively low-cost, and have a shorter time-frame from conception to implementation (9,35,51) Google Street View, field observation, policy review, stakeholder engagement 2.4 Research questions and data collection methods The table below indicates the research question this study attempted to answer, and the methods by which we investigated the questions. Table 3: Research questions and data collection methods Research question Method Where are routes favoured by users/stakeholders for reallocation as temporary-to-possibly-permanent bicycle lanes? In-depth interview; stakeholder and user engagement; surveys (online and intercept); media review; literature review What are the barriers to and possibilities for temporary bicycle lanes? In-depth interview; media review; policy review What decision-making protocol could be used for bicyclenetwork identification that considers ‘meaningful access’ and ‘propensity to cycle’ as key indicators (see Definitions, above)? Literature and policy review; stakeholder and user engagement; surveys (online and intercept); observation What is the acceptability of ‘infrastructure-lite’ bicycle facilities in resource-constrained Sub-Saharan African cities, in terms of policy and regulations, and by users? In-depth interviews; media review; policy review; researchers’ persona experiences and insights What are possible routes toward adoption of identified routes, and the increased use of flexible bicycle lanes or pilots? Recommendations and insights drawn from the above 2.5 Assumptions and limitations of this approach • It is not yet clear whether lockdown behaviours will have a lasting impact on travel behaviour. Proposed routes for intervention reflect travel behaviours before COVID-19 disruption and assume travel to physical places of work. In most instances, the origins are low-income residential areas, where there is least likelihood of remote-working opportunities, to economic centres. COVID-19 specific pop-up infrastructure 6 FINAL REPORT: Learning from COVID-19 pop-up bicycle infrastructure: an investigation into flexible and user-led bicycle planning in Cape Town, Nairobi, and Kampala would have served a particular suppressed and atypical movement patterns, possibly as emergency responses. These routes identified have the possibility of longer-term impact. • Route identification has been limited to three routes per city, therefore not part of an overall network. Nevertheless, each route is based on evident origin/destination value, and the desire of people who travel these routes. • The City of Cape Town only collects cycling data on limited corridors (cordon counts) or where there have been specific road safety concerns; these routes do not necessarily correlate with routes preferred by stakeholders. • Data on cycling in Nairobi has been collected by development partners (notably the Japanese International Cooperation Agency, JICA). JICA collected data in preparation for the Nairobi Metropolitan Transport Masterplan (52) in 2006, and for the Nairobi Integrated Urban Development Plan (53) in 2014. The European Union provided institutional support to the Kenyan Transport Sector with funding for the preparation of an NMT Strategy and Plan for Nairobi. Independent researchers, NGOs and consultants have also been in involved in collecting data on NMT in Nairobi work. (30) • There has been no monetary evaluation of the proposed routes – partially because of the project time and scope, but also because of the study’s situation within an accessibility and justice paradigm. ‘Indicators like Level of Service, congestion/capacity ratios, delay measures or cost-benefit analyses focus our attention on the speeds of vehicles, when the key issues that we need to address are about human access to opportunities.’ (55) Says one stakeholder: ‘Cost-benefit analysis (CBA), when it comes to walking and cycling infrastructure, benefits people with high-incomes … the concept of the value of time means that the value of life is less important, and a person using non-motorised transport has a lower value of time than a car-user. We need an entire overhaul of the planning tradition – utility thinking needs to go.’ 13 13 Stakeholder interview, 11 December 2020, transcribed by the author 7 FINAL REPORT: Learning from COVID-19 pop-up bicycle infrastructure: an investigation into flexible and user-led bicycle planning in Cape Town, Nairobi, and Kampala 3. Cycling policy and mode share in case cities before COVID-19 Cycling as transport is a marginal mode in SSA cites, with walking overwhelmingly the majority mode. At the same time, cyclists tend to ride longer distances than is common in compact European or UK cities, and ride to save on public transport costs rather than ride to public transport stations, or for health reasons. (56) Nevertheless, Cape Town, Nairobi, and Uganda all have cycling policies (either as standalone cycling policies or part of a broader NMT policy) that have the increase of bicycle mode share as stated goals – for a combination of climate, congestion, public health, and poverty alleviation outcomes. Where mode-share increases are important to policy makers, it is worth noting – despite the evident differences in bicycle culture – that during COVID-19 in the UK and Europe, on average 11.5 km of provisional pop-up bike lanes have been built per city; each km has increased cycling in a city by 0.6%. (49) 3.1 Cape Town, South Africa Cape Town has a long-standing civil society bicycle advocacy sector, extending back to at least the early 1970s, and driving the impetus toward cycling being included in policy and infrastructure plans. (40) South Africa has a great many NMT policies and plans, including a national NMT Policy and NMT infrastructure guidelines; (26) Cape Town has an NMT Strategy and a standalone Cycling Strategy. (57) Cape Town Transport envisions a city where cycling ‘significantly …contribute[s] to a substantial reduction in congestion and GHG emissions …by 2030’. Between 2016 and 2017, road congestion periods increased, in some instances, up to five hours over the entire morning and evening peak, from 2.5 hours previously. (45) But while cycling as a sport and for leisure has grown significantly in the last decade, cycling as a mode of transport in Cape Town has remained marginal and relatively unchanged, at 1% of all commuter trips. (13,57) The City intends to increase this to 8% of trips by 2030 by improving access to bicycles, improving safety and security to reduce conflicts and risks, by providing and maintaining infrastructure, by improving data capturing, facilitating stakeholder collaboration to improve coordination between cycling stakeholders, and by improving communication and education to make cycling more attractive. In its Cycling Strategy (57) the City also identified opportunities to grow utility or commuter cycling for trips under 10 km made to employment areas, for trips to road and rail-based public transport services, and as longer distance trips where cyclists are experienced and have access to end-of-trip facilities. Although the City has developed an implementation framework for its Cycling Strategy, and in 2016 updated its Bicycle Master Plan, there is little evidence of progress toward achieving the stated goals. (13) Bicycle commuters are increasingly frustrated with what they perceive as poor support for and interest in user insights. The risk ratio for pedestrian and cyclist deaths is high, with a higher percentage of fatalities among cyclists than the percentage of the population who travel by cycling. (58) Although road and personal safety is a significant concern, commuter cyclists in Cape Town have shown a preference for direct routes along arterial roads rather than the indirect and more remote routes with bicycle lanes, and are relatively comfortable travelling distances longer than 8-10 km. (28,45) The majority of people who ride as transport are working men from lower-income areas. (59) Cape Town has a number of entirely segregated bicycle lanes, and a few 100 km of painted lanes, but are often of poor quality, indirect, and disconnected rather than following key routes or complete networks preferred by users. (28,40,45) Bicycle lanes tend toward what Petzer (60) describes as ‘fragmented archipelagos of cycling infrastructure, which have little impact on route choice in emerging cycling contexts. Cycling infrastructure rarely functions as a network, seldom follows cyclists’ preferred routes, ‘exists only where the needs of motor vehicles allow and disappears [at intersections] where the geometry of motor vehicles moving at speed requires more space’, or requires repeated entry and exit into motorised traffic, ‘which is more dangerous than continued travel within the motor traffic flow’. 3.2 Nairobi County, Kenya Cycling constitutes between 1.2 and 3% of commuter travel, depending on the data source. (61) Road traffic congestion has steadily worsened over the last decade, and there are no dedicated rights-of-way for public 8 FINAL REPORT: Learning from COVID-19 pop-up bicycle infrastructure: an investigation into flexible and user-led bicycle planning in Cape Town, Nairobi, and Kampala transport (mostly matatus, private sector paratransit services). There is a lack of NMT facilities, and where sidewalks exist, they are encroached upon by vendors. At least 10% of road deaths are cyclists. (54) Most cyclists in Nairobi are male, between the ages of 18-45. Route directness is highly valued by cyclists (particularly to save time), above that of safety or the presence of bicycle infrastructure. Most cyclists use these modes as personal transport, 95% travel entirely by bicycle (in other words, as their main mode, not as a trip leg to public transport). Nonetheless, cyclists would like to see cycling paths, with road space dedicated to their use (and not encroached upon by street side vendors), traffic speed reduction, and more bicycle repair services on their routes. (61) Figure 4: Social media comment on the quality of bicycle infrastructure in Nairobi Nairobi has an active cycling research community, and relatively recent activist sector, with growing attendance at events such as Critical Mass and car-free events. Utility cycling has the support of global agencies such as UN Environment Share the Road, which has its African headquarters in Nairobi, and the Open Streets African network founded in 2018. Nairobi City County (NCC) NMT Policy (61) would like to encourage cycling as a congestion mitigation strategy and, in particular, develop neighbourhood cycling routes to ensure that NMT-only routes are provided. The allocation of road space is critical to the success of the Policy, but it is a challenge for both cycling and public transport. A further challenge is a lack of a bicycle network or master plan, although its NMT Policy (61) and NMT Strategy (54) note that this this gap needs to be addressed; an NMT network is now in development. (54) While there are a few champions at national and county level, there still is a long way to go for NMT to develop into part and parcel of urban development. In most places, road infrastructure is almost entirely carcentric, and though there are road shoulders/road reserves, these are not always designed and developed for safety and comfort of pedestrians or cyclists. Where cycling paths have been developed, they have at times been impeded upon by informal traders and parked vehicles (e-hailing), boda-bodas, and matatus. In some places, ‘car-wash businesses’ have been established by well-connected individuals. The 2015 NMT Policy (61) had intended to facilitate a ‘cohesive cycle network of lanes, tracks and destination facilities from 50 km to 1 000 km by 2020’, but this has not come to pass. The intention is to develop adaptable and flexible long-term NMT plans that will be updated, evaluated and revised regularly. The Policy is not averse to retrofitting of street space and does not assume that all projects will be greenfield developments. The NCC also intends to pass by-laws that require private developments to make appropriate provision for NMT to connect existing or planned networks, and to explore and mobilise private sources of funding to meet these goals. Nairobi Streets and Roads Design Manual has been a work in progress for some time, while the Ministry of Transport, Infrastructure, Housing and Urban Development has partnered with the Institute of Transportation and Development Policy (ITDP) to develop an Urban Streets Design Manual for Kenya. This is currently undergoing public participation among various professional bodies and has so far received a positive response from stakeholders. 9 FINAL REPORT: Learning from COVID-19 pop-up bicycle infrastructure: an investigation into flexible and user-led bicycle planning in Cape Town, Nairobi, and Kampala The Nairobi NMT Policy (61) specifies a ‘Quick Wins’ approach in addition to long-term planning: this is described as ‘interventions that can be implemented in a short time using existing general information, using small investments at many locations, and having high easily measurable immediate impacts’ – proposed interventions include those that address safety, security, and the elimination of missing links. The ‘widening of NMT spaces to create space for cyclists’ is a listed priority, and project prioritisation will be based on the following factors: • routes to main public transport routes; • connections between low-income areas to social and economic areas (e.g., CBD, high income neighbourhoods, markets, schools, and industrial area); and • blocked/ grabbed NMT-only way-leaves in CBD, industrial and gated communities. Figure 5: Poor enforcement of NMT facilities ¬ the ‘shame of ‘grabbed’ walkways in Nairobi Source: Twitter, January 2021 The later NMT Strategy and Plan for Nairobi, 2019, (54) notes that it is not possible to adequately determine what has taken place to date in terms of this policy, as projects identified were ‘general’ and ‘not specified’; (54) the NMT Strategy proposes increased focus on these missing links as part of a wider NMT Network. Of these ‘Quick Wins’ there have been efforts by different agencies to improve NMT infrastructure, most notably the Nairobi Metropolitan Services (NMS), which was formed in 2020 and took over some of the roles of the County Government, including Public Works and Transport. NMS has replaced parking slots with pedestrian walkways and cycling lanes along a few streets in the CBD and intend to next work on linkages with the adjacent neighbourhoods. These were mentioned during some of the public participation and stakeholder forums for the development of the NMT plan for Nairobi in 2019. Public linkages / alleyways that had been ‘annexed’ by private landowners have also recently been re-opened and offered NMT users more direct routes (stakeholder responses). ‘Pilot projects’ are also specified in the Policy, described as ‘high visibility projects to “test†and evaluate impacts and to generate public support for larger projects. They should be designed based on international best practices to generate information on “what works†and “what doesn’t’ in the local environment and circumstances. Ideally, pilot projects should form part of planned long-term interventions so that funds are not wasted in isolated experimental projects.’ 10 FINAL REPORT: Learning from COVID-19 pop-up bicycle infrastructure: an investigation into flexible and user-led bicycle planning in Cape Town, Nairobi, and Kampala Figure 6: Bicycle infrastructure development in Nairobi CBD Source: Constant Cap 3.3 Kampala, Uganda In Uganda in 2012, the Ministry of Works and Transport (MoWT) published a National NMT Policy, with the assistance of UN Environment, and in 2020 published an NMT Implementation Manual (27) which focused on infrastructure standards. The Manual notes that, among other benefits, an increased use of cycling could enable the country to meet its Nationally Determined Contributions (NDCs) in terms of the Paris Agreement. Kampala does not yet have a bicycle master plan, although there are various guides to, for example, designing a 1.95 km pilot project14 in the CBD (see Figure 7, below), and a number of other NMT plans in association with proposed Bus Rapid Transit (BRT) routes. (27) The prevalence of cycling in the Greater Kampala Metropolitan Area is low due to unsafe cycling conditions, the hilly terrain, and lack of bicycle parking facilities – although there is increased interest, and a burgeoning vibrant bicycle advocacy sector with a significant social media presence. In the city, at least 40% of households walk as their main mode of transport, while cycling is used primarily as a substitute transport mode to sub-standard public transport (such as matatus and boda-bodas). Most cyclists in Uganda are male and cycling is not common among women, mainly because of a cultural belief in many parts of Uganda that women are prohibited from cycling. Encroachment of NMT spaces and lack of enforcement are major challenges to walking and cycling, where parked vehicles, traders, motor-cycles and taxis often take over footways and become obstacles to NMT movement. People who walk persistently account for at least 40% of road traffic fatalities and 25% of serious injuries every year; the highest share of road fatalities in Uganda. (27,62) Cyclists are the third most vulnerable road user group, after pedestrians and motorcyclists. 14 Namirembe Road and Luwuum Street, central Kampala 11 FINAL REPORT: Learning from COVID-19 pop-up bicycle infrastructure: an investigation into flexible and user-led bicycle planning in Cape Town, Nairobi, and Kampala Figure 7: Bicycle activist Amanda Ngabirano cycles on Kampala's flagship bicycle pilot in the CBD Source: UNHABITAT 12 FINAL REPORT: Learning from COVID-19 pop-up bicycle infrastructure: an investigation into flexible and user-led bicycle planning in Cape Town, Nairobi, and Kampala 4. Background and application of pop-up bicycle infrastructure during the pandemic Pop-up bicycle infrastructure, pedestrianisation, and ‘tactical urbanism’ has rapidly become part of the global COVID-19 ‘green’ recovery narrative (9,63). In contrast to responses in SSA, in Europe, the United States, Latin America, Australia, and India, cycling received extraordinary attention in terms of policy, rapid investment, and intervention, and from the travelling public – with rapid road-space allocation both during and postlockdowns to bicycle traffic by means of road closures, one-ways, contra-flow lanes, and bus- and bicycle-only roads, using paint, temporary barriers and other low-cost, infrastructure ‘lite’ mechanisms. Known as ‘flexible’, ‘provisional’, ‘temporary’ or ‘pop-up’ bicycle lanes, Bogota, Colombia, for example, was widely reported to have implemented 76 km of such interventions. (49) New York city announced the closure of 160 km of roads to cars, while Philadelphia and Minneapolis also closed off roads. Paris indicated that they would bring forward the construction of 650 km of bicycle lanes. (36) In Europe as a whole, at the time of writing (January 2021), 1,115.44 km of bicycle measures had been implemented, with a budget of 1,021,402,723 Euros allocated for bicycle promotion. (64) A focus on cycling in European cities after initial lockdowns was partially prompted by a concern that by late 2020, while overall mobility was ‘almost back to pre-crisis levels’, public transport use was lagging behind, and there appeared to be a shift from public transport to private car use (49); cycling would be able to provide similar physical distancing and personal mobility to that offered by private car travel, if additional cycling (and walking) space were made available. In other words, the provision of pop-up infrastructure was not necessarily just to ‘encourage’ more people to cycle, but to enable those who did cycle to do so with greater physical distancing, and to trial infrastructure to see if it generated demand: given that with the already high mode shares of cycling, the space available in most cycling-exemplar European countries, for example, was not sufficient if a 2 m physical distance was to be maintained. (50) Berlin was one of the first cities in Europe to develop pop-up infrastructure for bicycle travel, (36) as cycling space was already at a premium and lanes were too narrow to permit people to keep 1.5-2 m apart. Recommendations were that a target of 3 m wide be set in ‘Corona times’ and that, as this is also a common lane width for vehicle lanes in some cities, these lanes be quickly converted for bicycle traffic only, to make safe cycling possible. (36) During the course of 2020, a number of toolkits or guidelines for rapidly developing pop-up infrastructure were published, such the Guidebook for Tactical Urbanism released by the Ministry of Housing and Urban Affairs, Government of India, New Delhi (9); Berlin (Germany) Guide to Temporary Bike Lanes (Making Safe Space for Cycling in 10 days) (36); and the Institute for Transportation Development Policy’s Guide to Scaling Up Tactical Urbanism, Using Examples from the Global South15 . (35) These are summarised in Table 5. Three broad categories of pop-up infrastructure are described in the literature (8): (i) contraflow cycle lanes or point closures, so that routes for cyclists are faster and more direct; (ii) measures to close roads entirely, either all day or at certain times of the day; or (iii) measures to reallocate space on wide roads to create new cycleways. Their purpose is to facilitate increased or safer cycle traffic during pandemic conditions of reduced overall motorised mobility. In the United Kingdom (UK), the national government developed online guidance for rapidly reallocating road space, but indicated that any measures for cycling should meet requirements set out as per infrastructure guidance (i.e., there should be no reduction or relaxation of basic standards in terms of space allocation). (65,66) Among the UK government recommendations were that permanent schemes already identified and planned should be brought forward, and that the creation of corridors for bicycles could include ‘modal filters’, where roads are closed to motorised traffic using planters or large barriers. These measures were to be seen as experimental – trial schemes that may then be made permanent, with monitoring arrangements, and continuing with consultation once the measure has been built. (65) Temporary facilities could be in place for up to 18 months. Although emergency measures were legislated, all engagement and consultation remained mandatory, although with shorter time frames. 15 None of these examples from the Global South were from SSA. 13 FINAL REPORT: Learning from COVID-19 pop-up bicycle infrastructure: an investigation into flexible and user-led bicycle planning in Cape Town, Nairobi, and Kampala Data from 20 European cities to date indicate all in all, these interventions led to an increase in cycling of 7% of city-wide cycling, although this was not the primary aim. (49) Like with advocacy organisations in SSA, reallocating street right-of-way’s, with priority for walking and cycling, was envisaged as key to seizing an opportunity to reject pre-COVID-19 unsustainable ways of moving. A surge in infrastructure development and bicycle purchases, the COVID-19 bicycle boom, (67) could not only build a ‘foundation for a future that is inclusive, equitable, and liveable’ (9) but would also enable countries to fulfil their Nationally Determined Contributions (NDC) of the Paris Agreement. 16 Development of these temporary bicycle lanes were not without their challenges, though, with for example eight of Berlin’s 14 temporary bicycle lanes being found to be illegal after a political challenge, in September 2020. ‘The court’s reasoning …was that the senate department didn’t show that the areas were dangerous enough for cyclists to justify a pop-up lane. When the higher court ruled in favour of provisionally keeping the cycle lanes, in early October, they said the transport department’s appeal of the decision took account of traffic and accident statistics.’ (68) Controversy also centred on what has been seen by critics as top-down decision-making and lack of robust participatory planning and implementation processes, led by the emergency, rapid nature of the responses. (12) Figure 8: Examples of European cities adding pop-up bicycle lanes and other cycling interventions Source: (69) Table 4: Examples pop-up bicycle lane installation outside Europe Country Measure Mexico Mexico City develops 130 km of temporary bicycle lanes Colombia Cali installs 50 km of temporary bicycle lanes United States Austin, Texas, opens street spaces for people walking and cycling United States New York City opens 100 miles of streets for pedestrians and cyclists United States Oakland, California, opens 74 miles of streets for pedestrians and cyclists New Zealand Auckland improves facilities for people walking and cycling Israel Tel Aviv increases sidewalks and bike lanes Peru Lima adds 300 km of bicycle lanes Colombia Bogota adds 35 km (opened its Ciclovia route) Source: (70) 16 The legally binding international treaty on climate change, adopted on 12 December 2015 and coming into force on 4 November 2016. Its goal is to limit global warming to below 2 degrees Celsius compared to pre-industrial levels. 14 FINAL REPORT: Learning from COVID-19 pop-up bicycle infrastructure: an investigation into flexible and user-led bicycle planning in Cape Town, Nairobi, and Kampala Table 5: Summary of 2020 guidance for pop-up pedestrian and cycling facilities Item Reference Types of pop-up bicycle infrastructure Point closures or contraflow cycle lanes, to promote filtered permeability (8) Measures to close roads entirely to cars (either permanently or at certain times of the day) (8) Measures to reallocate space on wide roads to create new cycleways or to widen sidewalks (8) Typical workflow to implement rapid projects Site selection (9) Site appraisal (9) Design and prepare (9) Access relevant design guidelines (36) Formally designate measures with the relevant authority (36) Implement (9) Evaluate (9) Key roles and role-players for rapid projects (9) Initiation and championing (9) Design and construction (9) Coordination and logistics (9) Communication and documentation (9) Funding and fundraising Key processes for success Establish and communicate clear project goals (35) Accommodate public transport (9) Build early collaboration between community stakeholders and local government (35) Anticipate resistance and plan to engage with those stakeholders (35) Generate excitement and buy-in around project implementation (35) Demonstrate impact through data collection (35) Document success and maintain consistent communication with stakeholders (35) Prioritize civil society participation (35) 15 FINAL REPORT: Learning from COVID-19 pop-up bicycle infrastructure: an investigation into flexible and user-led bicycle planning in Cape Town, Nairobi, and Kampala Item Reference Evaluate the need for permanent materials (35) Engage active and potential new users (35) Leverage community events (35) Leverage local government support (35) Document pedestrian and cyclist feedback through surveys and other methods (35) Types of projects (other than bicycle lanes) for rapid implementation Connecting people and places (extended sidewalks, pop up bicycle lanes) (9) Reducing conflict between mobility and liveability: streamlining carriageways, fixing intersections, pedestrian crossings, traffic calming, parking reorganisation (9) Improving access to public transport: bus stop improvements, bus lanes / bus bay marking (9) Placemaking to improve liveability: shade, seating, landscaping, planting, stationary activity zones, lighting, art-in-the-street (9) Wayfinding to improve legibility: sign boards, floor signage, trail markings (9) Types of materials Traffic cones, delineators, Jersey barricades (9) Sidewalk markers (9) Rope (9) Duct tape or reflective tape (9) Paint: acrylic distemper paint, spray paint, thermoplastic paint, water-based epoxy paint, floor-coat emulsion paint (9) Reflective boards/cardboard (9) Lighting: LED lights, bamboo poles (9) Seating: wooden pallets, tyres, wooden crates, flowerpots, buckets (9) Tactical urbanism, pilots, and COVID-19 pop-up infrastructure have particular value, serving as proof of concepts before committing to large financial investments, making them a potential high-impact and highvalue approach for resource-constrained and rapidly urbanising cities such as those in SSA. They might also appeal to a risk-averse public authority, fearful of backlash against the development of contested infrastructure. As one Ugandan stakeholder put it, ‘by describing [our] proposals as “pop-upâ€, we thought it would “sell†better: cheaper, more urgent and easier to implement in contrast to bike paths 16 FINAL REPORT: Learning from COVID-19 pop-up bicycle infrastructure: an investigation into flexible and user-led bicycle planning in Cape Town, Nairobi, and Kampala (separated bike lanes). Excuses that “our roads don’t have space for bike lanes†or “maybe in 2 or 3 years under the new governmental budget†would be eliminated this way.’ 17 Even where bicycle infrastructure is not planned as a pilot or temporary, ‘infrastructure-lite’ has value in that it can be realigned or moved, should it become evident, after rigorous piloting, that there is little user acceptability or use. It would, therefore, avoid costly mistakes and back-tracking as shown in the example below (Figure 9). Figure 9: City of Cape Town removal of a bicycle crossing point which did not follow cyclist desire-lines Source: Author, Cape Town, January 2021 (the bicycle lane, on Ou Kaapse Weg, has since been painted green) 4.1 Tactical urbanism Tactical urbanism uses low-cost, flexible materials that can be installed quickly and repositioned easily in response to user feedback. These projects enable people to experience street design changes that can be difficult to conceptualise. Tactical urbanism projects are typically short term (lasting a few days) or medium term (lasting a few weeks or months); however, the projects are intended to facilitate long-term change. These projects can also provide an opportunity to trial smaller pieces of a larger project, allowing for quicker implementation, modification, and evaluation, which can help inform later project phases. ‘In this way, tactical urbanism projects contribute to the resiliency of urban transportation systems, empowering cities to rapidly adjust infrastructure and expand sustainable mobility—walking, cycling, public transportation—to respond to new challenges.’ (35) Tactical urbanism can be either a city or a citizen-led approach, and is a quick and affordable way in which to test and demonstrate change; it is premised on using short-term, low-cost and scalable interventions as a way to catalyse long-term change’. (9) Such interventions are difficult to implement when coming up against, for example, poor road conditions, lack of parking, crime, and lack of other necessary street utilities (including road widths). Successful tactical urbanism relies on partnerships and collaboration with the relevant authorities and follows rigorous stakeholder participation processes. Extensive planning phases are good practice, with vendor mapping, user mapping, activity mapping, and user surveys – which means that while such interventions may be temporary, moveable, and quick to install, they are not necessarily agile and rapid in the lead-time. Where bicycle routes are planned as a tactical-to-permanent intervention rather than an emergency, the guidance is that routes should function as a looped network, including mixed-use streets, street vending, public buildings, and public transport. Guidelines also recommend that a variety of land-uses are included, as well as intersections, to demonstrate how intersections perform. (9) More common examples of tactical urbanism are traffic calming, pedestrian crossings, placemaking, seating, way finding, and extended sidewalks, 17 Interview 10 January 2021 17 FINAL REPORT: Learning from COVID-19 pop-up bicycle infrastructure: an investigation into flexible and user-led bicycle planning in Cape Town, Nairobi, and Kampala demarcated with surface markings, traffic cones, delineators, jersey barriers, tyres, reflective tape, or signage. A reduction in bicycle Level of Service or minimum standards is not recommended (see also Key Findings). Tactical urbanism has emerged from a longer urban history of ‘unsanctioned’ and ‘unscripted’ urban practices, better desribed as guerrilla urbanism. (2) Although the growing acceptance by formal planning and transport authorities of such measures has ‘created important openings … for greater flexibility and expedient change’, (2) their institutionalisation and professionalisation has resulted in concerns regarding co-option and de-politicisation. These tensions are evident in the legacy of adversarial relationships and civil society frustrations with the slow rates of bicycle intervention, (25,41) for example. Pop-up bicycle infrastructure is only one example of tactical urbanism, although a good example of this approaches’ characteristics in terms of materials used, and ease of installation. Strictly, however, while tactical urbanism approaches are low-cost and easy to install and thus lend themselves to rapid implementation, these are not intended to be emergency measures only; tactical urbanism is geared toward redistributing of street space on a possible permanent basis, with an initial engagement in a trial run of what a new street section could look like. This allows an opportunity for all the stakeholders – the city, local businesses, government agencies, and residents – to become accustomed to the new street right-of-way configuration before it can transition into a permanent intervention that is endorsed by everyone for its efficiency and liveability’. (9) 4.2 Pilot, or demonstration projects A pilot project, which could also use tactical urbanism approaches, is an initial, small-scale implementation that is used to prove the viability of a project idea – it enables a transport authority to manage the risk of a new idea and identify any deficiencies before substantial resources are committed. (71) Based on the findings of a tactical urbanism intervention, a pilot project could be undertaken. The criteria for the success of such a pilot are largely similar to that of a tactical intervention. What is key is that a good pilot is not simply a small project in and of itself, but that it is developed specifically to prove the viability and value of a larger project; rigorous monitoring, evaluation, revision, and full-scale roll-out, should be the outcome. While many projects are described in policies or reports as pilot or demonstration projects in SSA cities, they are often merely small projects, with no corresponding monitoring and evaluation component. 18 (25,37) 4.3 Attempts to implement pop-up infrastructure in case cities during 2020 In Cape Town, one bicycle advocacy group 19 set about developing a pop-up bicycle lane proposal during hard ‘lockdown level 5’ 20 to and from the city’s Claremont central business district, where financial services and other essential retail and health services were continuing to operate. Public transport was operating for such essential workers travelling to the suburb, and the main road was ‘almost empty’ of private vehicle traffic. Based on previous experiences with the City of Cape Town’s (the municipal authority) willingness to engage with civil society proposals, the organisation instead approached the Claremont City Improvement District (CID), and together met (online) with large employers from the financial sector, retail, and workers. There was significant interest in a bicycle route to spare employees the risk of crowded public transport vehicles, and at least half the operating entities commitment to financially supporting the project. However, by the time plans had been finalised, South Africa was on ‘lockdown level 4’ and although public transport vehicles were still capacity constrained, they were permitted to travel more frequently and less likely to breach the regulations; utility cycling was still sufficiently novel to mean that employees preferred to fall back to what they knew, i.e., public transport, when it was more easily possible. The organisation has subsequently taken the proposal model to a CID in northern Cape Town and identified pockets of privately owned land on which to develop corridor and nodal infrastructure. 18 Interview 23 November 2020, transcribed by the author 19 Interview 3 December 2020, transcribed by the author 20 26 March–30 April 2020 18 FINAL REPORT: Learning from COVID-19 pop-up bicycle infrastructure: an investigation into flexible and user-led bicycle planning in Cape Town, Nairobi, and Kampala During the same lockdown period, academics at the University of Cape Town’s Centre for Transport Studies, in individual capacities, proposed pop-up pedestrian and cycling infrastructure to the Western Cape Provincial Government, suggesting the use of moveable concrete or plastic barriers, for which there is already a precedent in more permanent structures in eThekwini, South Africa. 21 While Province was well disposed to the idea, co-operative governance processes between the City of Cape Town, and the provincial authorities, were not sufficiently agile to respond to the need for emergency alignment. Also, during ‘lockdown level 5’, an emerging bicycle activist group in the largest low-income area of Cape Town engaged with City officials22 to ‘ask for their support to … develop temporary warning signage on an offramp’. Cycle commuters were willing to cycle longer distances, 20 km or more, from their residences to work, rather than use public transport, but ‘were scared because of the off-ramp, high-speed cars, and left-turning vehicles’. The activist group were not ‘asking for infrastructure or a bike-lane’, but permission to install signage. Official responses were reported to be that the road was unsafe for cycling, so they could not promote the route, and that the distance was too long for bicycle travel; before they could support any intervention, the City would require bicycle safety training and safety ‘activations’. In each instance, neither of the relevant transport authorities appear to have had the policy and process agility to react rapidly to user-requests and emergency needs. This contrasts with the cities that did implement pop-up infrastructure, and where directives were specifically designed to facilitate rapid change. Figure 10: Cape Town NGO describes attempt to reallocate road space for physical distancing ‘We obtained a 6 month social-distancing motivated road closure for the street outside of the day clinic in Gugulethu [a low-income area in Cape Town] to address the [space] issue [of queuing]. A win for dignity and streets, but government was unwilling to partner with us to manage the road closure and people management … and we would need to tender to manage the space …’ Source: Social media, 15 January 2021 In June 2020, a Uganda-based NGO, Cycling Out of Poverty, developed a plan for a bicycle lane network for Jinja, a city located at the source of the River Nile, 83 km from Kampala. Described as pop-up lanes, these proposals were not necessarily emergency, temporary, or COVID-response interventions, but were conceptualised as potentially permanent interventions using minimal adjustments (largely paintwork, signage, or rumble strips) to existing road infrastructure rather than physical barriers. (73) ‘Officials in Jinja were used to a vision of bike lanes as physical separated bike lanes, which would have a vast impact on infrastructure by e.g., expanding width of roads. This proposal is then indeed an infrastructure-lite option, which is obviously easier and cheaper and faster to implement.’ 23 The proposed network was to take the following elements into account: • Low speed streets: By selecting and/or designating streets in the network with speeds no higher than 30km/h, the conditions can be safe for all users to cycle comfortably; • Bike lanes as a statement: Special signage, road treatments and paint delineate space in a road network previous unfamiliar with cycling infrastructure as new, and therefore meant to be treated/approached differently and with caution; • Clear entry points: Because the network will be new and unfamiliar to many current road users, providing safe, clear points of entry to the network improves not only the visibility of the new infrastructure, but also the safety for its users. 21 Interview 4 January 2021 22 Interview 27 November 2020, transcribed by the author 23 Interview 10 January 2021, transcribed by the author 19 FINAL REPORT: Learning from COVID-19 pop-up bicycle infrastructure: an investigation into flexible and user-led bicycle planning in Cape Town, Nairobi, and Kampala Figure 11: Concept drawing of pop-up lanes on Kiira Road, Jinja, Uganda Source: Mobycon (73) Figure 12: Maps showing proposed network of pop-up lanes for Jinja, Uganda Source: Mobycon (73) 20 FINAL REPORT: Learning from COVID-19 pop-up bicycle infrastructure: an investigation into flexible and user-led bicycle planning in Cape Town, Nairobi, and Kampala 5. Studies from case cities: Cape Town, Nairobi, Kampala During COVID-19 lockdowns in project cities, movement patterns were almost entirely disrupted. Even after initial lockdowns, when more extensive travel was permitted and markets were opened, people continued to work from home or online where possible; larger gatherings were prohibited, schooling and other education travel was intermittent, curfews enforced, and businesses closed. COVID-19 specific pop-up infrastructure would have served these particular suppressed and atypical movement patterns and served purposes of physical distancing and mitigated the need for crowded public transport. Although the opportunity presented by the initial lockdowns in early 2020 for the implementation of popbicycle infrastructure has abated, there is still value in investigating and piloting temporary or flexible bicycle infrastructure, particularly in resource-poor countries with current low levels of cycling but with multiple demands for safer, affordable mobility options. Such interventions are relatively quick and affordable ways in which to test and demonstrate change, then review and revise before resources are committed to a project. They are also ways in which to draw on local knowledge to ensure that users’ mobility needs are met. It is not yet clear whether these lockdown travel behaviours will have a lasting impact on travel behaviour. In investigating priority routes for bicycle travel, we therefore made the decision to move beyond the immediacy of COVID-19 response and recovery. Proposed routes for intervention reflect travel behaviours before COVID-19 disruption and assume travel to physical places of work will continue as before. In most instances, the origins are low-income residential areas, where there is least likelihood of remote-working opportunities, to economic centres. For this reason, routes should not lose their importance once any new trip-making behaviour has stabilised. Maps show routes proposed by bicycle users and assessed in terms of the matrices, above. HDR (high-density residential areas), which are usually bicycle trip origins, public transport terminals, industrial areas (employment areas) and low-density residential areas (which are often employment areas) are shown. Each route is an entire trip in itself, i.e., it has standalone value, whether or not as part of a broader network. Where routes do not fit into any current bicycle strategy or master plan, this merits a rethink by the relevant transport authorities as to the attention given to desire lines and user needs, and more up-to-date, extensive stakeholder engagement. 5.1 Cape Town Five proposed routes are shown for Cape Town, three in Figure 12 (two of which converges on the Cape Town central CBD, and one of which travels from the CBD to the Claremont CBD), and two in Figure 13 (which emerge from high density residential areas and travel toward a high employment suburb (Noordhoek) and the Fish Hoek CBD and rail station). All routes are currently used by commuter cyclists to varying degrees (mostly working men). The route between Claremont and Cape Town is part of an organised bike-bus and is used mostly by middle-class riders; the routes between Masiphumelele and Fish Hoek/Noordhoek are highly used, mostly by men with lower incomes. All routes have been proposed to the City authorities for infrastructure development (without success) and Claremont to Cape Town and Khayelitsha to Cape Town proposed during 2020 as temporary facilities. • Claremont to Cape Town CDB: 11.2 km; • Khayelitsha to Cape Town CDB: 32.9 km; • Langa to Cape Town CBD: 17 km; • Masiphumelele to Noordhoek: 5.3 km; • Masiphumelele to Fish Hoek: 5.8 km. 21 FINAL REPORT: Learning from COVID-19 pop-up bicycle infrastructure: an investigation into flexible and user-led bicycle planning in Cape Town, Nairobi, and Kampala Table 6: Cape Town: Assessment of proposed routes Main indicator: Sub-indicator or assessment basis Response Propensity to cycle Assessment of bicycle-bus routes and interest These are routes recommended by bicycle activists, bike-bus ‘leaders’, and cycling organisations. Presence of bicycle repair facilities Not necessarily, although the concentration of bicycle shops in the Claremont area in Cape Town is an indication of the popularity of sports cycling in the neighbourhood; the route from Langa and Khayelitsha are linked to bicycle shop activists. Bicycle availability (including whether there have been bicycle distribution projects in the area) There are high levels of bicycle availability in each of these route areas. Field observation As observed by either the researchers or by stakeholders. See also (60,74) Ability to store securely (mainly overnight) This will always be a challenge where security is a concern, and where homes are small or informal. There have been reports of users storing their bicycles on their flat roofs. Are these routes popular public transport routes, or adjacent to popular public transport routes? Yes; Peak travel data (See travel data Project Report L3M192) Congestion Mitigation Peak travel data, mode and O/D Peak travel data (See travel data Project Report L3M192) Distance between origin & destination Users are comfortable with the distances proposed Meaningful access Mix of uses or destinations Yes – and each route is an entire trip in itself, i.e., it has standalone value, whether or not as part of a broader network Is this route already used by commuters? Yes – also see (60,74) Have commuters proposed this route to authorities, or recommended this route? Is it part of a bike-bus system? Yes – also see (60,74) Scalability & acceptability What is the attitude of the relevant authorities to the inclusion of this route in formal planning? All routes have been proposed to the City authorities for infrastructure development (without success) and Claremont to Cape Town and Khayelitsha to Cape Town proposed during 2020 as temporary facilities. (See page 18.) The City has undertaken counts of bicycle users on Far South routes and declared there to be not sufficient demand (although activists have noted that infrastructure has been developed where there has been no previous use at all). 22 FINAL REPORT: Learning from COVID-19 pop-up bicycle infrastructure: an investigation into flexible and user-led bicycle planning in Cape Town, Nairobi, and Kampala Main indicator: Sub-indicator or assessment basis Response What is the relationship with the relevant authorities of the citizen activist groups? Varies Is this route already on a bicycle master plan? Not in any meaningful respect Have these routes been developed in consultation with any decisionmaking authorities? See above Existing road reserve width See Table 7 Availability of road reserve See Table 7 Ease of implementation Presence of publicly owned street side / kerbside parking See Table 7 Would this require land appropriation? See Table 7 Number of vehicle lanes/ volume of vehicles in peak, day Is there spare capacity on the road? See Table 7 Is this part of a planned BRT route? No – and it may not fit in with City of Cape Town planning focused on improving walking and cycling access to BRT stops and stations Are there prohibitive by-laws, traffic acts, and other hindering regulations? Not for the development of permanent interventions 23 FINAL REPORT: Learning from COVID-19 pop-up bicycle infrastructure: an investigation into flexible and user-led bicycle planning in Cape Town, Nairobi, and Kampala Figure 13: Bicycle routes proposed by users in Cape Town (central Cape Town and metro South East) Figure 14: Bicycle routes proposed by users in Cape Town Far South 24 FINAL REPORT: Learning from COVID-19 pop-up bicycle infrastructure: an investigation into flexible and user-led bicycle planning in Cape Town, Nairobi, and Kampala Table 7: Number of lanes, road shoulder, presence of parking: proposed bicycle routes Cape Town No. Proposed route Speed limit (km/hr) Number of lanes per direction Road shoulder Presence of parking 1 Claremont to Cape Town CDB 60 1 Intermittent Intermittent 2 Khayelitsha to Cape Town CDB 60-80 Varies between 1 and 2 Intermittent Intermittent 3 Langa to Cape Town CBD 60-80 Varies between 1 and 2 Intermittent Intermittent 4 Masiphumelele to Noordhoek 60-70 Varies between 1 and 3 Intermittent Intermittent 5 Masiphumelele to Fish Hoek 60-70 Varies between 1 and 3 Intermittent Intermittent Table 8: Cape Town: Functional road classes and details Road Class Length Average lane widths Proportion of overall Principal Arterial (Class 1) 558 km 3.7m 5% Major Arterial (Class 2) 875 km 3.7m 7.5% Minor Arterial (Class 3) 980 km 3-3.7m 8.5% Collector (Class 4) 930 km Varies 8% Local Street (Class 5) 8 350 km Varies 71% Total 11,696km 5.2 Nairobi, Kenya For Nairobi, the four routes proposed for the implementation of pop-up bicycle lanes are as shown in the Figure 15. They include; Mombasa Road/Uhuru Highway starting from the Airport North Road to the CBD; Waiyaki Way/Chiromo Road Starting from Kangemi to the CBD, Langata Road from Galleria to Nyayo Stadium and Outer Ring Road from Airport North Road to Thika Road. All the proposed routes are currently used by commuter cyclists (mostly workers) and are also popular public transport routes. The Outer Ring Road Route connects the dense neighbourhoods in Eastlands while the other three are major corridors that link to both low income and high-income neighbourhoods. • Outer Ring Road: 10 km; • Waiyaki Way: 8.53 km; • Mombasa Road/Uhuru Highway: 9.40 km; • Langata Road: 8.0 km. Table 9: Nairobi: Assessment of proposed routes 25 FINAL REPORT: Learning from COVID-19 pop-up bicycle infrastructure: an investigation into flexible and user-led bicycle planning in Cape Town, Nairobi, and Kampala Main indicator: Sub-indicator or assessment basis Response Propensity to cycle Assessment of bicycle-bus routes and interest These are routes recommended by NMT activists and cyclists. Presence of bicycle repair facilities There are several cycling repair facilities along all the selected routes. Most are informal and therefore not properly mapped. Bicycle availability (including whether there have been bicycle distribution projects in the area) There are high levels of bicycle availability in each of these route areas. Field observation As observed by either the researchers, or by stakeholders. Daylight hours/visibility? Very clear during the day. Good street lighting at night. Ability to store securely (mainly overnight) Congestion Mitigation Are these routes popular public transport routes, or adjacent to popular public transport routes? Yes (See also Project Report L3M192) Peak travel data, mode and O/D Yes; Peak travel data (See travel data Project Report L3M192) Meaningful access Distance between origin & destination Outer Ring Road: 10 km Waiyaki Way: 8.53 km Mombasa Road/Uhuru Highway: 9.40 km Langata Road: 8.km Mix of uses or destinations Main destination is the CBD (Outer Ring road link to other roads that lead to the CBD) due to the polycentric nature of the city. Each route is an entire trip in itself, i.e., it has standalone value, whether or not as part of a broader network. Is this route already used by commuters? Yes, the routes were based on selection of the most popular routes used by cyclists as well as closeness to densely populated areas. Scalability & acceptability Have commuters proposed this route to authorities, or recommended this route? Is it part of a bike-bus system? Users have on several occasions requested that cycling lanes be installed along these routes. What is the attitude of the relevant authorities to the inclusion of this route in formal planning? This varies across different authorities. The highway authorities have not been keen on inclusion of NMT, but the city authorities have been very positive towards NMT. 26 FINAL REPORT: Learning from COVID-19 pop-up bicycle infrastructure: an investigation into flexible and user-led bicycle planning in Cape Town, Nairobi, and Kampala Main indicator: Sub-indicator or assessment basis Response What is the relationship with the relevant authorities of the citizen activist groups? The city authorities have worked with different civil society groups in developing an NMT policy and prioritising NMT. The Urban roads authorities have attempted some NMT facilities when pushed. The highway authorities have a very poor record of NMT development. Is this route already on a bicycle master plan? No (there is no bicycle master plan for Nairobi) Have these routes been developed in consultation with any decision-making authorities? Yes Existing road reserve width The road reserve is marked from one property to the other (entire road width) Outer Ring Road: 30-60 m Waiyaki Way: 30-60 m Mombasa Road/Uhuru Highway: 60 m Langata Road: 40 m Ease of implementation Availability of road reserve yes Presence of publicly owned streetside / kerbside parking none Is this already on a bicycle master plan? no Would this require land appropriation? no Number of vehicle lanes/ volume of vehicles in peak, day Is there spare capacity on the road? Most have 2/3 lanes as shown above. There is sufficient road reserve for expansion and NMT inclusion. Is this part of a planned BRT route? yes Are there prohibitive by-laws, traffic acts, and other hindering regulations? No 27 FINAL REPORT: Learning from COVID-19 pop-up bicycle infrastructure: an investigation into flexible and user-led bicycle planning in Cape Town, Nairobi, and Kampala Figure 15: Bicycle routes proposed by users in Nairobi, Kenya Table 10: Number of lanes, road shoulder, presence of parking: proposed bicycle routes Nairobi No. Proposed route Speed limit (km/hr) Number of lanes per direction Average road width (m) Road shoulder Presence of parking 1 Mombasa Road/ Uhuru Highway 50 3 14 Yes (rough) No 11 2 Waiyaki Way 50 2 (some sections 3) 15 Yes No 3 Langata Road 50 2 20 Yes (rough) No 4 Outer Ring Road 50 2 (some sections 3) 20–30 Yes No 5.3 Kampala, Uganda For Kampala, the four routes proposed for the implementation of pop-up bicycle lanes are as shown in the Figure 16. They include Hoima Road starting from the high-density residential areas of Kawaala and Namungoona to the Kampala CBD through the existing pilot NMT corridor; Bombo Road starting from the high-density residential area of Kawempe and through others like Katanga, Old Mulago and Kavule to the CBD; Yusuf Lule Road connecting Mulago and the high-density employment Kampala Industrial Area; and the Northern Bypass, which forms a semi-circle across the Northern suburbs of Kampala. All the proposed routes 28 FINAL REPORT: Learning from COVID-19 pop-up bicycle infrastructure: an investigation into flexible and user-led bicycle planning in Cape Town, Nairobi, and Kampala are currently used by commuter cyclists (mostly students and workers) and boda-boda bicycles operating mainly near the markets along the Northern bypass. All the proposed routes have been proposed to KCCA by the multi-modal transport master plan for Kampala as NMT high priority and medium priority routes. • Yusuf Lule Road: 3.74 km; • Hoima Road (Kawaala to Kampala CBD): 4.94 km; • Bombo Road (Kawempe to Kampala CBD): 7.39 km; • Northern Bypass (Sentema Road to Kyebando): 7.9 km. Table 11: Kampala: Assessment of proposed routes Main indicator: Sub-indicator or assessment basis Response Propensity to cycle Assessment of bicycle-bus routes and interest The selected routes were among the most commonly recommended by NMT experts and cyclists basing on the terrain and the existing number of cyclists along the routes. Consideration was also made for routes which currently have high number of cyclists for example the Northern Bypass where many cyclists utilise the lanes which are still closed to car traffic on the sections under construction to ride safely; Currently, there no known bicycle-buses in Kampala. Presence of bicycle repair facilities Bicycle shops and repair facilities are mainly concentrated in the CBD and in Katwe area. There also bicycle repair facilities scattered in some local markets in the outskirts of Kampala. Field observation As observed by either the researchers or by stakeholders. Congestion Mitigation Are these routes popular public transport routes, or adjacent to popular public transport routes? Yes – see also Project Report L3M192 Peak travel data, mode and O/D See also Project Report L3M192 Meaningful access Distance between origin & destination Yusuf Lule Road: 3.74 km Hoima Road (Kawaala to Kampala CBD): 4.94 km Bombo Road (Kawempe to Kampala CBD): 7.39 km Northern Bypass (Sentema Road to Kyebando): 7.9 km Mix of uses or destinations Is this route already used by commuters? Routes are largely commuter / travel-to-work corridors, which have been identified by users as priorities, or are already used. Land-use maps Scalability & acceptability Have commuters proposed this route to authorities, or recommended this route? Is it part of a bike-bus system? Yes, these routes have been proposed to KCCA by cycling advocacy groups. Kampala, however, does not have any known bike-bus system 29 FINAL REPORT: Learning from COVID-19 pop-up bicycle infrastructure: an investigation into flexible and user-led bicycle planning in Cape Town, Nairobi, and Kampala Main indicator: Sub-indicator or assessment basis Response What is the attitude of the relevant authorities to the inclusion of this route in formal planning? These routes are already planned NMT highways and NMT priority routes under the Multi-Modal Urban Transport Master Plan for GKMA. What is the relationship with the relevant authorities of the citizen activist groups? Relatively good Is this route already on a bicycle master plan? No. Kampala does not have a bicycle master plan. Have these routes been developed in consultation with any decision-making authorities? No Existing road reserve width See Table 11; Only on the Northern bypass Ease of implementation Availability of road reserve See Table 11; Only on the Northern bypass Presence of publicly owned streetside / kerbside parking See Table 11 Is this already on a bicycle master plan? No. Kampala does not have a bicycle master plan, but a MultiModal Urban Transport Master Plan for GKMA. Would this require land appropriation? No Number of vehicle lanes/ volume of vehicles in peak, day Is there spare capacity on the road? 1-2 Is this part of a planned BRT route? Yes (Hoima Road and Bombo Road) Are there prohibitive by-laws, traffic acts, and other hindering regulations? No 30 FINAL REPORT: Learning from COVID-19 pop-up bicycle infrastructure: an investigation into flexible and user-led bicycle planning in Cape Town, Nairobi, and Kampala Figure 16: Bicycle routes proposed by users in Kampala, Uganda Table 12: Number of lanes, road shoulder, presence of parking: proposed bicycle routes Kampala No. Proposed route Speed limit (km/hr) Number of lanes per direction Average road width (m) Road shoulder Presence of parking 1 Hoima Road 50 Kampala-Kasubi: 2 14 Yes No Kasubi-Namungoona: 1 11 2 Bombo Road 50 1 15 Yes No 3 Yusuf Lule Road 50 2 20 Yes No 4 Northern bypass 70 2 (undergoing expansion in some sections) 20–30 Yes No Table 13: Kampala: Functional road classes and details Class Description Function Characteristics Max design speed range (km/h) Typical total width ranges (m) C Primary roads Mobility and access Accommodate shorter trips feeding into higher classes of road Paved Paved Intermediate level of service and design speed 50–90 8.6–10.0 31 FINAL REPORT: Learning from COVID-19 pop-up bicycle infrastructure: an investigation into flexible and user-led bicycle planning in Cape Town, Nairobi, and Kampala Class Description Function Characteristics Max design speed range (km/h) Typical total width ranges (m) Gravel Gravel 70–90 10.0 D Secondary roads Mobility and access Accommodate shorter trips feeding into higher classes of road Gravel Gravel Intermediate level of service and design speed 50–90 8.6–10.0 E Minor roads Access Short trip length Gravel Gravel Low design speeds and level of service 40–80 6.4–8.6 Source (27) 32 FINAL REPORT: Learning from COVID-19 pop-up bicycle infrastructure: an investigation into flexible and user-led bicycle planning in Cape Town, Nairobi, and Kampala 6. Key findings and considerations Figure 17: Social media post on pop-infrastructure applications Source: Social media user, referring to the City of Cape Town’s bicycle and pedestrian planning, Cape Town, December 2020 6.1 Learnings among case cities Both Uganda and Kenya are at earlier stages than South Africa in developing bicycle infrastructure, bicycle networks, and promoting bicycle travel. South Africa has multiple bicycle-related policies, including a national NMT Policy and NMT infrastructure guidelines, (28) and Cape Town has an NMT Strategy and a standalone Cycling Strategy (57); Uganda has a national NMT Policy and an NMT infrastructure manual (27); and in Kenya, only Nairobi itself as an NMT Policy, and an NMT Strategy. (54,61) Among the three cities only Cape Town has a bicycle master plan, updated every five years. Although Cape Town has a reputation for having both a highly visible (and internationally marketed) bicycle culture, 24 it also has a regulatory environment that thwarts spontaneous or even planned activist events. In one example, Cape Town’s monthly activist ride Moonlight Mass, through the streets of central Cape Town every full moon at 9 pm, was eventually cancelled because of the cost of conforming to law enforcement, disaster management, fire and safety and medical, emergency, and other event requirements; Cape Town’s early Open Streets events struggled with similar permitting. 25 26 By stakeholder accounts, similar events in Nairobi do not have these same constraints. ‘It is extremely hard, extremely frustrating, talking with city [of Cape Town] officials; that is the hardest thing about advocacy in some respect – there is an obsession with the city authorities about regulations and what needs to happen.’ 27 In Cape Town, there was a reluctance from individual officials in the City to engage with this study, as they were of the view: (a) there is a competent Transport Planning Department which is executing its duty; and (b) that temporary schemes either don’t fit in with their perception of requirements or are ‘too difficult to implement’ within protocols/ official processes. 28 24 See for example https://insideguide.co.za/cape-town/things-to-do/critical-mass-cape-town/ 25 The author’s personal experience as a co-founder of the organization in 2012. 26 Letter from the City of Cape Town Tourism Events and Marketing Events Permit Office, 4 November 2012 27 Stakeholder interview November 2020, transcribed by the author 28 Email communication on 17 Nov 2020, from the City of Cape Town. 33 FINAL REPORT: Learning from COVID-19 pop-up bicycle infrastructure: an investigation into flexible and user-led bicycle planning in Cape Town, Nairobi, and Kampala This leaves Cape Town’s many bicycle commuters and public space activists of the view that their route inputs are not welcomed and do not serve their needs, and that their views are not respected. Critics of Cape Town’s approach to bicycle planning are vocal and often derisive. (26,45) One stakeholder said that that ‘the City of Cape Town lacks a logic model on which to base decision-making and policy creation… In the absence of a considered, technical, and neutral plan, we are faced with decisions and policies made on biased assumptions and feeling. The assumption within the City is often that it is too difficult to try implement infrastructure that will encourage behavioural change.’ 29 Like other cities, Cape Town places value on measuring success by the number of ribbons cut (75) – and legacy, ‘world-class’ segregated facilities, no matter how short or lacking a meaningful origin/destination, serve this purpose. Yet ‘consistency is required in the implementation to achieve measurable results, and political success should not be measures by the number of ribbons cut, but a commitment towards incrementally building towards a desired integrated transport system that provides for all.’ (75) Kampala’s recent and lauded 1.95 km pilot project would do well to note. Figure 18: Western Cape provincial government opening a pedestrian bridge outside Cape Town Source: Social media 20 February 2021 Where users’ route choices do not conform to documented planning principles or available road space, there is a sense among interviewees that cities would prefer to reroute them away from desire lines, to develop new, greenfield routes. Cape Town offers a case in point, where new, ‘best-practice’ segregated bicycle facilities were developed in tandem with the MyCiTi Bus Rapid Transit right-of-way in 2011 – some distance from routes preferred by cyclists – and which are now the site of routine muggings, ‘bike-jackings’ and other security concerns. In 2017 the City of Cape Town eventually deployed 10 dedicated officers to patrol the cycle lane as a safety intervention, (76) but the routes remain high risk to users. Over the course of 2012-2014, the City of Cape Town begun a process of stakeholder engagement to paint green bicycle lines, with marginal separation, along a highly trafficked, congested route, Albert Road in Salt River, that forms a key link between the city’s southern suburbs and the central city. Stakeholders were critical of the proposed intervention: businesses because of loss of parking, and bicycle users because of the minimal separation: ‘The success of the cycle lane depends critically on motorists respecting it in two particular ways – firstly, keeping out of it when driving, and secondly, not parking in it. Providing proper design features to discourage 29 Interview response provided by stakeholder in writing, 10 December 2020 34 FINAL REPORT: Learning from COVID-19 pop-up bicycle infrastructure: an investigation into flexible and user-led bicycle planning in Cape Town, Nairobi, and Kampala these behaviours should not be seen simply as a cost, but as a saving of the very high enforcement costs that will otherwise be required.’ [19 October 2012, cycling stakeholder] ‘Painting a line on the ground for drivers to ignore is an expensive waste of time, doing nothing is cheaper and has the same final outcome. ‘[19 October 2012, cycling stakeholder] Stakeholders had proposed, instead, that a version of a pop-up infrastructure be implemented instead, to ‘designate a road adjacent to/parallel with the main road of traffic and indicate that it is to be considered a bike route during certain hours of the day (rush hours). Then, indicate that although cars may drive there, the speed limit would be reduced, and they would have to expect to find many bikers there. Thus, at little expense, a bike lane would be identified’. [19 October 2012, cycling stakeholder] Eventually, in 2017, the City ‘removed’ the bicycle lanes, replacing them with a narrower version, to provide more parking for businesses. A predictable response from stakeholders was that: ‘money was spent, roads were closed and there was a significant amount of time and effort put into these lanes. So it does not work, what happens to all the money, time and effort now?’ (77) Figure 19: City of Cape Town removing bicycle lanes in Albert Road after complaints Source (77) For Nairobi and Kampala there is an opportunity to learn from Cape Town’s experiences with both bicycle master planning and infrastructure design and implementation. Neither city yet has a bicycle master plan or network plan. A key finding is that when master planning is insufficiently agile and there is a perception that it is unassailable – and when it spans over too long a term, relying on long lead times and budgetary cycles – there is the risk that bicycle lanes will be installed in the ‘wrong’ place, not attend to the desires of users, and lose goodwill from all stakeholders and opportunities for collegial rather than adversarial relationships and partnerships. Where bicycle infrastructure is politically risky, (29,32,33) it is even more essential to get it right. Nairobi, Kampala, and other LIC cities, have the opportunity to guard against criticism such as the following, below, in developing master plans and routes: ‘With regards to participation, the process in which this [cycling] strategy has been conceived has lacked transparency and authentic engagement. A single stakeholder session was held with a limited participant pool who had the luxury of attending a meeting in the city administration building during weekday work hours. A 35 FINAL REPORT: Learning from COVID-19 pop-up bicycle infrastructure: an investigation into flexible and user-led bicycle planning in Cape Town, Nairobi, and Kampala more diverse socio economic and geographical group of participants is required to have a holistic view of the cycling landscape.’30 Both Nairobi and Kampala, and other LIC cities, are considering BRT services; a learning from Cape Town is that it is not necessarily the right approach to use an expedient opportunity such as BRT to ‘add on’ bicycle infrastructure, just because there is funding or ‘space’. If infrastructure is of exemplary standard but in areas that current cyclists do not travel, or in remote areas that are not safe, the bicycle lanes cannot be worthwhile investments. Attempts to divert cyclists from their desire lines are rarely successful, and the cost of marketing unpopular routes should not be discounted. Pilots of temporary installations are relatively quick and affordable ways in which to test and demonstrate change, and review and revise before resources are committed to a project. They are also ways in which to draw on local knowledge to ensure that users’ mobility needs are met. Already transport officials in Nairobi and Kampala were enthusiastic about supporting this study, revealing an interest in learning from those who use bicycle transport and know the city in the intimate way that only pedestrians and cyclists can. 6.2 Findings related to pop-up infrastructure: motivations and mode share From the work undertaken in this study, it is not difficult to see why pop-up bicycle infrastructure was not readily considered in the case cities project. In the cities where pop-up infrastructure was developed, cycling already had higher levels of acceptability and higher mode shares, while in SSA the focus was on providing access to safer mobility using what was already the most popular mode, not pivoting to promote a new mode; in other words, COVID-19 interventions were emergency, not visionary responses. In addition, pop-up facilities for walking and cycling were seized upon as opportunities for unprecedented public health interventions elsewhere, with a focus on the ‘active’ nature of these modes; in African cities, on the other hand, there are already high levels of walking, with their own set of public health challenges, and narratives to increase walking and cycling focus more on their potential for congestion mitigation and poverty-alleviation than on their physical activity. (78) In African cities, there are already high levels of walking (to the extent that walking exposure to road traffic risks and personal security constitutes a public health risk), and narratives to shift mode shares focus more on congestion mitigation and poverty-alleviation than their physical activity. Figure 20: Cartoon showing approach to space for cycle lanes In the Global North 30 Stakeholder feedback on City of Cape Town Cycling Strategy, 2027 36 FINAL REPORT: Learning from COVID-19 pop-up bicycle infrastructure: an investigation into flexible and user-led bicycle planning in Cape Town, Nairobi, and Kampala Outside SSA, public transport capacity limitations were enforced, while in SSA the privately owned paratransit sector could put pressure on government to increase capacities; thus, capacity restrictions became less of a motivator for alternative transport opportunities and developing space for non-motorised modes. There was also less concern in SSA regarding a loss of public transport patronage in the longer-term, as fewer people have private cars to ‘fall back’ on. Walking mode shares in SSA cities are substantially higher than those in EU cities and other cities where popup infrastructure was developed (mostly); thus, where infrastructure might have been proposed, the primary beneficiaries would have needed to be pedestrians. Not only are there beneficiaries who require more urgent interventions, but there are also more urgent space priorities in SSA, for example the allocation of road space to boda-bodas. 6.3 Findings related to existing road infrastructure Cities in SSA have developed around the old urban core of ‘colonial style’ centres. Government and major institutions are in the centre, which encourages sprawl. All trips are towards centre, and the road network was developed from colonial era, i.e., narrow, and there are few opportunities for the expansion of road reserve. Polycentric, 15-minute city initiatives, which facilitate cycling as a mode, are not a quick fix in sprawling SSA cities. Those who walk and cycle tend to travel longer distances from their workplaces to their areas of residence, largely because of the segregated nature in which some of the cities were initially planned e.g., Nairobi and Cape Town. In all three case cities, the lower order road infrastructure (in most instances where people choose to cycle as direct routes) is largely one lane (in each direction), with marginal road shoulders and limited road reserves; higher order roads are dual two- or three lanes. Few have the available space that would enable bicycle infrastructure to be installed without substantial political will and demonstration of value (whether in terms of cost, lives saved, air quality, climate impact, mode shift, etc); unlike in Europe, for example, traffic congestion is significant, and it is simply not an option to remove a lane to cater for what is currently a marginal mode. In Kampala, there are only approximately 360 km of paved roads in a good enough condition to serve a population of 4.5 million people. SSA cities also face challenges of informality (informal businesses) that tend to occupy street sides and walking and cycling infrastructure where it has been developed. In Nairobi, many of the existing cycling facilities have been colonised by boda-bodas and informal traders/vendors. Stakeholders indicate that pop-up pedestrian or bicycle infrastructure is likely to suffer the same fate and might not be operationally successful. In Kampala, where there are few bicycle facilities yet, informal traders have crowded out pedestrian infrastructure. It is politically risky to place the needs of cyclists above that of informal traders and the pedestrians they serve. Once again, pilots may be able to test and demonstrate ways in which to accommodate traders, pedestrians, and cyclists (the next section discusses enforcement further). 6.4 Acceptability of temporary infrastructure and poor enforcement Sub-Saharan African cities have among the worst road safety rates globally, where between 40-80% of fatalities are people walking or cycling. Despite pledges to a number of international road safety commitments, the trends indicate continuing increases in traffic crashes (79), with dramatic exceptions during COVID-19 mobility restrictions. In Kenya, 50% of deaths are people walking or cycling (80); poor enforcement of road traffic regulations are routinely cited by stakeholders and in policies and strategies are key barriers to cycling safety. 37 FINAL REPORT: Learning from COVID-19 pop-up bicycle infrastructure: an investigation into flexible and user-led bicycle planning in Cape Town, Nairobi, and Kampala Figure 21: Poor enforcement of painted bicycle lanes in Albert Road, Cape Town Source: Author, 2015 Figure 22: Poor enforcement of walking and cycling facilities, Nairobi Source: Social media, 2 January 2021 While low-carbon mobility or public health (obesity) might key motivators for encouraging more walking and cycling through bicycle infrastructure in Europe or the US, in SSA cities, it is road safety that is a key impetus. For these reasons, there is marked reluctance among numbers of cyclists themselves to accept painted infrastructure as an adequate response to cyclists’ needs, and among advocates who press for entirely segregated infrastructure instead. In Cape Town, the City has installed many km of painted cycling lanes, disparaged by users as ‘magic paint’ that one would never permit children to use.31 31 Interviews December 2020, transcribed by the author 38 FINAL REPORT: Learning from COVID-19 pop-up bicycle infrastructure: an investigation into flexible and user-led bicycle planning in Cape Town, Nairobi, and Kampala Figure 23: A bicycle commuter describes her experience with painted bicycle lanes in Cape Town Source: Social media, 17 February 2021 Figure 24: Bicycle advocacy group in Cape Town calls for safer bicycle infrastructure Call for Better Cycle Lanes: Albert Road Categories: Advocacy News and Views, Cycle Network CPT, Petitions + Campaigns, Projects, Campaigns and Activations 2014 – PROJECT UPDATE The Albert Road Cycle NMT project is currently in the tender process (10 April 2014). Construction should begin early May. The final design for bicycle infrastructure will be a colourised green cycle lane along both sides of the road (a Class 3 facility). Although this is not the ideal type of cycle lane from a safety point of view (we were really hoping for a segregated cycleway along Albert Rd), it should make cyclists more visible to drivers and encourage the use of this important connecting route between Southern Suburbs and the CBD. Source: (81) Painted bicycle lanes on spaces shared with motorised traffic are accepted practice in the facility guidelines of both Uganda and South Africa (Kenya does not yet have country-specific guidelines). In Uganda, the NMT Guidelines include the possibility of bicycles and motorised vehicles sharing the roadway only where streets have very low traffic volumes (100 Average Daily Traffic), and where vehicle operating speeds are lower than 30 km / hr (proposals that sharing is permissible at 50 km / hr were rejected by the Ministry, as a road-safety concern32 (33). Partial separation from traffic, however, is accepted by means of level differences or through bollards or continuous road marketing and signage. (27) South Africa’s guidelines (28) recommend that mobility spines, arterials, and routes to public transport stations, are either entirely segregated, or marked (painted) if the roads are wide enough (in other words, once the deemed needs of motorised traffic have been taken into account first). Sharing with mixed traffic is deemed acceptable along suburban roads. There are no fines promulgated in the country for parking infringements on painted infrastructure. Thus, a challenge is that while there are low levels of acceptance of infrastructure-lite facilities – because of both enforcement and safety concerns – these interventions are provided for in official guidelines and are an obvious tactical urbanist approach. Painted lanes, within urban contexts of poor enforcement and high road safety risks, may have greater value as temporary, proof-of-concept interventions, and with careful monitoring and evaluation, lead to more permanent, more acceptable solutions. Overwhelmingly, the reasons given by activists and cyclists in their calls for segregated facilities is because they offer protection from motorised traffic. 32 Personal engagement with the Ministry, December 2019 39 FINAL REPORT: Learning from COVID-19 pop-up bicycle infrastructure: an investigation into flexible and user-led bicycle planning in Cape Town, Nairobi, and Kampala 6.5 Institutional challenges: the case of Nairobi As with many other low-income cities, urban transport institutions have been in place for many years and are often inefficiently organised. In Nairobi, before devolution to the Nairobi Metropolitan Transport Authority (NaMATA), much of the authority over urban transport was centralised at the national level but divided by partial and sometimes overlapping and contradictory mandates and responsibilities. The institutional organisation for transport consisted of several entities, including: • the National Ministry of Roads, responsible for formulating national road policy and road subsector administration; • the National Ministry of Transport, responsible for overseeing national transport policy and transport sector administration, including public transport services within cities; • the Kenya National Highways Authority, responsible for developing and maintaining national roads, including important arterials in urban areas; and • the Kenya Urban Roads Authority, responsible for developing and maintaining urban roads. Until devolution, there was also a National Ministry for Nairobi Metropolitan Development. In addition, local authorities were responsible for managing roads and streets within their jurisdictions. The resulting tangled web confused ordinary citizens, diluted scarce financial resources, and led to chronic underinvestment in transport, including formal public transport systems. (13) The route to decision-making may, therefore, still be fraught with issues. 6.6 Policy and regulatory environment: experiences, barriers ‘It is extremely hard, extremely frustrating, talking with city officials; that is the hardest thing about advocacy in some respect – there is an obsession with the city authorities about regulations and what needs to happen.’ 34 No clear guidelines were in place in any of the case cities to permit temporary projects related to COVID-19. This was apparent from stakeholder consultation outcomes. International guidance for pop-up infrastructure stipulate that no reduction in bicycle Level of Service or minimum standards should accrue; if SSA cities were to take this same approach, there would be insufficient road reserve to develop temporary facilities where cyclists have indicated preference, and the political will to remove space from vehicles is unlikely. In Uganda, there is the intention that the NMT Implementation Manual ultimately become a statutory instrument; there is risk that this could thwart the development of infrastructure, if statutorily required bestquality standards are not able to be met. South Africa has had NMT infrastructure guidelines since the early 1980s, but these are not yet binding requirements (28) – leaving the way free to develop substandard or suboptimal infrastructure, but which also, counter-intuitively, leaves the way free to develop rapid, temporary interventions, should the political will be there. The Ugandan guidelines make provision for retrofitting (a challenge applicable to all our case cities, and that is pertinent to temporary facilities); the guidelines note that while design principles remain the same as for greenfield developments, it is more likely that retrofitting will provide the minimum acceptable facilities, while new developments are able to work towards the ideal. The guidelines also offer advice for low-cost but effective interventions, though – tactical urbanism, in a sense – suggesting that the most successful infrastructure NMT retrofits are traffic calming and other speed reduction methods: ‘In cities and urban centres where road space is limited, side drains can be covered to better utilise road spaces. It is also important that drains are covered with durable covers with small gaps to ensure that cyclists can ride over them without getting their wheels trapped.’ (27) 34 Stakeholder interview November 2020 40 FINAL REPORT: Learning from COVID-19 pop-up bicycle infrastructure: an investigation into flexible and user-led bicycle planning in Cape Town, Nairobi, and Kampala 6.7 Opportunities to develop temporary interventions To answer the question of how it might be possible to develop temporary interventions, we asked the following questions of our data sources and interviewees: o What types of processes / consultation are required our project cities before an intervention can become permanent (statutory public engagement etc); o Are there any definitions or criteria by which a public intervention could be called ‘experimental’? o What defines ‘temporary’ in our project cities in terms of urban interventions? o What regulations and policies affect guerrilla or tactical urbanism? 6.7.1 Approach in Cape Town In one example given by stakeholders, to gain permission for a recent ‘parklet’, a permit to ‘work in a public street’ was required, which included a comprehensive contextual analysis to support the application. Parklets ‘don’t really break many rules. As long as the structure is in the [parking] bay, which has been paid for, it is a compliant piece of infrastructure. The City’s main concern is avoiding the illegal occupation of land, but a parklet is contained, it’s within one or two parking bays, and legally renting the land for an agreed upon period of time. The main concern is the materiality of the temporary structure, which needs to be compliant and certification, and then the issue of maintenance, which is often the one that stops pop-up projects’.35 ‘The problem with pop-up infrastructure,’ in the view of one activist organisation, ’is that the City is trying to avoid legal prosecution based on the “spatial contract†represented by roads – people pass certain tests and comply to certain standards and behaviour to make use of this space. Road infrastructure must promote compliance to this behaviour. Pop-up infrastructure functions outside of this “contract†and could be believed to be in breach of contract with the road users who have opted into a system that works in a certain way.’ The problem, however, is that this spatial contract imposed upon road users by the City doesn’t work, as it isn’t equitably enforced or maintained and there aren’t mechanisms in place that will allow the City to pivot once they discover it doesn’t function optimally. The system is extremely rigid and non-negotiable, except when it comes to parking, which would explain the ease of implementation when it comes to infrastructure such as parklets. Parking is a conversation that takes place often and is somewhat open to public discourse.’ 36 ‘Pop-up bike lanes are tricky for this exact reason, because they go across a number of designated areas of responsibility and conflict. Hypothetically, a pop-up bike lane that only takes up parking bays would work very well. The Albert Road cycling lane in Woodstock does just that and this is why it was relatively easy to implement. The minute this infrastructure goes across an intersection, the problems arise again. Even permanent bike infrastructure tends to end at an infrastructure. The problem is that, often, people using the lane would be under the impression that they could just keep going and not adhere to the rules of the intersection, which ends up doing more harm than good. The effort and energy spent in order to get this to work doesn’t lend itself to a temporary intervention, you may as well do it permanently. ‘ Table 14: Cape Town: review of policy/ statutory requirements in relation to infrastructure provision Actions/ requirements Policy/ statute/ procedure How are infrastructure proposals normally planned? By developers – New or re-developed areas By the municipal government – city-owned roads By Provincial government – Provincial roads By SA National Roads Agency – National roads By sub-councils/wards – Small local roads/infrastructure 35 Stakeholder interview 10 December 2020 36 Stakeholder interview 10 December 2020 41 FINAL REPORT: Learning from COVID-19 pop-up bicycle infrastructure: an investigation into flexible and user-led bicycle planning in Cape Town, Nairobi, and Kampala Actions/ requirements Policy/ statute/ procedure How is new/ amended road infrastructure work implemented? In general, drawings prepared to standards and submitted to City Transport Planning for approval. Construction after approval. How is the funding obtained and prioritised? Private for private development City: from rates. By committee Provincial: National allocation. By committee National: Fiscus allocation. Cost benefit/ political Sub-councils/Wards: Rates allocation. By committee Is there an approvals procedure in local government from planning to design to construction? Private developments approval process via City Transport Planning Dept. All others through City Committee structures Also applicable is: Municipal Systems Act, 2000 National Land Transport Act, 2009 Roads Ordinance Act, 1976 Urban Transport Act, 1977 Local Government Municipal Systems Act, 2000 Road Safety Strategy, 2013-2018 Is there legislation governing traffic management? National Road Traffic Amendment Act 64 of 2008 Amended National Road Traffic Act Regulations, 2014 What legislation/ by-law/policy mechanisms are there for temporary infrastructure/events in the city and this been used previously? Traffic By-law, 2011 What COVID-19 related specific legislation is there in relation to Transport? National: Directions on Measures to Address, Prevent and Combat the Spread of COVID-19 in the Public Transport Services, 2020 Is there a nationally and/or locally used road design guide/ standard? UTG series TMH series Guidelines for Human Settlement Planning & design Provincial and local guidelines Standards and Guidelines for Roads and Stormwater, version 1.0, October 2020 Universal Access Policy, 2014 What impediments are there to pop-up infrastructure implementation? National Road Traffic Amendment Act needs modification. Will allow Traffic By-law, 2011, to be amended. Traffic Police may deem it unenforceable (if not self-regulating) MoU with Western Cape Dept. of Public Works and Transport for Cape Town and Golden Arrow Bus Services MoU: Transport for Cape Town and Department of Safety and Security 42 FINAL REPORT: Learning from COVID-19 pop-up bicycle infrastructure: an investigation into flexible and user-led bicycle planning in Cape Town, Nairobi, and Kampala Actions/ requirements Policy/ statute/ procedure How is traffic policed, dedicated lanes (if any are protected/ dedicated)? Traffic Law Enforcement Unit How can proposals be quickly implemented (what’s the best way of getting things done)? Amendment of National COVID-19 Directions, amendment of City Traffic Bylaw, agreement with City Transport Mayoral Committee member and Traffic Law Enforcement Unit; Work with City Improvement Districts or private land owners. 6.7.2 Approach in Nairobi Processes for intervention types in Nairobi depend on the classification of the road and the political willingness from those in charge. For example, interventions along Luthuli Avenue and Muindi Mbingu Street within the CBD were largely based on temporary interventions (street closures) conducted during different Nairobi Placemaking Weeks. Additionally, there are also plans to have pedestrianisation along Banda Street after similar experiments. These were largely because of the willingness of the then County Government (and currently NMS). At the same time in Kisumu, the Kisumu County Government put up temporary cycling lanes along one of their main roads, but this was stopped by the Kenyan Highways Authority who felt that it interfered with vehicular traffic. The Kenya Urban Roads Authority and Kenya Highways Authority have authority over roads in Kenya but are known to focus mainly on vehicular movement. Interventions are viewed as experimental when temporary interventions are placed e.g., placemaking weeks, street closures, temporary barriers, to see the effect. Experiments to date have focussed on traffic flow, no right turns, or the closure of certain roundabouts. Street design manuals do not refer to temporary or agile interventions – the closest to ‘temporary’ have been street closures to study the effects of improved pedestrianisation, but overall, these are not covered in the Kenyan National Traffic Act nor the Nairobi County Transport Act. 6.7.3 Approach in Kampala The Uganda Traffic and Road Safety Act of 1998 (Part VII) provides for temporary speed restrictions, closure of a road, restriction of traffic on a road, one-way traffic on a road, and special parking places, among other interventions that can be put into effect by the Minister of Works and Transport through a statutory order. In this case, the responsible authority/agency under the Ministry or the proponent of the intervention has the obligation to carry out the research and necessary consultations from all the relevant stakeholders to ensure that it is viable and consistent with the Constitution or any other laws, policies, or other city plans/provisions. An example is the KCCA proposal for permanent route charts and colour coding of 14-seater minibuses operating in GKMA, which was concluded but remains pending for lack of a statutory instrument by the Minister for Works and Transport. In Kampala, the intervention must be planned (e.g., through feasibility studies, or desk planning) by Kampala Capital City Authority (KCCA) technical staff. It is then taken to the Authority/Council sessions, which is the political wing of KCCA, for passing by means of a vote. During the implementation process, in the instance that the intervention entails construction of facilities, the usual public procurement processes must be followed to procure contractors and consultants to design and construct/supervise the works. Also, during the detailed design process, some consultations with respect to environment and social aspects of the project are usually held. For legislation, a bill is presented to Parliament for the first reading and then forwarded to the relevant committee of Parliament. It is then presented for the second reading, debated, and after the third reading, can it then be passed and assented into law by the President. The process for by-laws by either KCCA or other local governments is not so different, except that in this case, the President does not need to sign it into law, as the Minister of Local Government authorises such by-laws before they are passed (Minister for Kampala in case of KCCA, since Kampala doesn’t directly fall under the local government structure). 43 FINAL REPORT: Learning from COVID-19 pop-up bicycle infrastructure: an investigation into flexible and user-led bicycle planning in Cape Town, Nairobi, and Kampala Political interest is also a major factor, as seen when the KCCA proposed a boda-boda free zone, which was approved by cabinet but is not being enforced probably because of the political reasons. These are not particular definitions or criteria by which a public intervention could be called ‘experimental’. Most temporary interventions are usually not directly statutory but implemented at the discretion of the traffic police in their mandate to regulate traffic and keep order, for example traffic diversions in case of a road crash or road construction, guiding traffic during peak hours with heavy traffic congestion on unsignalised junctions or in case of faulty traffic signals etc. However, these are general for mixed traffic which, in Kampala, primarily consists of cars and boda-bodas and some cyclists. Other examples of temporary interventions in Kampala include car-free Sundays in the CBD (open market) and place-making initiatives. 6.8 Summary of stakeholder responses regarding route selection Route preferences among people who currently ride as a means of transport are significantly longer than the emergency pop-up infrastructure cited above and are often along roads that have are single or dual carriageways and do not necessarily lend themselves to bicycle lanes without the removal of vehicle travel space and road realignment. It may therefore seem counter-productive to map these routes as user preferences; however, these routes reveal that: • commuter cyclists choose direct routes, not necessarily quiet, ‘safer’ roads; • commuter cyclists routinely ride distances longer than the 5-8 km that is drawn from international good practice guidelines (45,57). This echoes work that shows that within lower-income communities, bicycle travel competed favourably with public transport up to 25 km per direction; (42) • despite a vocal social media presence of cyclists opposed to infrastructure-lite, commuter cyclists are willing to ride without the best-practice segregated facilities recommended in guidelines; • despite a vocal social media presence of cyclists opposed to infrastructure-lite, commuter cyclists are willing to share road space with mixed traffic despite speed differentials that are higher than those recommended in guidelines. (27,28) This echoes work that shows that a lack of cycling infrastructure does not hinder current cyclists. (42) Such cyclists deserve greater attention and greater safety provision. 44 FINAL REPORT: Learning from COVID-19 pop-up bicycle infrastructure: an investigation into flexible and user-led bicycle planning in Cape Town, Nairobi, and Kampala 7. Research uptake and next steps 7.1 Initial stakeholder dialogue As described above, in Cape Town, in-depth interviews were conducted with civil society organisations, political party groups, individual researchers, academics, facilitators of ‘bike-bus’ commuter groups (some of which represent close to 100 commuters on a particular route), as well as individuals who work in bicycle advocacy. In Nairobi, stakeholders included individual cyclists and members of organised cycling groups, academics, representatives of Safer Cities Nairobi Initiative (a collaboration between UNHabitat and Nairobi City County), Institute for Transportation and Development Policy (ITDP), and the Flone Initiative (an organisation that focuses on inclusive public and non-motorised transport). In Kampala, engagement was individual cyclists and with policy makers and NGOs, for example ITDP, the Uganda Ministry of Works and Transport (MoWT), Training, Education & Empowerment for Neighbourhood Sustainability (TEENS), Uganda National Urban Forum, and the Uganda Sustainable Transport Network. 7.2 Continuing stakeholder dialogue Following client approval of the final Report, a public facing webinar will be held on 11 March 2021 to discuss the findings of this research in conjunction with research conducted for project HVT L3M192. The webinar is intended to be conducted jointly between Cape Town, Kampala, and a Nairobi based think-tank, Naipolitans. It would involve stakeholders as well as other interested parties to broaden the group of attendees and through this obtain as wide a response as possible. A post-webinar Report detailing the event content, feedback and considerations will be prepared as an adjunct to this Report. Our media campaign will include monitoring social media for opportunities to share findings, and these will be shared with IMC in a Report annexure. 7.2.1 Journal submission/conference paper (attendance and presentation) On acceptance of the final product by HVT, our proposal is to prepare and publish a final research paper in an open-source journal and possibly a paper for consideration at an appropriate conference. HVT has agreed with the Transportation Research Record (TRR) for a special collection for research papers arising from the HVT C-19RRTRF projects devoted to COVID-19 to be considered and published if acceptable. • We have submitted two abstracts to VeloCity Lisboa 2021: ï‚š Using lessons from pop-up bicycle lanes globally to develop agile pilots in Sub-Saharan African cities; ï‚š Planning for cycling in Sub-Saharan cities. A comparison of forecasting techniques with cycling activities and user proposals. • Opportunities also exist to prepare peer-review papers for: ï‚š Active Travel Journal; ï‚š Walking, Cycling and Accessibility in Cities in the Global South (Frontiers); ï‚š Tactical Urbanism, active mobility, and public space in the COVID pandemic for the Royal Geographical Society with the Institute of British Geographers (1-3 Sept 2021). • We have indicated that we wish this research to be considered for the 2022 TRB meetings. TRB will conduct a separate review process and acceptance for the meeting is not guaranteed, but papers can be automatically cascaded to the review committee if this option is taken up. The committee that reviews papers for the TRB Meetings is separate from the editorial committee reviewing these submissions. • TRB will promote the TRR Special Issue in its newsletter, web page, and on social media. Papers accepted for publication in the TRR can be added to the SAGE Journals microsite for research and may be featured in blog posts on the SAGE social science hub. The papers will also be posted to the HVT website via the original publication link. 45 FINAL REPORT: Learning from COVID-19 pop-up bicycle infrastructure: an investigation into flexible and user-led bicycle planning in Cape Town, Nairobi, and Kampala 7.3 Research uptake We have already hosted two meetings that show evidence of interest in research uptake: • Knowledge sharing meeting with WHO on 27 January 2021, to provide input into their development of a research paper on legal approaches to promoting walking and cycling. • Email discussion and online meeting with Frederic Tesfay (GIZ/TUMI) re their interest in pop-up bicycle facilities in Mombasa, Kenya (contact made via Twitter). Interviewees and authorities in Kampala and Nairobi were enthusiastic and welcomed the opportunity to share and receive input in this study and were of the view that temporary and demonstration projects have value. This experience suggests that would be a strong motivation for advocacy groups to approach decisionmakers to investigate the roll-out and implementation of pilots quickly. Both Nairobi and Kampala are at an earlier phase of bicycle activism than is Cape Town, where authorities are less set in their approach and where there is more opportunity to influence the way forward. In particular, there is an opportunity for other LICs to learn from Cape Town’s experiences with its relatively static bicycle master planning, approach to stakeholder engagement, and infrastructure design and implementation, and instead use tactical urbanism approaches to demonstrate change, test and revise, before resources are committed to projects. Engineers from Nairobi City Council, for example, indicated that they welcome ‘noise makers [such as our research team] who can come … with “wild ideasâ€â€™ 37 that can be investigated; they note that ‘us engineers and planners an only follow instructions’, and welcome the guidance from non-state players. We would highly recommend should such projects be considered – the evaluation, acceptance, and funding a pilot’s implementation – that the experience be documented and shared further, to continue to contribute to the body of knowledge regarding pilots, lessons learned, and context-specific policy transfer. 7.4 Project outputs (to date) The following project outputs have been delivered for the cities studied in this research: • Project Report (this document); • A map of proposed routes for interventions, including decision-making matrices; • An example of the stakeholder consultation questionnaire; • A summary of statutes and policy related to road infrastructure procurement, design and traffic; • Presentation slides related to HVT cohort meeting; • Information for the COVID Mobility Works website; • A poster for a proposed webinar to held to discuss our findings. 7.5 Project outputs (forthcoming) • Social media dissemination of project report (summary); • Blog posts of project summary; • Research paper; • Conference presentation; • Presentations to be delivered at forthcoming webinar. 37 Stakeholder input, 23 February 2021 46 FINAL REPORT: Learning from COVID-19 pop-up bicycle infrastructure: an investigation into flexible and user-led bicycle planning in Cape Town, Nairobi, and Kampala 8. Concluding reflections Bicycle planning as currently implemented does not necessarily attend to the needs and wants of the majority of people in SSA – whose mobility and accessibility needs are already unmet, who do not necessarily show interest in bicycle travel, and who instead desire better quality public transport. Most people who travel by bicycle in SSA are working men, who ride in mixed traffic, as main modes and for distances longer than 8 km in one direction. Bicycle infrastructure guidance, however, tends to focus on exemplar '8–80’ facilities, ‘cycling for all’, drafting ‘world-class’ standards that are largely beyond the resource capacity of cities; a consequence is that few facilities are built at all, and those who already cycle are left with little. Promotion and marketing strategies (necessary when routes do not always coincide with current user preferences) are in many instances drawn from entirely different contexts, with insufficient knowledge of and attention given to local circumstances. The project suggests that pop-up infrastructure, based on user-needs, could draw attention to measures that are lighter, quicker, and cheaper to implement, and that can be trialled and quickly re-allocated or moved if they have unintended adverse impacts or could be better implemented elsewhere. When the focus is on current users and those with an evident propensity to ride, ahead of attracting entirely new users, the high cost of marketing and persuasion is reduced – at the same time, an increase in cycling on one route is likely to raise awareness and contribute to increases in cycling overall. While there may have been ‘deleterious impacts than can arise from [the] rushed and exclusionary planning processes’ (12) critics see in the emergency bicycle lane installations during COVID-19, these impacts are as likely, and possibly more deleterious, from rushed, exclusionary planning regarding permanent infrastructure. Where emergency regulation has no doubt facilitated more agile regulation during COVID-19 – and played a key role in the ability of cities to install emergency infrastructure – this same rapid regulatory approach has given birth to backlashes against ‘control’ by governments of citizens, and the abrogation of rights. This is a delicate path to be negotiated. A challenge is that bicycle lanes and their installation have become contested interventions in resource-poor cities, and their legitimacy is questioned, but infrastructure-lite interventions have low user acceptance in terms of road safety and are poorly enforced. Trialling user-proposed routes with light-touch infrastructure, using context-specific planning principles together with local stakeholders, may give decision-makers confidence to develop accepted routes – and thereby avoid delegitimising bicycle travel through backtracking, and limit the rhetoric around unused facilities or mis-directed resources. In resource-constrained environments these methods would help find a way in which to offer increased safety for users without the ‘world-class’ infrastructure that is often beyond the budgets of SSA cities. A key point about a tactical urbanism or temporary approach is that it is intended as a learning experience. This study has taken routes proposed or used by current bicycle commuters and applied further evaluation to develop a refined set of routes in each city; all routes proposed meet the criteria for trialling, despite existing infrastructure and vehicle priority challenges. Increasing the share of bicycle transport, and making bicycle travel safer, is the stated goal in a growing number of cities in LICs – whether to meet climate goals, improve air quality and congestion, or to attend to poverty alleviation. Pop-up bicycle facilities that function as carefully designed pilots can assist cities meet these goals and targets, through the collation of evidence to motivate and support both political and technical decision-making. 47 FINAL REPORT: Learning from COVID-19 pop-up bicycle infrastructure: an investigation into flexible and user-led bicycle planning in Cape Town, Nairobi, and Kampala References 1. Venter C. Developing a Common Narrative on Urban Accessibility: Brook Inst. 2016;44. 2. Hou J. Guerrilla urbanism: urban design and the practices of resistance. URBAN Des Int. 2020 Jun;25(2):117–25. 3. Martens, K, Piatkowski, D, Krizek, K, Luckey, K. Advancing discussions of cycling interventions based on social justice. In: Bicycle Justice and Urban Transformation: Biking for all? Routledge; 2016. (Routledge Equity, Justice and the Sustainable City series). 4. Golub, Aaron, Hoffman, Melody, Lugo, Adonia, Sandoval, Gerard. Creating an inclusionary bicycle justice movement. In: Bicycle Justice and Urban Transformation. Routledge; 2016. 5. Behrens, R, McCormick, D, Mfinanga, D. An introduction to paratransit in Sub-Saharan African Cities. In: Paratransit in African Cities: Operations, regulation and reform. Routledge; 2016. p. 1–25. 6. Dolowitz, D, Marsh, D. Who Learns What from Whom: a Review of the Policy Transfer Literature. Polit Stud. 1996;44:343–57. 7. De Borger, B. The political economy of transport decisions. Spec Issue Econ Transp. 2018;13:1–3. 8. Lovelace R, Talbot J, Morgan M, Lucas-Smith M. Methods to Prioritise Pop-up Active Transport Infrastructure. Findings [Internet]. 2020 Jul 8 [cited 2020 Dec 10]; Available from: https://findingspress.org/article/13421-methods-to-prioritise-pop-up-active-transport-infrastructure 9. Mohankumar, V. A Tactical Urbanism Guidebook. GIZ; 2020. 10. Transport Justice: Designing fair transportation systems [Internet]. Routledge & CRC Press. [cited 2021 Feb 17]. Available from: https://www.routledge.com/Transport-Justice-Designing-fair-transportationsystems/Martens/p/book/9780415638326 11. Jennings, G; Allen, H; Arogundade, E. Gaining or Losing Ground: Ensuring that post-COVID-19 transportation serves the needs of women in low income in African cities. High Volume Transport Applied Research; 2020 Dec. (COVID-19 and Transport Response and Recovery). 12. Combs TS, Pardo CF. Shifting streets COVID-19 mobility data: Findings from a global dataset and a research agenda for transport planning and policy. Transp Res Interdiscip Perspect. 2021 Mar;9:100322. 13. Hitge G, Joubert J. A nodal approach for estimating potential cycling demand. J Transp Geogr. 2021;90:102943. 14. Jennings, G. Urban Lockdown Lessons for South Africa. WWF South Africa; 2020. (Insights and opportunities for equitable and resilient low-carbon transport). 15. Dalkmann, H; Turner, J. COVID-19 urban transport response: opportunities for policy-making in Africa. High Volume Transport Applied Research; 2020. 16. UN Environment. Impact of COVID-19 on Walking and Cycling Policy and Practice in Africa. 2020. 17. Abubaker I, Tuniz J, Oursler A. As the Coronavirus Looms, Can African Cities Become More Walkable and Bikeable? [Internet]. TheCityFix. 2020 [cited 2020 Oct 23]. Available from: https://thecityfix.com/blog/coronavirus-looms-can-african-cities-become-walkable-bikeable-imanabubaker-janene-tuniz-anna-oursler/ 48 FINAL REPORT: Learning from COVID-19 pop-up bicycle infrastructure: an investigation into flexible and user-led bicycle planning in Cape Town, Nairobi, and Kampala 18. Ngabirano A. What vehicle-free Namirembe road teaches us [Internet]. The Observer - Uganda. [cited 2020 Dec 31]. Available from: https://observer.ug/viewpoint/64101-what-vehicle-free-namiremberoad-teaches-us 19. Samuel, S, Casas, M. A vision for post-pandemic mobility in African cities [Internet]. World Economic Forum. 2020 [cited 2020 Dec 31]. Available from: https://www.weforum.org/agenda/2020/08/a-visionfor-post-pandemic-mobility-in-african-cities/ 20. Cycling in Africa is booming. These activists want to make it safer [Internet]. World Economic Forum. [cited 2021 Jan 4]. Available from: https://www.weforum.org/agenda/2020/10/covid19-cycling-activistafrica-ivory-coast/ 21. Feature: Cycling re-emerges as favored transport means in Ugandan capital amid COVID-19 - Xinhua | English.news.cn [Internet]. [cited 2021 Jan 4]. Available from: http://www.xinhuanet.com/english/2020- 07/01/c_139180686.htm 22. World Health Organization. Moving around during the COVID-19 outbreak. 2020. 23. Coulibaly L. Pandemic pushes forward new generation of African cyclists. Reuters [Internet]. 2020 Oct 1 [cited 2020 Dec 31]; Available from: https://uk.reuters.com/article/uk-health-coronavirus-africa-cyclingidUKKBN26L1T4 24. Vanderschuren, M, Jennings, G. NMT Travel Behaviour in Cape Town, Dar es Salaam and Nairobi. In: NMT Integration into Urban Transport Planning in Africa. 1st ed. Routledge; 2017. 25. UN Environment. Global Outlook on Walking and Cycling: Policies & realities from around the world. UNEP; 2017. 26. Jennings, G, Petzer, B, Goldman, E. When bicycle lanes are not enough: Growing mode share in Cape Town, South Africa: An analysis of policy and practice. In: Non-Motorized Transport Integration into Urban Transport Planning in Africa. Routledge; 2017. 27. Ministry of Works and Transport Uganda. Non-Motorised Transport Manual. Ministry of Works and Transport, Uganda; 2020. 28. South African National Department of Transport. NMT Facility Guidelines: Policy and Legislation, Planning, Design and Operations. South African National Department of Transport; 2014. 29. The “racist†cycle lanes Tony Ehrenreich failed to see… [Internet]. OUR FUTURE CITIES. 2011 [cited 2021 Feb 16]. Available from: http://ourfuturecities.co/2011/04/the-racist-cycle-lanes-tony-ehrenreich-failedto/ 30. Julius Malema delights ‘the enemy’ [Internet]. BusinessLIVE. [cited 2021 Feb 16]. Available from: https://www.businesslive.co.za/fm/fm-fox/2016-06-15-julius-malema-delights-the-enemy/ 31. Joburg’s R70m bicycle lane project scrapped until all roads are tarred | News24 [Internet]. [cited 2021 Feb 16]. Available from: https://www.news24.com/news24/southafrica/news/joburgs-r70m-bicyclelane-project-scrapped-until-all-roads-are-tarred-20160913 32. ANC slams DA for cancelling ‘important projects’ in City of Joburg [Internet]. [cited 2021 Feb 16]. Available from: https://soundcloud.com/primediabroadcasting/anc-slams-da-for-cancelling-importantprojects-in-city-of-joburg 33. Jeranji, T. Cyclists hit the brakes. People’s Post: Woodstock/Maitland. 2015 Jul 7;1. 49 FINAL REPORT: Learning from COVID-19 pop-up bicycle infrastructure: an investigation into flexible and user-led bicycle planning in Cape Town, Nairobi, and Kampala 34. Jennings, Gail. Building a socially just bicycle programme in an unequal city: the case of Johannesburg. Gauteng City-Region Observatory; 2018 unpublished, accepted for publication. 35. ITDP. From Pilot to Permanent: How to scale tactical urbanism using lessons from the Global South. ITDP; 2020. 36. Mobycon. Making safe space for cycling in 10 days: A guide to temporary bike lanes, from FriedrichshainKreuzberg, Berlin. Mobycon; 2020. 37. Jennings G. An exploration of policy knowledge-seeking on high-volume, low-carbon transport: findings from expert interviews in selected African and South-Asian countries. Transp Res Interdiscip Perspect. 2020 May 1;5:100117. 38. High Volume Transport [Internet]. HVT. [cited 2021 Jan 1]. Available from: http://transport-links.com.w01c1b50.kasserver.com.w01c1b50.kasserver.com/ 39. The Propensity to Cycle Tool: An on-line interactive web tool for transport planning [Internet]. [cited 2021 Jan 2]. Available from: https://www.robinlovelace.net/presentations/pct-pres.html#1 40. Jennings, G. Freedom of movement, Freedom of choice: an enquiry into utility cycling and social justice in post-apartheid Cape Town. In: Bicycle Justice and Urban Transformation. UK: Earthscan, London; 41. Vorster J, Zuidgeest M. Cycle route network development and evaluation using spatial multi-criteria analysis and shortest path analysis. :16. 42. Bechstein E. Cycling as a Supplementary Mode to Public Transport: A Case Study of Low Income Commuters in South Africa. South Afr Transp Conf. 2010;9. 43. Beukes E, Vanderschuren M, Zuidgeest M. Context sensitive multimodal road planning : a case study in Cape Town, South Africa. J Transp Geogr. 2011;19(3):452–60. 44. Morgan N. Johannesburg’s bike lanes are not well used. Here’s why [Internet]. The Conversation. [cited 2021 Feb 16]. Available from: http://theconversation.com/johannesburgs-bike-lanes-are-not-well-usedheres-why-75068 45. Jennings, G. Cycling for change: exploring the role of carbon-consciousness among Cape Town’s intentional cyclists. In: Cycling Societies: Innovations, Inequalities and Governance. UK: Taylor & Francis; 2021. 46. Morgan N. Cycling infrastructure and the development of a bicycle commuting socio-technical system: the case of Johannesburg. 2019; 47. Morgan N. The stickiness of cycling: Residential relocation and changes in utility cycling in Johannesburg. J Transp Geogr. 2020 May;85:102734. 48. Jennings, Gail, Behrens, Roger, Venter, Christo, Zuidgeest, Mark. Scoping Study: Transport and Social Exclusion in African Cities – South Africa Scoping Study Report. University of Cape Town, University of Pretoria, INTALinC; 2018. 49. Kraus S, Koch N. Effect of pop-up bike lanes on cycling in European cities. ArXiv200805883 Phys Q-Fin [Internet]. 2020 Sep 5 [cited 2020 Dec 10]; Available from: http://arxiv.org/abs/2008.05883 50. Peden, M; Kobusingye, O. Transport and Health during and after COVID-19: an insight. High Volume Applied Research / UKAID; 2020. 51. Lydon, Mike. Tactical Urbanism: a tool for crisis management? TUMI/NUMO; 2020. 50 FINAL REPORT: Learning from COVID-19 pop-up bicycle infrastructure: an investigation into flexible and user-led bicycle planning in Cape Town, Nairobi, and Kampala 52. Japan International Cooperation Agency. Master Plan for Urban Transport in the Nairobi Metropolitan Area in the Kenya. 2006. 53. Nairobi City County. The Project on Integrated Urban Development Master Plan for the City of Nairobi in the Republic of Kenya. Final Report. Part II: The Master Plan. Nairobi City Council; 2014. 54. NTU International. NMT Strategy and Plan for the City of Nairobi: Final Report. 2019. 55. Five ‘take-homes’ from a Masterclass on Transport Justice [Internet]. Lisa Kane. 2018 [cited 2021 Feb 17]. Available from: https://www.lisakane.co.za/five-take-homes-from-a-masterclass-on-transport-justice/ 56. Mitullah, W, Khayesi, Melecki, Vanderschuren, M M. NMT integration into Urban Planning in Africa. 2017. 57. City of Cape Town. Cycling Strategy for the City of Cape Town: Policy Number 55219. 2017. 58. Janmohammed, Aliasgher. Unpacking road safety at a district level: the case of Cape Town, South Africa. University of Cape Town; 2017. 59. The stickiness of cycling: Residential relocation and changes in utility cycling in Johannesburg - ScienceDirect [Internet]. [cited 2021 Feb 16]. Available from: https://www.sciencedirect.com/science/article/abs/pii/S0966692319306787 60. Petzer, B. A Contextual Analysis of Cycling Environment Assessment Tools in a Cape Town Mobility Corridor. 2016. 61. Nairobi City County Government. Nairobi NMT Policy. Nairobi City County Government; 2015. 62. Osuret J, Namatovu S, Biribawa C, Balugaba BE, Zziwa EB, Muni K, et al. State of pedestrian road safety in Uganda: are interventions failing or absent? [Internet]. Scientific Communication and Education; 2019 Aug [cited 2021 Feb 1]. Available from: http://biorxiv.org/lookup/doi/10.1101/736488 63. UN U. UN eyes bicycles as driver of post-COVID-19 ‘green recovery’ [Internet]. United Nations. United Nations; [cited 2020 Dec 28]. Available from: https://www.un.org/en/coronavirus/un-eyes-bicyclesdriver-post-covid-19-%E2%80%98green-recovery%E2%80%99 64. 2020: cycling as a countermeasure to fight COVID | ECF [Internet]. [cited 2021 Jan 6]. Available from: https://ecf.com/news-and-events/news/2020-cycling-countermeasure-fight-covid 65. Traffic Management Act 2004: network management in response to COVID-19 [Internet]. GOV.UK. [cited 2020 Dec 29]. Available from: https://www.gov.uk/government/publications/reallocating-road-space-inresponse-to-covid-19-statutory-guidance-for-local-authorities/traffic-management-act-2004-networkmanagement-in-response-to-covid-19 66. Cycle infrastructure design (LTN 1/20) [Internet]. GOV.UK. [cited 2020 Dec 29]. Available from: https://www.gov.uk/government/publications/cycle-infrastructure-design-ltn-120 67. Coronavirus: How pandemic sparked European cycling revolution. BBC News [Internet]. 2020 Oct 2 [cited 2020 Dec 31]; Available from: https://www.bbc.com/news/world-europe-54353914 68. The Fight Over Berlin’s Temporary Bike Lanes - Bloomberg [Internet]. [cited 2021 Jan 21]. Available from: https://www.bloomberg.com/news/articles/2020-10-13/the-fight-over-berlin-s-temporary-bike-lanes 69. COVID-19 Cycling Measures Tracker | ECF [Internet]. [cited 2021 Feb 22]. Available from: https://ecf.com/dashboard 51 FINAL REPORT: Learning from COVID-19 pop-up bicycle infrastructure: an investigation into flexible and user-led bicycle planning in Cape Town, Nairobi, and Kampala 70. Find Mobility Responses - COVID Mobility Works [Internet]. [cited 2021 Jan 21]. Available from: https://www.covidmobilityworks.org/find-responses?mode-types=changes-to-publicspace&approaches=changes-to-public-space&types=public-sector-action&modes=bicycle 71. What is the difference between a trial and a pilot? | APM [Internet]. [cited 2021 Jan 6]. Available from: https://www.apm.org.uk/resources/find-a-resource/what-is-the-difference-between-a-trial-and-a-pilot/ 72. Mobycon [Internet]. Mobycon. 2020 [cited 2021 Jan 4]. Available from: https://mobycon.com/updates/space-for-cycling-in-uganda-planning-a-network-of-pop-up-bike-lanesin-jinja-uganda/ 73. van der Kloof, Angela, van Triest, Jelle, Eikmans, Luuk. A network of pop-up bike lanes in Jinja, Uganda: Opportunities & Advice. Mobycon and Cycling out of Poverty Foundation; 2020. 74. Irlam, J. Barriers to cycling mobility in Masiphumelele, Cape Town. 2016. 75. Hitge G, Van Dijk ENR. Incremental approach to public transport system improvements [Internet]. Document Transformation Technologies; 2012 [cited 2021 Feb 16]. Available from: https://repository.up.ac.za/handle/2263/20420 76. Officers deployed to patrol Cape cycle lane [Internet]. [cited 2021 Jan 27]. Available from: https://www.iol.co.za/capeargus/news/officers-deployed-to-patrol-cape-cycle-lane-11559493 77. Wheels come off cycle lane project [Internet]. [cited 2021 Feb 16]. Available from: https://www.dailyvoice.co.za/news/wheels-come-off-cycle-lane-project-9474874 78. Brooks JHM, Tingay R, Varney J. Social distancing and COVID-19: an unprecedented active transport public health opportunity. Br J Sports Med [Internet]. 2020 Sep 7 [cited 2020 Dec 10]; Available from: https://bjsm.bmj.com/content/early/2020/09/06/bjsports-2020-102856 79. South Africa | GRSP | Global Road Safety Partnership [Internet]. [cited 2021 Jan 27]. Available from: https://www.grsproadsafety.org/programmes/countries/south-africa/ 80. Kenya [Internet]. GRSP | Global Road Safety Partnership. [cited 2021 Jan 27]. Available from: https://www.grsproadsafety.org/programmes/countries/kenya/ 81. Call for Better Cycle Lanes: Albert Road | Bicycle Cape Town [Internet]. [cited 2021 Jan 27]. Available from: http://www.bicyclecapetown.org/2012/07/better-cycle-lanes-albert-road/ FINAL REPORT: Learning from COVID-19 pop-up bicycle infrastructure: an investigation into flexible and user-led bicycle planning in Cape Town, Nairobi, and Kampala APPENDIX A: PROJECT SCHEDULE The main activities and approach of the project are outlined below. 1. Identify key LIC stakeholders, city/government officials and participants for each city; 2. Establish a stakeholder and expert reference group (all cities), for regular online and in-person engagement, with all COVID-19 protocols observed. The intention is to establish this group (bicycle users, advocacy groups, and infrastructure practitioners) at the outset, to provide input into all aspects of the project. This will help ensure the acceptance and viability of the project’s recommendations, and add substantial additional value to the project team; 3. Obtain background data on peak travel demand for all modes for Cape Town (as a demonstration project), and data for the LIC cities where the proposal would be tested. 4. Develop indices for the proposed assessment matrix; 5. Use online maps and local knowledge to identify streets with sufficient capacity to provide pop-up bike lanes; 6. Construct a rudimentary model to help assess likely changes in mode share for the corridors being considered; 7. From available learning resources, knowledge and experience, fast-track innovative options, and successes elsewhere, to identify and prepare best case scenarios in terms of options for the corridors under consideration, streets and measures, and an options list; 8. Conduct a review with the reference group where possible; 9. Continue with the items above for LIC cities and conclude paying due regard to comments and changes suggested from presentations made; 10. Hold preliminary webinar or similar to discuss the findings recommended for infrastructure changes, likely benefits, and the way forward; 11. Investigate, identify and document examples of statutory and regulatory changes made to support pop-up bicycle infrastructure elsewhere as well as possible corresponding LIC requirements with respect to changes to infrastructure as well as format, and structures that need to be consulted; 12. Document available details for proposed pop-up infrastructure implementation in terms of installation, ‘how-to’ for measures, maintenance requirements, repair and renewals, methods and costs; 13. Document timelines and processes required, including M&E; 14. Prepare final documents, liaise with client, agree any changes required, modify and submit for approval and paper. FINAL REPORT: Learning from COVID-19 pop-up bicycle infrastructure: an investigation into flexible and user-led bicycle planning in Cape Town, Nairobi, and Kampala FINAL REPORT: Learning from COVID-19 pop-up bicycle infrastructure: an investigation into flexible and user-led bicycle planning in Cape Town, Nairobi, and Kampala APPENDIX B: STAKEHOLDER QUESTIONS (GUIDE) Questions around cycling behaviour: • Where do you cycle as your mode of transport, and why do you choose that route? • Where do you think there should be bicycle lanes, and why? • On what routes are there current volumes of people cycling as a mode of transport? • Where are they leaving from? • Where are they going to? • Is this the route they would most like to take, or is this the best route given a lack of alternatives? • Who are the cyclists? (men, approx age, women, approx age, workers, socio-economic, trip purpose etc) • What sort of distances are they travelling? • What sort of work are they travelling to undertake? • What travel times? • Do they cycle the entire trip, or do they cycle to public transport interchanges? • Would there be more cyclists if cycles were cheaper/free/safer? • If we were to suggest temporary, or trial bicycle lanes, that would serve your cycling needs, where would you suggest? Any possibility of a map? • What are the traffic volumes on the routes they cycle on? • Is there an interest in commuter cycling among a similar cohort of people - not necessarily on this route – but where people do not ride because of barriers of ownership of bicycles? • Among people who may wish to cycle but do not - how do they currently travel, and what sort of distances? • Have people expressed a desire for a particular route/intervention, that has been ignored (or not) by the relevant authority? • Are these routes on your city’s NMT / bicycle master plan? Questions around bicycle planning These are questions that City authorities are most likely to be able to answer, if we do not know the answers ourselves: • Does the City have a bicycle master plan? • How old is the bicycle master plan? • How were decisions made regarding route/network planning? • How is it implemented? • How often is it revised? • Does the City do bicycle transport counts? FINAL REPORT: Learning from COVID-19 pop-up bicycle infrastructure: an investigation into flexible and user-led bicycle planning in Cape Town, Nairobi, and Kampala • How are decisions made around where to build bicycle infrastructure, if there is not a bicycle master plan? How much of the infrastructure budget is spent on cycling specific infrastructure, not just ‘NMT’?? • If there is not a bicycle master plan, is there an intention to develop one? • What is the role of international agencies / activists in developing bicycle routes? Questions around by-laws These are questions that City authorities are most likely to be able to answer, if we do not know the answers ourselves: • Has the City/County/Province been approached to develop pop-up bicycle infrastructure? • Has the City/County/Province been approached to develop other pop-up infrastructure, such as trading, parklets, sidewalk cafes, etc? Or even Open Streets type events • What are the regulations around such interventions? • Were these relaxed or changed during COVID-19? • Regulations have been relaxed worldwide, in terms of the need to consult the public about proposals; do they think they would be able to follow suit? • If so, what is the intention re returning to previous regulations? ENDS Rahul Jobanputra and Gail Jennings 33 Gaggle Wood Mannings Heath West Sussex, RH136JR Tel: +44 7934941600 Email: rahul@jobanputra.me | gail@gailjennings.co.za Web: www.gailjennings.co.za