Overview
What happens in urban transport in African cities over the next two decades will be a key determinant in global climate change outcomes. The population of Africa doubled to 1.3 billion during the period 1990 to 2020 and is projected to increase by a further 1.2 billion by 2050. TRANSITIONS takes the view that Informal Public Transport (IPT) should (continue to) play a central role in providing sustainable, mass transit within rapidly growing metropolitan areas, and therefore a concerted effort is required to understand how stakeholders can best work together towards improvements.
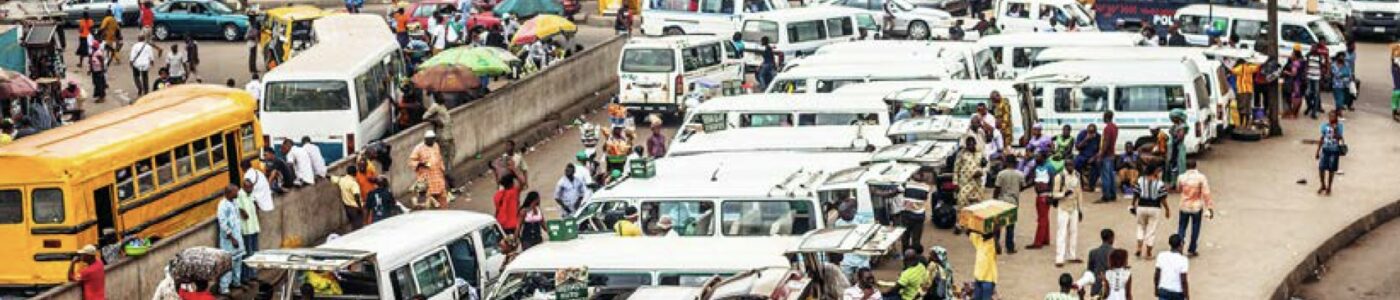
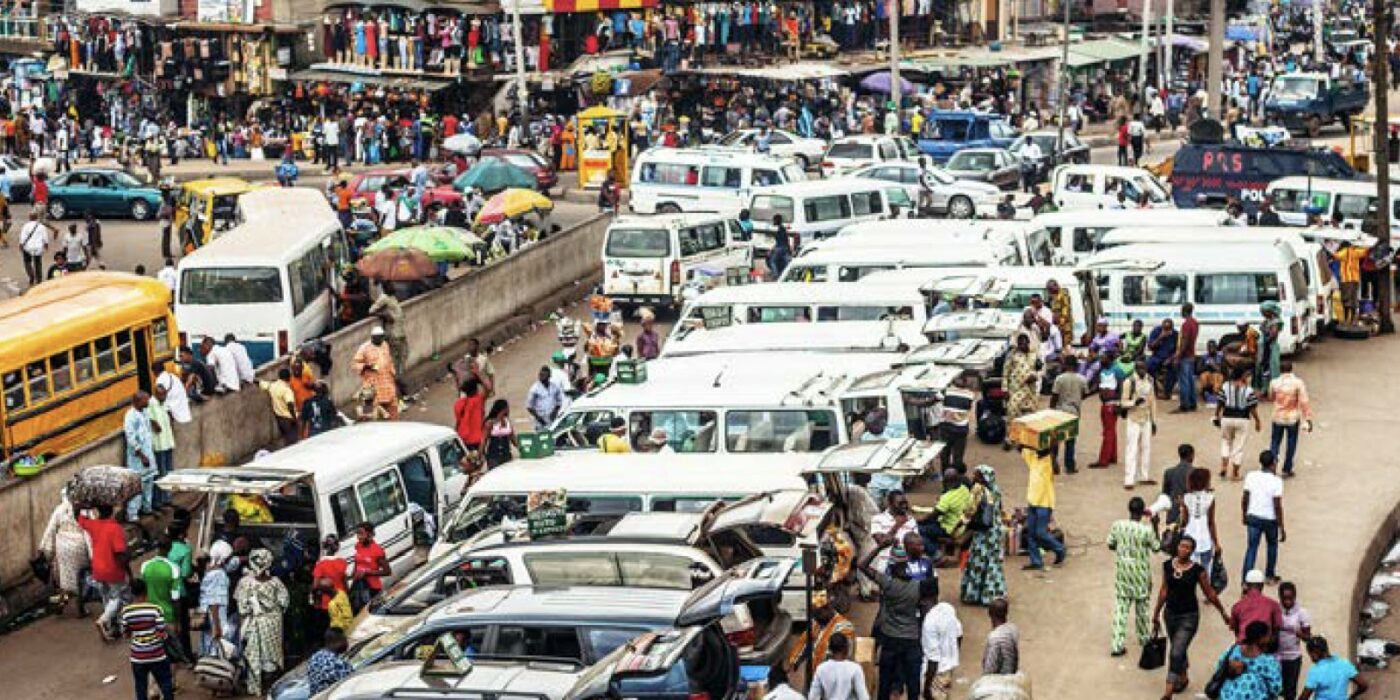
Informal Public Transport (IPT) services often provide benefits seldom associated with scheduled, mass public transport services: IPT business owners are quick to respond to new demands for service, and as a result penetrate many and diverse passenger markets within the city. As the coverage provided by formal Public Transport services is very limited for the majority of cities of Sub-Saharan Africa (SSA), millions of households depend upon IPT in part or in whole to gain access to essential activities located beyond walking distance. Given the unprecedented urbanization forecasts for Sub-Saharan Africa countries over the coming decades, and the pressures this will place on already stretched transport authority capacities and resources, the ability of IPT to respond rapidly to new patterns of demand is likely to be an important asset.
This demand-responsiveness in service provision is currently achieved free of subsidisation by public authorities.
A further important benefit of IPT services is their ability to offer a source of income generation to a segment of the population that often finds itself superfluous to the formal economy.
The benefits of IPT outlined above are, however, often accompanied by substantial problems. Most of these problems can be linked to both ease of market entry, which in some instances may be entirely self-regulated through route or driver associations, and the capacity of transport authorities to formulate and enforce coherent regulatory regimes.
This has led to an over-supply of IPT on more lucrative routes and, in the absence of effective law enforcement, to attempts to violently remove competitors and unsafe driver behaviour.
A combination of factors including fuel inefficiency of old and poorly maintained vehicles, payment of taxes and fees (together with corruption), as well as faresetting by public authorities, results in tenuous business viability for operators.
Poor viability has in turn resulted in overloading of passengers on the most popular routes, and the withdrawal of services from less lucrative routes or times of the day.
The labour conditions for vehicle crews and manner in which they are paid can also be exploitative.
Vehicles used for providing IPT are often unroadworthy, unsafe and heavy emitters of air pollutants.
Boarding and alighting practices that spill into traffic lanes and onto pavements, reduce already limited road capacities considerably and present dangers to vulnerable road users.
These externalities of IPT have resulted in a poor image and attempts by public authorities to eradicate them (through bans or forced co-option within formal PT structures).
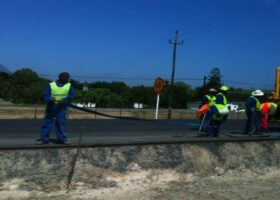
TRANSITIONS proposes that in city contexts where IPT services typically hold the majority of the public transport modal share, this is neither pragmatic nor strategic. Even in the limited examples where alternative high-capacity formal public transport schemes have been delivered, such as the Bus Rapid Transit (BRT) services in Cape Town and Dar-esSalaam, these currently serve only a small proportion of the overall population. Whether in parallel with formal PT projects, or as an alternative approach, there is a strong case for improving, or ‘transitioning’ IPT services, their comfort, reliability, safety, and sustainability.
Publications with the same themes


Publications with the same study countries
Related news & events

Blog
Blog
Blog
PDF content (text-only)
Informal Public Transport Routemap & city comparative analysis February 2023 TRANSITIONS Project Supporting transitions towards low carbon, affordable and safe urban mobility working with the Informal Public Transport (IPT) sector www.hvt-transitions.info Authors TRANSITIONS This research was funded by UKAID through the UK Foreign, Commonwealth & Development Office under the High Volume Transport Applied Research Programme, managed by DT Global. The views expressed in this report do not necessarily reflect the UK government's official policies. Tim Durant (Vectos | part of SLR); Roger Behrens and Mark Zuidgeest (University of Cape Town); Marion Hoyez and Simon Saddier (Transitec); Herrie Schalekamp and Jeffrey Turner (independent consultants) Contributors: JoaquÃn Romero de Tejada (Mozambique Mobility Observatory), Charles Adams and Kwame Kwakwa Osei (Kwame Nkrumah University of Science and Technology), Ansumana Tarawally and Joseph Macarthy (Sierra Leone Urban Research Centre), Mamaa Grant Monney (Transitec); Michael Johnson (independent consultant). Acknowledgements: The TRANSITIONS consortium partners would like to express our gratitude to Brendan Finn (independent consultant) for his involvement, thoughtful contributions and peer review of outputs throughout the project. 1.1 Benefits, problems and the case for working with the Informal Public Transport sector ...................................... 1 1.2 Purpose of the Routemap and City comparative analysis ............................................................................................... 3 1.3 Why we use the term Informal Public Transport ................................................................................................................................ 4 1.4 Introducing the Routemap framework ...................................................................................................................................... 5 Policy objectives and evidence Routemap stages and markers IPT knowledge and actions Section 1: Towards a transition in Informal Public Transport Route Marker 1 – Objectives & Plans: What objectives and plans have been agreed by the IPT industry and public authorities? ................................................................................................................................................................................... 10 Route Marker 2 - Regulation: Do we have core aspects of IPT regulation and enforcement in place? ............. 12 Route Marker 3 - Infrastructure: What basic infrastructure improvements would deliver the greatest benefits for IPT? ........................................................................................................................................................................................................... 14 Route Marker 4 - IPT Business Development: How can the business case and professionalisation of the IPT industry be supported? ......................................................................................................................................................................... 16 Route Marker 5 - Fleet maintenance and driver training: What can we do to achieve our objectives in the short-term, with existing vehicles? .................................................................................................................................................. 18 Route Marker 6 - Passenger information & services: What are the priority improvements that can be made for passengers? ....................................................................................................................................................................................... 20 Route Marker 7 - Transfer & upscaling: What are the next stages working with IPT? ............................................... 22 4.1 Informal Public Transport regulation & enforcement ......................................................................................................... 52 4.2 Public Transport status and degree of integration with the informal sector .......................................................... 58 4.3 Organisational and financial models of the informal transport sector ..................................................................... 61 4.4 Labour conditions and remuneration ....................................................................................................................................... 66 4.5 Engagement between government and the Informal Public Transport industry ................................................. 69 Section 5: Actions for clean, affordable and safe 'informal' public transport 5.1 Infrastructure and operations ...................................................................................................................................................... 73 5.2 Network management and Urban Vehicle Access Regulations................................................................................... 77 5.3 Fleet and fuel........................................................................................................................................................................................ 78 5.4 Business development.................................................................................................................................................................... 82 5.5 Digital passenger services ........................................................................................................................................................... 86 Contents Section 2: Proposing a route to low carbon, affordable and safe mobility Section 3: Context and evidence on benefits & problems 3.1 Attitudes and existing policy positions ................................................................................................................................... 24 3.2 Understanding Informal Public Transport network characteristics ......................................................................... 28 3.3 Affordable mobility ......................................................................................................................................................................... 33 3.4 Access to education, jobs and leisure ................................................................................................................................... 36 3.5 Passenger safety, sexual harassment and personal security .................................................................................... 40 3.6 Mobility for disabled people ....................................................................................................................................................... 44 3.7 Air quality and GHG emissions ................................................................................................................................................. 47 Section 4: Institutional and Organisational Characteristics Conclusions List of Figures Figure 1 - TRANSITIONS Routemap Summary Diagram ...................................................................................... 5 Figure 2 - TRANSITIONS Policy Objectives and related evidence gathering ....................................... 5 Figure 3 - Main stages of a route to low carbon, affordable and safe IPT ......................................... 6 Figure 4 – TRANSITIONS Routemap Key Diagram ................................................................................................. 7 Figure 5 - The 'regulatory cycle' (adapted from Gwilliam 2008) ............................................................. 25 Figure 6 - Mode used before entering the IPT vehicle - Kumasi .............................................................. 30 Figure 7- Income levels of respondents to the passenger opinion survey in Freetown ......... 34 Figure 8 - Fare satisfaction in Accra and Cape Town (where 1 is very unhappy and 5 is very happy) ................................................................................................................................................................................................. 35 Figure 9 - Contrasting proportions of female and male passengers in Cape Town and Kumasi ................................................................................................................................................................................................ 36 Figure 10 - IPT trip purposes by gender - Maputo .............................................................................................. 37 Figure 11 - Differences in perceptions of passenger safety between Accra and Freetown ... 41 List of Tables Table 1 - Weighing the pros and cons of Informal Public Transport Table 2 - Overview of IPT network, fleet and operational characteristics in the case cities Table 3 - Overview of IPT regulation in the case cities Table 4 - Overview of types of transport coordination and integration in the case cities Table 5 - Overview of IPT organisation and remuneration approaches in the case cities 6 30 54 59 62 01 Towards a transition in 'informal public transport' 1.1 Benefits, problems and the case for working with the Informal Public Transport sector 1.2 Purpose of the Routemap and City comparative analysis 1.3 Why we use the term Informal Public Transport 1.4 Introducing the Routemap framework IPT business owners are quick to respond to new demands for service, and as a result penetrate many and diverse passenger markets within the city. As the coverage provided by formal Public Transport services is very limited for the majority of cities of Sub-Saharan Africa (SSA), millions of households depend upon IPT in part or in whole to gain access to essential activities located beyond walking distance. Given the unprecedented urbanization forecasts for Sub-Saharan Africa countries over the coming decades, and the pressures this will place on already stretched transport authority capacities and resources, the ability of IPT to respond rapidly to new patterns of demand is likely to be an important asset. This demand-responsiveness in service provision is currently achieved free of subsidisation by public authorities. A further important benefit of IPT services is their ability to offer a source of income generation to a segment of the population that often finds itself superfluous to the formal economy. 1.1 Benefits, problems and the case for working with the Informal Public Transport sector This has led to an over-supply of IPT on more lucrative routes and, in the absence of effective law enforcement, to attempts to violently remove competitors and unsafe driver behaviour. A combination of factors including fuel inefficiency of old and poorly maintained vehicles, payment of taxes and fees (together with corruption), as well as faresetting by public authorities, results in tenuous business viability for operators. Poor viability has in turn resulted in overloading of passengers on the most popular routes, and the withdrawal of services from less lucrative routes or times of the day. The labour conditions for vehicle crews and manner in which they are paid can also be exploitative. 1 The benefits of IPT outlined above are, however, often accompanied by substantial problems. Most of these problems can be linked to both ease of market entry, which in some instances may be entirely self-regulated through route or driver associations, and the capacity of transport authorities to formulate and enforce coherent regulatory regimes. What happens in urban transport in African cities over the next two decades will be a key determinant in global climate change outcomes. The population of Africa doubled to 1.3 billion during the period 1990 to 2020 and is projected to increase by a further 1.2 billion by 2050. TRANSITIONS takes the view that Informal Public Transport (IPT) should (continue to) play a central role in providing sustainable, mass transit within rapidly growing metropolitan areas, and therefore a concerted effort is required to understand how stakeholders can best work together towards improvements. Informal Public Transport (IPT) services often provide benefits seldom associated with scheduled, mass public transport services: Vehicles used for providing IPT are often unroadworthy, unsafe and heavy emitters of air pollutants. Boarding and alighting practices that spill into traffic lanes and onto pavements, reduce already limited road capacities considerably and present dangers to vulnerable road users. These externalities of IPT have resulted in a poor image and attempts by public authorities to eradicate them (through bans or forced co-option within formal PT structures). TRANSITIONS proposes that in city contexts where IPT services typically hold the majority of the public transport modal share, this is neither pragmatic nor strategic. Even in the limited examples where alternative high-capacity formal public transport schemes have been delivered, such as the Bus Rapid Transit (BRT) services in Cape Town and Dar-esSalaam, these currently serve only a small proportion of the overall population. Whether in parallel with formal PT projects, or as an alternative approach, there is a strong case for improving, or 'transitioning' IPT services, their comfort, reliability, safety, and sustainability. 2 Taking the key concern of Greenhouse Gas emissions and localised air pollution as an example, TRANSITIONS found that the fuel consumption of IPT vehicles ranges from 50% greater than manufacturers' specifications, to as much as double or even triple the amounts in manufacturers' claims. The EU upper limit emissions target for vans in the period 2020-2024 is 147gCO2/km, less then half the amount calculated for typical lower order consumption figures for vehicles in Freetown (319 gCO2/km), Maputo (404gCO2/km) and Cape Town (686gCO2/km). Any proportional reduction in fuel consumption, through better maintenance of the existing fleet, improved road conditions and driving practices, would already deliver the same proportion of reduced emissions, including air-borne emissions that impact negatively on the healths of IPT drivers and passengers, as well as other road users and the public at large. Given that there is an estimated 3 – 10million informal transport vehicles currently operating intensively, and on a daily basis across SSA (a large proportion of which are IPT vehicles [i]), the potential positive benefits could be enormous. [i] Fortune, G., 2021 (Draft – forthcoming) Informal Transportation & Decarbonization V1.4 – paper refers to an ambitious and crude attempt to size the Informal Transport sector in SSA, based on available information from 25 locations (cities and countries). The information is not consistent in terms of the forms of 'informal transport' included in the total figure. For example, in some cases motorcycles or taxis were excluded. The TRANSITIONS project set itself the dual challenge of: seeking to better understand the IPT sector; and to present a Routemap for how public authorities in SSA, IPT unions and associations, and the international community can work together towards a clean, affordable and efficient and safe transport network, with IPT as a core element. This Routemap guidance brings together the findings from literature review, stakeholder interviews, passenger opinion surveys and vehicle fuel consumption surveys, in order to present the following: 1.2 Purpose of the Routemap and City comparative analysis A proposed 'route' towards improved IPT services, comprising a sequence of stages that could provide the basis for a smaller pilot project or larger, cost-effective programme for affordable, collective mobility. A series of self-appraisal questions, that will assist practitioners in understanding the current situation in their city and degree of preparedness to move forward through the steps of the Routemap. Provision of background knowledge on key themes relating to IPT, combined with comparative analysis of the situation in the TRANSITIONS case cities: Accra, Cape Town, Freetown, Kumasi and Maputo. Set out main messages resulting from the research for practitioners and the international community. Signpost to other useful resources that provide further information and guidance on important themes. 3 Transitioning the policy debate, stakeholder relations and informal transport services for a low carbon future While there are many forms of 'informal transport', such as motor-cycle and threewheeler taxis, the focus of TRANSITIONS has been on services that are typically provided by midi- and mini-buses and occasionally by sedan vehicles. These larger vehicles are generally shared by multiple passengers along set routes and are, therefore, more similar to formal PT than informal taxi services where the passenger dictates the destination. IPT services are known by different names, such as the poda-podas of Freetown (shown in Figure 1), chapas of Maputo, trotros of Accra and Kumasi, and minibustaxis of Cape Town. The correct terminology to describe the services discussed in this report has been the subject of considerable debate in recent years, with different authors favouring terms ranging from 'informal transport', 'intermediate transport', 'paratransit', 'popular transport', 'shared transport', to 'artisanal' (in francophone Africa). None of these terms provides a perfect description of the subject field. The TRANSITIONS project uses the term Informal Public Transport (IPT) for consistency, and recognises that there may be instances where the services in question are not strictly 'informal' (i.e., in the sense that they are compliant with both government operating regulations and taxation policies). 1.3 Why we use the term Informal Public Transport 4 Poda-poda Kekeh Taxi Okada The TRANSITIONS Routemap Summary and Key Diagrams (Figures 2 & 5) provides an overview of the 'route' stages, as well as an index to navigate to sections of this report that provide further background information. It is made up of three main elements, as described below. 1.4 Introducing the Routemap framework 5 When preparing a Sustainable Urban Mobility Plan (SUMP) or project involving IPT, relevant policy objectives would be expected to include: mobility, affordability (of transport), employment generation, operational efficiency, low carbon emissions, inclusivity, as well as safety and comfort. IPT can be viewed as already providing substantial benefits with respect to objectives of delivery mobility at a (relatively) affordable level, and in terms of generating employment. The sector also results in important disbenefits and externalities, but a proactive approach to working with the IPT sector presents opportunities to minimise these. Figure 3 shows this Policy Objective element of the Routemap, together with the relevant subsections of this report (green boxes) that set out information and evidence gathered through the TRANSITIONS research in relation to these. Table 1 provides a summary of the pros and cons of IPT. Figure 1 - TRANSITIONS Routemap Summary Diagram Figure 2 - TRANSITIONS Policy Objectives and related evidence gathering Background knowledge and research insights relating to institutional and organisational actions are shown above the central Routemap arrow. These cover aspects relating to public authorities (Section 4) and the IPT sector (Section 5). Actions that can be taken in relation to infrastructure, vehicle fleet and provision of digital services are shown below the central Routemap arrow. Further information on these is provided in Section 6 of the guidance. IPT knowledge and actions The third and fourth main components of the Routemap Key Diagram comprises the IPT themes and actions that are set out in further detail in Sections 4 and 5 of this guidance. The violet boxes depict those relating to regulatory actions of public authorities, as well as the organisational and business characteristics of the IPT sector. Actions relating to infrastructure, fleet, training of crew and digital service improvements are shown in the blue boxes. These are arranged to show these relate to policy themes and how certain types of actions result are linked and can result in synergies. Routemap stages and markers The central arrow or spine of the Routemap Key Diagram shows the main stages of an approach to working collaboratively with the IPT section (Figure 4). These stages, or 'route markers' are posed as questions and related self-appraisal questions are set out in Section 2 of this report. Figure 3 - Main stages of a route to low carbon, affordable and safe IPT Policy objective Cons & externalities Pros & opportunities Mobility provision IPT accounts for largest share of motorised mobility in the cities of Sub-Saharan Africa. Affordable mobility Although relatively low cost, IPT is still expensive for low income groups (significant portion of monthly income). IPT currently taxed/charged rather than subsidised. Review of fare setting and financial support opportunities should be undertaken. Employment Employment within sector can be fragile and exploitative, even while providing crucial jobs. Existing IPT unions can be supported in their work to provide fare salaries, health insurance and planning for old age. Operational efficiency Inclusive Low carbon emissions & air quality Safety On-street competition leads to congestion and road safety problems. IPT far better than current alternatives (e.g. motorcycle taxis) and high potential for improvement through basic regulation and enforcement. Old and poorly maintained vehicles have low fuel efficiency and are highly polluting, contributing to local air quality and health concerns. Improved maintenance regimes could achieve significant short-term benefits, with potential for fleet renewal and alternative fuels in the medium and long-term. Passengers have limited choice and can be 'pushed' to board certain vehicles. Sexual harassment is known to occur. IPT crews receive limited or no training and professionalisation of the sector could assist. IPT provides mobility with goods for traders and fleet renewal could improve opportunities for mobility impaired people. Old, sometimes retrofitted vehicles, combined with poor driving, result in unsafe conditions. Improved salary conditions and regulation of competition, plus fleet renewal, could achieve significant improvements. Table 1 - Weighing the pros and cons of Informal Public Transport 7 Figure 4 – TRANSITIONS Routemap Key Diagram 02 Proposing a route to low carbon, affordable and safe mobility The central spine of the Routemap is based upon a sequence of steps that are, in essence, about getting the basics right. These steps, referred to as Route Markers, could form the basis of smaller scale pilot projects, involving public authorities working with the IPT industry to understand what actions will support the sector to operate to its best potential. Equally, in situations where IPT involvement in major public transport schemes such as Bus Rapid Transit (BRT) is already envisaged [1], then selected steps can be viewed as both: instrumental to the eventual success of the main project; and preconditions for professionalisation of the existing IPT industry. Moving from the current context and operational model of IPT to the types of contracts typical of formalised public transport can involve a huge leap 9 While on the surface these Route Markers may seem simplistic, in this section we briefly explain why they are so important. Each Route Marker is accompanied by one or more selfappraisal questions, that will enable a practitioner to quickly gauge what they consider to be the current situation in a city or metropolitan area, and what they consider to be the most important actions to take. We also provide links to the more in-depth background material and cross-city comparisons in Sections 3 – 5 (these connections are also illustrated in the Routemap diagram). The Route Markers are arranged in a logical sequence, with emphasis first on actions where a public authority could take the lead, followed by those where the IPT industry also take on greater responsibilities. In reality, the sequence followed will depend on local circumstances, such as the existing condition of infrastructure and the level of professionalisation of the IPT industry. It is evident from the TRANSITIONS research that there are numerous potential causes of mistrust between public authorities and the IPT sector. These can include a combination of factors that accumulate over time, including: differing political alignments; a perception that governments wish to eliminate the sector; a perceived 'imposition' of regulations and major public transport schemes, with limited consultation; a lack of enforcement of existing regulations and/or corruption; a lack of transparency of cashbased businesses (with implications for taxation); and carrying out of illegal (nonlicensed) IPT operations, etc. From the perspective of public authorities, there is a need to recognise the value and benefits the IPT sector delivers in terms of affordable mobility, employment, etc.; and the cost effectiveness of working with the sector to overcome problems (e.g. air pollution, road safety). Route Marker 1 – Objectives & Plans: What objectives and plans have been agreed by the IPT industry and public authorities? 10 Section 3.1 of the full document - 'Attitudes towards IPT and existing policy positions'. This should be undertaken taking into account the comparative costs of alternative options. Section 3 of this report sets out background information and evidence of benefits and externalities of the IPT industry. For the IPT sector itself there is an opportunity to benefit from improved infrastructure and vehicle investment opportunities, while also providing more stable income and long-term job prospects for the workforce, as addressed in Sections 4 and 5 of this report. For further background information please see: SELF APPRAISAL Objectives & Plans: What objectives and plans have been agreed by the IPT industry and public authorities? Q1. HOW WOULD YOU CLASSIFY THE CURRENT POLICY POSITION AND PLANS FOR IPT IN YOUR CITY? (SELECT ALL THAT APPLY) There are plans to replace all (or a substantial proportion) of IPT with formal Public Transport schemes. There are plans to replace IPT with formal Public Transport on one or more key corridors (IPT may continue to provide feeder services) There are plans to replace IPT services with formal Public Transport on one or more key corridors, which will be operated by former IPT associations/unions (IPT may also continue to provide feeder services) There are plans to support operational improvements of IPT through infrastructure improvements (terminals, road, roadspace prioritisation) There are plans to support operational improvements of IPT through fleet improvements/renewal There are plans to support operational improvements of IPT through business development and/or staff welfare schemes There are plans to support operational improvements of IPT through deployment of digital technology (e.g. journey planning apps, Cashless Fare Collection etc.) Q2. HOW WOULD YOU ASSESS THE RELATIONSHIP AND EXTENT OF ENGAGEMENT BETWEEN THE GOVERNMENT AND THE INFORMAL TRANSPORT OPERATORS IN YOUR CITY? ENGAGEMENT BETWEEN PUBLIC AUTHORITIES AND THE IPT SECTOR ROBUSTLY ADDRESSES: (SELECT ALL THAT APPLY) Fare setting IPT regulation Development of mobility objectives and plans for the city Introduction of formal public transport schemes Fleet renewal schemes Professionalisation of the ITP sector Q3. DOES THE IPT SECTOR HAVE AN UMBRELLA UNION OR ASSOCIATION THAT CAN REPRESENT ITS INTERESTS AT A METROPOLITAN OR NATIONAL LEVEL? Yes No Other (describe) Route Marker 2 - Regulation: Do we have core aspects of IPT regulation and enforcement in place? 12 Section 4.1 of the full document - 'IPT regulation & enforcement' IPT is typically subject to different forms of quantity (route licensing) and quality (driver licensing and vehicle inspections) regulation, although the adequacy of enforcement can vary substantially. Establishing route (and in some instances area) licensing and enforcing this well is viewed as a fundamental element of a well-functioning system, whether a public authority intends to undertake a smaller scale pilot project or introduce new formal public transport services on specific corridors. As the experience from Accra and Kumasi suggests, inadequate enforcement of route licensing results in illegal operations, over-supply on popular routes, and loading of passengers on congested roadsides to skip queues at terminals/stations. All of this means that the operational and business model of established IPT associations and unions is badly undermined. Further background and city case studies of regulation are provided in Section 4. For an introduction to IPT regulatory frameworks, please see: Remaining issues and challenges We have suggested that these Steps could form the basis of a pilot project within a city. In the context of large metropolitan areas with diverse informal transport operators, it would be necessary to shape a collaboration amongst relevant stakeholders for a suitable scale and geographic area, such as a selected mobility corridor. This needs to be undertaken taking into account the areas of overlap and competition amongst IPT unions/associations and the degree to which 'illegal' (non-licensed) operations occur. Remaining issues and challenges Cape Town, Accra, Kumasi and Maputo all have experience of setting and enforcing route licensing. One challenge that remains is that of monitoring IPT operations at timescales that allow for suitable increases (or decreases) in the number of vehicles licensed to operate, in order to balance supply with demand. A further related issue to be addressed, as raised during a TRANSITIONS workshop with representatives from seven cities, is finding an approach to ensure that IPT services are available in less profitable, off-peak periods. SELF APPRAISAL Regulation: Do we have core aspects of IPT regulation and enforcement in place? Q4. HOW WOULD YOU CLASSIFY THE CURRENT REGULATORY FRAMEWORK FOR IPT IN YOUR CITY? (SELECT ALL THAT APPLY) IPT is prohibited/banned from operating in a substantial portion of the city. IPT operates in the city subject to route (or area) licensing that is well enforced. IPT operates in the city subject to driver licensing and vehicle inspection regimes that are well enforced. IPT operates in the city subject to route (or area) licensing that is poorly/unevenly enforced. IPT operates in the city subject to driver licensing and vehicle inspection regimes that is poorly/unevenly enforced. IPT operates in the city in a situation of very limited or no regulatory oversight. Ensuring adequate road surfacing - Poor road surfaces reduce vehicle speeds, fuel efficiency and lifespan, as well as causing discomfort to passengers. IPT associations/unions often deploy older vehicles to routes with poor roads and the motivation to invest in new vehicles is reduced when their condition could quickly deteriorate. Providing space and basic services at terminals – Where terminals/stations have established sites, then support for provision of appropriate surfacing (to avoid muddy conditions), and provision of lighting, toilets, seating and shelter (from sun and rain) for passengers and IPT crews, would make a substantial difference. In many cases, then terminals occupy areas at and around highway junctions, in which case designated space could be planned and provided. Enabling trading activities, while preventing obstruction – Provision should be made for trader activities and storage of materials at terminals, while preventing encroachment on to roadways. Preventing flooding and designing for sustainable drainage – Regular maintenance and desilting of drains is required to avoid needless flooding, while new road and terminal surfacing should be designed according to Sustainable Urban Drainage System (SUDS) principles. Route Marker 3 – Infrastructure: What basic infrastructure improvements would deliver the greatest benefits for IPT? 14 Section 5.1 of the full document - 'Infrastructure and operations improvement'. These include, for example, the provision of priority lanes and measures for IPT that enable improved journey times for public transport services. Further infrastructure actions and case studies for consideration are presented at: IPT operators and passengers have to contend with issues of substandard infrastructure on a daily basis. Relatively basic measures within the competence of highways and traffic authorities, include: SELF APPRAISAL Infrastructure: What basic infrastructure improvements would deliver the greatest benefits for IPT? Q5. BASED UPON A KEY IPT CORRIDOR THAT YOU KNOW WELL, HOW WOULD YOU QUANTIFY AND RATE THE QUALITY OF INFRASTRUCTURE? Percentage of route benefitting from a good quality of road surface, that is well maintained IPercentage of terminals and popular bus stopes with all-weather paving (e.g. preventing muddy conditions) Percentage of terminals and popular bus stops benefitting from seating and shelter Percentage of terminals and popular bus stops with lighting The IPT industry tends to be organised in Unions and/or Route Associations that operate from specific terminals. These often have a formal status, undertaking negotiations with public authorities on behalf of their membership, and sometimes taking on roles relating to the licensing and inspection of vehicles. Some well-organised unions also seek to provide for the long-term welfare of vehicle crews, such as purchasing land for them to construct houses. Growth of cities, combined with lack of regulatory enforcement, has resulted in the formation of large numbers of unions and associations. A wide range of organisational competency levels can therefore be assumed. Unions and 'businesses' are not the same and this can complicate the situation when we consider means to encourage professionalisation within the sector. IPT operators, who carry the primary financial risk, are typically the individual drivers who pay rent to a 'passive' owner. The first commercial priority is to pay the vehicle rent, fuel costs, taxes and fees, as well as essential maintenance. Surplus cash generated then constitutes the income of the driver and crew members. Taking into account that IPT operators generally pay license fees to public authorities (and do not benefit from public subsidies), and also face increasing fuel prices, the business case for operating can be tenuous.The union may charge a fee for membership, but its role is to represent its members and help manage operations at a terminal, not run a profitable business. It may, however, provide a valuable role in organising collective activities such as training and vehicle maintenance. Professionalisation and support for unions or associations may be initiated by a 'top-down' initiative, such as the potential for a union or association to operate a new formalised PT system (as sometimes forms an objective of schemes funded by international lenders); or through a more organic, 'bottom-up' approach, that would complement the pilot scheme approach proposed here. If it is found that defined roles and professional capabilities of the union and route association are not suitably well developed and aligned, then proposing a large and fast 'leap' to formal public transport operators (as advocated in the top-down approach) is very ambitious and negotiations may be strained due to different stakeholders (vehicle owners, drivers, unions and associations) having competing expectations. Equally, the success of fleet renewal initiatives may be compromised are likely to be compromised where professional development has not occurred. The following self-appraisal questions seek to highlight some key competencies and capacities to consider. Route Marker 4 – IPT Business Development: How can the business case and professionalisation of the IPT industry be supported? 16 Section 4.3 of the full document - 'Organisational and financial models of the IPT sector' Section 5.4 of the full document - 'Business development' Section 5.5 of the full document - 'Digital passenger services' Further background information and cross-city comparison can be found at: Actions for consideration are presented at: SELF APPRAISAL IPT Business Development How can the business case and professionalisation of the IPT industry be supported? Q6. BASED UPON A WELL-ESTABLISHED UNION OR ROUTE ASSOCIATION THAT YOU KNOW WELL, WHICH OF THE FOLLOWING COMPETENCIES AND CAPACITIES ARE IN PLACE? (SELECT ALL THAT APPLY) The organisation can provide an up-to-date list of vehicles, owners and drivers registered with the union/association. The organisation has an approach/mechanism to restrict the number of vehicles operating on a specific route, to limit competition and congestion (either independently or in relation to a regulatory role). The organisation has an approach/mechanism in place to ensure that services are provided during off-peak periods. The organisation provides for the long-term welfare of staff, such as through pension, health insurance and/or housing schemes. The organisation has a role in supporting fair income and salaries for all drivers and crew (for example, through collection of income and redistribution as basic salaries). The organisation has a defined business role and is therefore has ultimate responsibility for paying salaries, as well as procuring and maintaining vehicles. Remaining issues and challenges The points presented in this question, together with those relating to fleet maintenance below will help to build key information to support improved understanding of IPT business case: supply of vehicles in relation to demand; fair salaries and welfare provision; vehicle fuel consumption. A primary objective of TRANSITIONS is to consider how Greenhouse Gas (GHG) Emissions, as well as locally harmful air pollutants, can be reduced. This can be achieved through a combination of measures, including better operational efficiency (e.g. reduced congestion and idling at terminals), improved driving practices, better road conditions, and through improving the fuel efficiency of vehicles. Good practice from a climate protection perspective also makes good business sense. Fuel is invariably the single largest cost item in public transport in developing/emerging economies, accounting for as much as half of the total cost. As explained in further detail in Section 3.7, IPT operators often rely on imported, second-hand vehicles, hence fleet renewal schemes are an attractive option. There are, however, substantial improvements that could be achieved in the short-term, through improved maintenance of existing vehicles. As commented during a TRANSITIONS workshop, there is an important difference between the vehicle repair that is undertaken (to ensure it can operate) and vehicle maintenance (to prevent break-downs and improve performance)! It is considered that, through a combination of operational efficiency, driver behaviour, improvements to roads and vehicle maintenance, efficiency improvements in the order of 20% could be achieved. Embedding good vehicle maintenance practices would have the added benefit of developing this capacity amongst operators, unions and associations, helping to secure the success of fleet renewal schemes and prevent the rapid deterioration of new vehicles in the medium to long term. Route Marker 5 - Fleet maintenance and driver training: What can we do to achieve our objectives in the short-term, with existing vehicles? 18 Section 3.7 of the full document - Context and evidence relating to 'Air Quality and GHG Emissions' Section 5.3 of the full document - Actions relating to 'Fleet & Fuel' Section 4.4 of the full document - Background and cross-city comparison relating to 'Labour conditions and remuneration' Section 5.4 of the full document - Actions relating to 'Business development', including safe and efficient driving Further background information, cross-city comparison and actions for consideration relating to IPT fleets are presented at: Related matters covering employment conditions and training for crew members are covered in: SELF APPRAISAL Fleet maintenance and driver training How can the business case and professionalisation of the IPT industry be supported? Q7. WHAT DATA IS BEING COLLECTED ON IPT FUEL CONSUMPTION AND RELATED AIR QUALITY IMPACTS, TO INFORM IMPROVEMENTS, COSTBENEFIT ANALYSIS AND IPT BUSINESS CASE REVIEW? (SELECT ALL THAT APPLY) Fuel consumption and emissions standards at time of vehicle purchase Actual fuel consumption and emissions during the operating life of the vehicle Proportional IPT consumption and emissions compared to other motorised transport Overall transport contribution to city air quality and GHG emissions Tyre inflation is checked on a regular basis (to reduce friction losses) Wheel alignment is checked on a regular basis (to reduce friction losses) Engine and drive-train servicing is undertaken (to ensure best fuel efficiency for age/condition of vehicle) Drivers are provided with training to understand how they can achieve the best fuel efficiency Drivers are monitored (tracked) and offered incentives to help ensure consistent improvements in driving practices. Q8. BASED UPON THE PRACTICES OF A WELL-ESTABLISHED UNION OR ROUTE ASSOCIATION YOU KNOW WELL, WHICH OF THE FOLLOWING ARE UNDERTAKEN TO IMPROVE FUEL EFFICIENCY ? (SELECT ALL THAT APPLY) It is often necessary for the residents of large and rapidly expanding African metropoles to make long, multi-stage journeys to reach their destinations. Results from the TRANSITIONS passenger opinion surveys showed that improvements to basic infrastructure, in particular at the terminals, as well as more comfortable vehicles, are high on passengers' priority lists. These aspects of improving the journey experience are addressed at Route Markers 3 and 5. Further important opportunities relate to two main aspects of passenger care: firstly, the provision of information for journey planning, which can involve application of digital mapping of the route network and delivery of journey planning websites and apps. This may evolve to include provision of efficient on-demand ride-pooling services for passengers, helping to connect and provide transport services for passengers located away from main routes or that need to travel in off-peak periods. And secondly, in relation to providing a welcoming and safe environment for all passengers, including meeting the needs of the mobility impaired (disabled), and proactively addressing issues of sexual harassment. Sexual harassment is a proven problem in relation to all forms of collective transport (this is not limited to IPT and SSA) and can have a major impact on the travel decisions of women, and therefore life decisions (such as where they undertake training or employment options). Route Marker 6 - Passenger information & services: What are the priority improvements that can be made for passengers? 20 Section 3.2 of the full document - providing context information on 'IPT Network characteristics' Section 5.5 of the full document - covering actions for 'Digital passenger services' Section 3.5 of the full document - 'Passenger safety, sexual harassment and personal security' Section 3.6 of the full document - 'Mobility for disabled people' Further information on digital network mapping approaches and journey planning apps can be found at: Gender dimensions in transport and issues of sexual harassment are further explained in: SELF APPRAISAL Passenger information & services What are the priority improvements that can be made for passengers? WHICH OF THE FOLLOWING PROCESSES ARE IN PLACE TO INFORM TRANSPORT PLANNING AND TO DELIVER INFORMATION AND CONVENIENT SERVICES PASSENGERS? (SELECT ALL THAT APPLY) IPT route network mapping, involving onboard surveys and vehicle tracking Preparation and publication of IPT network maps in 'static' form (as paper versions and/or online) Development of web-based, dynamic journey planners (by public authority or in collaboration with private sector) enabling passengers to plan end-to-end travel with formal PT and IPT Provision of digital payment systems for IPT services WHICH OF THE FOLLOWING ACTIVITIES ARE UNDERTAKEN IN ORDER TO ENSURE INCLUSIVE AND SAFE SERVICES, WHERE PEOPLE ARE TREATED WITH RESPECT AND DIGNITY? (SELECT ALL THAT APPLY) Provision is made for those that need to travel with goods, such as traders Training is provided to drivers and crew on the problem and impacts of sexual harassment, and actions that can be taken to minimise problems Training is provided to drivers and crew on the needs of mobility impaired and how these can be accommodated in daily operations Vehicles are adapted or procured in order to improve accessiblity for mobility impaired people Provision of on-demand ride-pooling services, in particular for routes or times where passenger numbers are lower Integration of fares and payment systems for formal Public Transport and IPT Development of customer care and complaints services, with staff contact points at popular terminals an stops, or online through a website or app (such as crowdsourced safety apps). The TRANSITIONS Routemap sets out a proposed approach to foster cooperation between public authorities and IPT stakeholders. The stages could be envisaged as a relatively smallscale pilot working with specific unions or associations, with potential for transfer and upscaling to other parts of the city in the future in order to achieve more widespread benefits. In order to make the self-appraisal scheme more straightforward to answer without further information gathering, some of the questions ask you to focus on transport corridors and unions about which you already have some knowledge. Should the prospect of proceeding with a pilot of this nature be attractive, there are several considerations to take into account in selecting suitable pilot areas, including: Route Marker 7 - Transfer & upscaling: What are the next stages working with IPT? 22 In this section we have provided a brief overview of stages and activities that could be taken forward collaboratively with the IPT sector. In other sections we provide further detail on the background knowledge and actions that could be taken, based on research undertaken by the TRANSITIONS project partners. There remain many areas of research and practice that need to be investigated and developed further, which could be well advanced in collaboration with cities that seek to collaborate with the IPT sector in the manner envisaged, and that subsequently share their experiences can refine the Routemap further. Unions/associations with capacity and capabilities – Route Marker 4 and Question 6 provide an understanding of the competencies that are important to consider in the professionalisation process. Certain unions/associations may already be considered well advanced candidates, but an open call for expressions of interest would present a fair means for selecting good cooperation partners. Geographies and routes – Certain routes/transport corridors may present better opportunities for infrastructure improvements, such as space availability for terminals, or locations with poor road conditions where significant advances could be made. The degree of overlap (and therefore potential for competition) between the operations of unions/associations should also be taken into consideration. 03 Context and evidence on benefits & problems 3.1 Attitudes and existing policy positions 3.2 Understanding Informal Public Transport network characteristics3.3 Affordable mobility 3.4 Access to education, jobs and leisure 3.5 Passenger safety, sexual harassment and personal security 3.6 Mobility for disabled people 3.7 Air quality and GHG emissions Informal Public Transport performs a valuable role in the cities of Sub-Saharan Africa, but suffers from a negative image that has even led to city-wide bans on some occassions. Changing attitudes towards the industry, and the introduction of positive policy positions and frameworks, are required in order to maximise benefits and reduce the problems that do occur. In the previous section we outlined a 'route' towards low emission, affordable and safe mobility working with the IPT sector. Route Marker 1 requires public authorities and the IPT sector to reach agreement on common goals and the means to achieve this, which may require shifts in attitudes on both sides of the table. 24 Taking a fresh look at policy objectives and information relating to the current situation, as well as evidence regarding what could be achieved in the future, can play a powerful role in changing attitudes and opinions. In this section we provide background information and cross-city comparison based on TRANSITIONS research, in relation to existing attitudes and policy positions, IPT network characteristics, as well as the benefits and problems associated with IPT. 3.1 Attitudes and existing policy positions Background The attitudes of public authorities towards Informal Public Transport (IPT), and the policy positions they adopt, can vary considerably. Decisions can be taken to prohibit IPT, banning informal transport services for reasons that can include the desire to reduce competition for formal public transport. Public authorities may also seek to co-opt IPT within formal Public Transport (PT) structures, denying operating licenses for those not satisfied with conditions offered. For example, during the summer 2020, a general ban was imposed on IPT operations in Harare, Zimbabwe. The national government required that operators affiliate with the state-owned PT entity Zupco. Some operators decided to affiliate with Zupco, while others remain outside this system and are deemed illegal. Many public authorities choose to recognise and regulate IPT to some degree, with common approaches including route licensing and fare setting, as is the case in the TRANSITIONS case studies. Another approach is that of acceptance, where IPT operates with minimal governmental oversight or intervention[2]. Whether this latter option is the result of a conscious decision or limited public resources is not always clear. 25 While other observers have argued that the cycle is not necessarily a sequential process in the context of all cities[4], the compromised implementation of the Aayalolo Bus Service in Accra in 2016 does serve to highlight some of the difficulties faced where major formal PT schemes are proposed, which include competition from trotros operating along the same corridor. Findings from TRANSITIONS interviews suggest that regulatory enforcement of IPT in Accra has weakened over time, with the result that further informalisation (including illegal operations), and a drift into phases 2 and 3 are evident[5]. A central objective of the TRANSITIONS project has been to understand what options could exist to break this cycle. The idea of IPT reform and integration with formal public transport networks is not new, but sharing existing examples of better practice and lessons learnt is important, as could be a shift in attitude and greater emphasis on support for and bottom-up professionalisation of the sector. Regardless of the formal policy position, circumstances can (and often do) intervene with the result that official policy objectives are not realised and IPT continues to operate in a situation of ineffectual regulation. This dynamic has been captured in the idea of a 'regulatory cycle', whereby public authorities seek to introduce formal public transport, but long-term viability issues result in insufficient capacity and poor service quality. IPT operators emerge to fill the service gaps, but aggressive competition and poor regulatory oversight result in congestion, pollution and poor road safety. This results in the situation that the public authority considers it should take action and the cycle can be seen to start again (see Figure 7). The author of the cycle concept, Gwilliam[3], referred to efforts by governments in Accra, Lagos and Dakar to recreate publically owned companies (as in Accra) or by subsidizing and protecting a selected private company (as in Dakar). Figure 5 - The 'regulatory cycle' (adapted from Gwilliam 2008) Comparison of situations and perspectives from the TRANSITIONS cities The TRANSITIONS cities represent a range of situations with respect to the maturity of the framework created for IPT, in relation to both: regulating the industry, and supporting the professionalisation of the industry. 26 Cape Town can be viewed as one of the 'first movers' in SSA and a combination of national and local public authority actions has resulted in a relatively well-developed framework of both regulation and supportive initiatives for IPT. Operational licences for specific routes form the basis of regulation, while the national government specifies safety standards for vehicles. Complementing this, national government has also led the development and funding of the Taxi Recapitalisation Programme (TRP), a partial capital subsidy that enables IPT operators to scrap old vehicles and purchase new replacements. The existence of a relatively extensive formal PT system, including both trains and Bus Rapid Transit (BRT) has encouraged efforts for IPT integration through trialling different forms of 'hybridity regulation'. Recent advances have been made in developing a telematics-based incentive platform to modify driver behaviour (Blue dot). While there have been important achievements, including the modernisation of a portion of the minibus fleet, substantial problems remain, not least as a result of the intense competition amongst IPT operators for passengers and the violent reactions that can sometimes result. IPT regulation in Maputo originated in 1989 and much more recently, the Municipality of Maputo has been promoting a shift to the use of larger vehicles (than the current 15- seater chapas minibuses) through its annual licensing process. In relation to enforcement, this is sometimes strong, but also unfair. IPT associations interviewed expressed that operators are placed under considerable pressure by municipal police, who are considered to take advantage of regulations to their own benefit. Payment of bribes appears to be commonplace. When asked the question, Who are the main stakeholders in the trotro industry?, a Union representative in Ghana responded "The government does not have anything doing in our industry." Drivers, owners and union executives have the feeling that the government does not listen to their concerns and/or address their plights. In the case of the Ghanaian cities, the fundamental element of IPT regulation in the form of route licensing is in place. National government regulations mean that IPT operators in Accra and Kumasi should register with a union and then apply to the local administration for the rights to operate along a specific route. Poor enforcement has, however, led to a situation where some interviewees consider that unregistered 'floater' operators (known locally in Kumasi as waawaa), outnumber legitimate operators. This means that those trotro operators that do seek to 'play by the rules', for example by queueing at terminals, can become disadvantaged. Industry stakeholders expressed that the public authorities show little interest towards the industry and as a result there are limited support actions. Of the case cities involved in TRANSITIONS, Freetown could be considered closest to the 'open market' and position of 'acceptance' by public authorities. The balance of power in favour of self-management and regulation by unions appears to have been most prominent here, but the government is currently in the process of establishing policies and subsequent actions in relation to the IPT industry. Further details and commentary on regulatory frameworks currently in place in the cities is provided in Section 4.1. 27 TRANSITIONS cities represent different examples in the self-appraisal spectrum (Q4): from Freetown which can be considered to have limited regulatory oversight of the IPT sector; to Accra and Kumasi where regulations are more developed, but poorly enforced; Maputo, where there is a history or regulation, but untransparent or unfair enforcement; and Cape Town that has taken positive steps to put in place both a regulatory framework and positive initiatives to support professionalization. It becomes apparent from reviewing the circumstances in the different cities that support for professionalisation is unlikely to be successful without the simultaneous enforcement of key regulation, as operators that do not comply with rules may gain unfair competitive advantage. Breaking a negative 'regulatory cycle' will require recognition of the value of the services provided by IPT by politicians and senior civil servants, to ensure suitable investment in a framework for their improved operation. This may be a framework operating instead of or alongside that for formal public transport, where this exists. Main findings and messages IPT networks have emerged organically in response to demand and opportunities, shaped by trial and error, the location of available terminals, and perhaps also coordination or 'turf wars' among operators. Over time, they may exhibit rigidities of their own, such as the establishment of terminals in consolidated parts of the city and the union/membership associated with key routes or corridors. As a result, in many cities the networks have stabilised, other than thos areas of new development and spatial expansion. They are understood by the people who learn how to navigate the mobility options. Now they can be mapped and presented as a network, and perhaps even optimised. 28 3.2 Understanding Informal Public Transport network characteristics In an attempt to better understand the scope and nature of informal transport networks, researchers and practitioners across the African continent have embarked on largescale data collection and mapping campaigns over the last decade. The combination of GPS and mobile technologies has simplified the acquisition of spatial data on public transport networks, as exemplified in Nairobi[6], Cape Town[7], Maputo and Accra[8]. These initiatives have described the spatial organisation of informal transport routes and provided insights into the accessibility of different parts of their city by public transport. They have also highlighted the challenges of maintaining an up-to-date transport map in cities where services are predominantly informal. These recent developments in data acquisition and data transmission technologies have had a significant impact on paratransit studies. Smartphones and other mobile devices incorporating GPS and sophisticated sensors have been used for both "active" and "passive" data collection approaches. Active data collection methods refer to the involvement of numerators that register specific events (e.g. the departure of a vehicle, a passenger boarding, etc.) on a portable device. Less frequently employed "passive" methods consist of fitting a tracker on a vehicle without having an enumerator present onboard. This approach makes it possible to collect comprehensive movement data over a long period of time, but the raw data can be difficult to interpret as it misses useful information to understand the behaviour of the vehicle (e.g. presence of passengers onboard, traffic conditions, etc.). TRANSITIONS did not set out to map IPT network characteristics and has relied on other sources and knowledge of local City Researchers to establish an overall understanding of IPT in each city. Passive GPS data collection was undertaken in relation to the fuel consumption surveys on specific routes. Through the passenger opinion surveys, the project has gained insights into typical passenger journeys. Background 29 Network structures - The TRANSITIONS cities represent a range of situations in terms of network structure, organization and recent initiatives taken to map the paratransit routes. Table 2 (Below) provides a summary comparison of IPT network and fleet characteristics. Accra has a fleet of around 11,200 trotros (minibuses), as well as a greater quantity of sedans taxis (around 22,000), which operate as shared vehicles. In contrast, Cape Town, Freetown and Maputo rely much more on minibuses than sedan taxi vehicles. Overall, IPT represents about 19% of the modal share in Cape Town (or 54% as a share of the public transport passenger market, which may have increased with the complete collapse of rail services in the most utilised line in 2019), 62% in Accra, 65% in Kumasi, 55% in Freetown and over 33% (+ MyLove open trucks) in Maputo. In Kumasi and Accra, the recent influx of other public transport modes such as the ride hailing services (Uber, Bolt, Yango etc.) and the three-wheelers typically used to provide these, have had a significant impact on congestion levels. Middle class users who used to take trotros can now opt for an individual mode of transport, which adds to congestion on the roads and increases air pollution. The lack of infrastructure such as bus stops and terminals has also been pointed out as a major challenge, which contributes to the shift to individual modes of transport and causes major road safety issue. In Kumasi for instance, many bus stops are used for trading activities which makes it impossible for commuters to sit while waiting for the next possible vehicle. Comparison of situations and perspectives from the TRANSITIONS cities As Cape Town benefits from a more developed formal PT network, alongside the IPT minibus-taxi services, it represents an advanced case of where there have been efforts to integrate these modes. This has included physical integration approaches, such as improvement of IPT terminals co-located with PT interchanges, as well as professionalisation of IPT route associations to provide feeder services to high volume PT corridors. A notable example is that of the MyCiTi BRT scheme, which involved the amalgamation of eight minibus-taxi route associations to form the Kidrogen and Transpeninsula bus operating companies. This process followed a three-step process of: (i) rationalizing the transport network, (ii) optimizing operations, and (iii) renewing the fleet. The introduction of scheduled services in association with rationalised service routes (from 3 to 5 routes) and vehicle fleets (from 78 to 32 vehicles) contributed to improve services significantly, reduce the fuel consumption by 45%, and reduce the number of working hours for the drivers. Table 2 - Overview of IPT network, fleet and operational characteristics in the case cities Accra has been one of the first cities to map trotro and shared taxi routes and make it available as Open Source data. However, this mapping exercise was partial as it only mapped the 315 routes originating from the CBD (Accra Metropolitan Assembly). This highlights the scale of the work required and another campaign was launched in 2021, mapping 110 additional routes across Greater Accra. Cape Town7 and Maputo8 have embarked on similar campaigns This data is essential for local authorities to understand how the network is structured, identify areas in the city that are not served, or potential competition with other modes of transport (beyond other regulatory benefits). Further details on network characteristics, such as the presence of 'floaters' in Accra and Kumasi and 'pirates' in Cape Town (illegal operators) are provided in Section 4.1. 30 Multi-modal journeys using IPT – During the Passenger Opinion Surveys, respondents were asked which previous mode they used to reach the terminal, before continuing their journey by IPT. Walking typically represented a high proportion of trips, ranging around 26% in Freetown, 36% in Maputo and up to 46% in Accra. Linked trips by IPT, involving connections at the terminal, represented an even higher proportion of responses. This was as high as 67% in Cape Town, with other cities recording previous trips by minibus within the range of 30-50% (around 30% in Maputo, 40% in Freetown and 50% in Accra). While the locations of the terminals will have a bearing on these results (for example, whether the terminal is at the end of a key corridor, at a junction between several key corridors), overall it became apparent that a significant proportion of passengers are making multi-stage journeys by IPT in order to reach their destination. It can be assumed that people travelling from peripheral parts of the city will spend a significant amount of time each day commuting in IPT vehicles with low average speeds. Further research on trip costs and durations would be beneficial. Figure 6- Mode used before entering the IPT vehicle - Kumasi The scale of the IPT sector in Sub-Saharan Africa (e.g. over 400 routes and 33,000 vehicles in Greater Accra) is vast. Digital technologies provide the tools for planners to gain a better understanding of the networks for planning purposes, as well as to undertake more accurate quantification of benefits and problems. This will also enable more accurate cost benefit analysis and supporting evidence for the opportunities from working with the sector. IPT is the major mode of motorised transport serving the metropolitan areas of Africa, providing a relatively efficient form of collective transport, but this continued dominance should not be taken for granted. Motorcycle taxis and private vehicle ownership are attractive to growing middle classes, but both will lead to greater congestion. There is a need to support the sector, collect data and build capacities within local authorities to better organize the network (around well-planned terminals and stops) and avoid competition between operators. The challenge is tremendous, and the level of investment in public transport, as well as the integration of informal transport in the coming years, will completely change the future of these cities. 32 Main findings and messages Coetzee, J., Krogscheepers, C., Spotten, J., 2018. Mapping minibus-taxi operations at a metropolitan scale – methodologies for unprecedented data collection using a smartphone application and data management techniques. Presented at the 37th Annual Southern African Transport Conference Pretoria, South Africa. Mapping informal bus routes ON VIDEO, posted on July 11, 2020, Trufi Association - https://www.trufi-association.org/mapping-informal-bus-routes-on-video/ Further resources Informal Public Transport provides a largely affordable, flexible form of urban mobility. Within the urban centres of Africa that are often dominated by the informal economy, it also provides an accessible and affordable form of urban logistics for the large number of traders, many of whom are women, and businesses. 33 3.3 Affordable mobility Flexibility provided by informal public transport and the interaction with the informal urban economy are key assets. For example, real time route deviations may provide the user with a more door to door service. A study of accessibility in Dar-Es-Salaam highlight this inter-connection, concluding that many of those, who travel regularly outside of their settlements, have more diverse, irregular and shifting mobility patterns related to various kinds of informal livelihood activities associated with trading, freelancing and small-scale businesses.[9] A further study in the same city found that more than 70% of the households in Dar-es-Salaam who depend on informal livelihoods use the informal modes of transport such as minibuses, motorcycles and tricycles as their primary mode[10]. The interaction between the informal urban economy and the informal transport system is also reflected in the need, as shown by a number of studies[11] (e.g. Turner & Kwakye, 1998; Joseph et al. 2020), for those engaged in such informal sector livelihoods to travel with goods. The majority of such passengers are women. The provision of both a passenger and small freight distribution service is a further benefit of informal public transport. Background Comparison of situations and perspectives from the TRANSITIONS cities Across the case study areas in the TRANSITIONS cities, informal public transport was predominately used by middle income and low income workers, particulary women who were involved in informal economy activities. In Accra, 57% of all respondents to the passenger opinion survey were found in the medium income bracket, though middle income women only made up 50% of female passengers and more low income women than men were found to be informal public transport users. In Kumasi, middle income earners formed the majority amongt women, low income earners were a majority amongst men. In Freetown and Maputo, the overwhelming majority (69% and 74% respectively) of respondents were in low income categories. In Cape Town, 52% of respondents fall into the low income bracket and 48% fall into the medium income bracket. When interpreting the data, it is important to be mindful that the definitions of income groups do not allow for direct comparison across cities. Beyond the findings amongst the IPT operations studied in the TRANSITIONS project, there is a lack of statistically representative data on IPT users', or indeed the general populations', income levels at the city scale that allows income comparisons to be made across cities. There is, however, some national-level statistics compiled by the World Inequality Lab that shed light on the relative incomes, or spending power, of low- and lower middle-income earners. In Ghana, the bottom 50% of earners in the country have a share of 12.8% of national income, while the respective national income shares of the bottom 50% of income earners in Mozambique is 8.9%, in Sierra Leone is 17.3%, and in South Africa is 6.3% [12]. 34 Levels of fare dissatisfaction was common across all TRANSITIONS cities and appears to be more concentrated amongst female respondents. This could be due to the lower levels of income women will have in many contexts even though they may be within the same income categories than men. In Accra and Kumasi, nearly half of respondents were unhappy or very unhappy and these proportions were greater amongst female respondents. The results for respondents in Maputo was more balanced with approximately a third being unhappy, a third providing a neutral response, and a third being happy. In Mozambique, it is the City Council that sets the tariff levels for public transport services and the value of the rate is a matter of the utmost political and popular importance. In Freetown, a majority of respondents (58%) were unhappy with fares, with more women expressing dissatisfaction than men. In Cape Town, interestingly there was very little dissatification (10% of respondents) with fares, though even here more women than men were dissatisified. It is also worth highlighting that, of the five cities, Cape Town is the only case where public authorities do not engage in fare setting. Figure 7- Income levels of respondents to the passenger opinion survey in Freetown People from low and middle income households appear to make up the overwhelming majority users of Informal Public Transport in cities across Sub Saharan Africa. The relative balance between the income group of users appears to vary by the overall level of income of the city and the different levels of personal motorisation, with lower income users making up a greater proportion of users in higher-income cities and more motorised cities. Users displayed low levels of satisfaction with fares and the affordability of Informal Public Transport, despite this being the lowest cost option available. IPT is a key means of transport for low income households and affordabilty of a very important concern in low-income urban settings. Better understanding is needed of the proportions of household income spent on mobility and the mechanisms used (and implications of) IPT fare setting by public authorities. 35 Main findings and messages This gradient of satisfaction observed may be related to the differences in overall income levels across the different countries and whilst labour costs for informal public transport may also be lower, operating costs affected on the global scale such as fuel, spare parts and vehicles may lead to fares in those cities being less affordable for those on lower income levels. Figure 8 - Fare satisfaction in Accra and Cape Town (where 1 is very unhappy and 5 is very happy) 36 Whilst getting to and from employment is a significant focus for why people travel, it is only one of number major reasons people use Informal Public Transport. Shopping, maintaining social networks, undertaking administrative visits to banks and offices and accessing education were also found to be significant. The importance of these different trip purposes can also differ between men and women and across different age groups. Asking whether public transport networks serve the different locations for these types of trips will be highly relevant to future planning activities. Informal Public Transport provides access to jobs, education, healthcare, social networks and leisure activities for a wide range of users across cities in Africa. The importance of failing to deliver such access to all urban citizens is highlighted in research by the World Bank[13]. This study showed the substantial negative impact that inadequate public transport has on access to health and education and ultimately on human development outcomes for the poorest and most vulnerable in a range of African cities. It also highlights the impact that not being able to access services and opportunities may compound problems faced by existing vulnerable and excluded groups such as girls and women, people with disabilities and people from low-income households. It is thus important to understand who is using informal public transport systems and for what purposes, which in turn helps us to assess the role that IPT access is playing in people's lives and where gaps in service provision remain. 3.4 Access to education, jobs and leisure Background Comparison of situations and perspectives from the TRANSITIONS cities Gender of passengers – The degree to which there is a balance between men and women who use informal IPT, based upon the passenger opinion survey, varies between cities. For example, In Accra it was found that 42% of users surveyed were females and 58% males. In Kumasi, 39% of users were female and 61% were males. Conversely, in Freetown, female users made up the majority with 53% users interviewed were women and 47% men. Maputo had a similar passenger composition in the study areas of 52% women and 49% men. In the case of Cape Town, female users were even more predominant making up fifty-nine percent of respondents interviewed compared to 41% who were male. Cape Town Kumasi Figure 9 - Contrasting proportions of female and male passengers in Cape Town (left) and Kumasi Age of passengers - The majority of users are frequently of working age. For example, in Accra, 44% were found to be between 31-45 and 84% were under 45 years old. In Kumasi, similarly, over three-quarters of respondents were of working ages between 21 and 45. Similar compositions were also found amongst users in Cape Town, Freetown and Maputo. Students under the age of 21 and older people appear to constitute smaller percentages of the users. Employment - The concentration of working age users leads, perhaps unsurprisingly, to the observation that a majority of IPT users are employed. 80% of users in Accra were found to be employed either by an organsation or self-employed. 77% of users in Freetown were found to be employed but interestingly nearly 60% of users reported being self-employed. 37 This is a reflection, not only, of the importance of the informal economy in this West African city, but in many cities across the continent. Students, unemployed people and retired persons made up varying but relatively small percentages of users. In Cape Town, unemployed people made up 13% of users and 8% in Freetown. In Kumasi, students made up 27% of users where as in Accra they made up 10% of users. Whilst providing mobility for working age people is economically important for any city, it is useful to consider to what extent mobility provided by IPT is available and affordable by more vulnerable groups such as young people, older people or people with disabilties. This leads us to question to what extent IPT is also meeting their needs in an appropriate manner. Figure 10 - IPT trip purposes by gender - Maputo 38 Other trip purposes – As demonstrated by in the chart for Maputo (Figure 12) trips for purposes other than employment do form significant passenger demands. In Kumasi, trips to maintain family and social networks and visit family and friends made up the largest type of trip purpose at nearly half of all trips. Trips to and from employment made 27% of journeys. Trips for shopping and replenishing household goods featured as a significant trip purpose, although this can involve shopping for trading purposes (i.e. purchasing goods in a central market which are then re-sold in other locations). In Freetown 39% of trips were found to be for shopping. In Cape Town, 24% were for shopping trips. As might be expected, such journeys are not equally divided between men and women. In Kumasi, 57% of shopping trips were made by women and 63% of shopping trips in Cape Town were made by women. The importance of trip purposes for reasons other than accessing employment may have significant impact on the locations that need to be served across a city. An overwhelming focus on employment locations may present problems for users making journeys for other activities. Goods and logistics - It is also important to consider the ease of physical mobility for those who need to travel with goods and luggage (often a particular feature of women employed in the informal sector and people accompanying other users, young and old). The number of users who reported the need for transporting goods was sometimes substantial. This ranged from 1% in Cape Town and 4% in Accra to 29% of the respondents in Kumasi and 37% in Freetown that indicated the transport of goods as in important service requirement. This is despite that fact that Kumasi, in particular, goods carrying is (in theory) prohibited. Provision of these logistics-type services may provide a valuable source of revenue for drivers and conductors beyond the fares necessary to pay daily rents, incentivising the carrying of goods in passenger vehicles. Main findings and messages Whether women or men are the majority users of IPT varies from city to city. As a result, it is important to understand the gender composition of users in any one city in order to understand the different needs that IPT serves. It is not always the case that main use of IPT is to access employment. The reasons people are travelling are varied. It is therefore important to consider whether the IPT network is serving the appropriate locations that meet the trip purposes of different users. Additionally, people of working age are curretly the predominate users of IPT and so consideration needs to be given to what extent the mobility needs of all residents within a city are being met, including those of young and older people. Surveys found that travelling with goods was a significant feature of users mobility, with this being a requirement for women in a higher proportion of cases. The ability of IPT to cater for such encumbered mobility is a significant feature if it is to continue to meet user needs. It was also found that people with mobility impairments and disabilities were frequently under-represented in the user surveys. Consideration needs also to be given to whether this is as a result of the lack of consideration of the mobility needs of people with disabilties in such an informal mobility system. 39 World Bank. 2021. Connectivity for Human Capital: Realizing the Right to Education and Healthcare through Improved Public Transport in African Cities. Mobility and Transport Connectivity; World Bank, Washington, DC. https://openknowledge.worldbank.org/handle/10986/35185 Further resources 3.5 Passenger safety, sexual harassment and personal security Passengers frequently have concerns about their safety when making journeys using IPT. These include concerns for the quality and roadworthiness of the vehicles in which they travel, the daily risk they face from being involved in road crashes from poor driver behaviour and operating practices of the drivers and workers and from the risk they face as passengers from theft and other crimes and sexual harassment and assault from staff and other passengers. Large numbers of passengers, mostly women, encounter sexual harassment on a daily basis when using public transport in cities across the world, including in Africa, regardless of whether they are served by informal or formal public transport operators. This level of everyday experience leads to a widespread fear amongst women for their personal security and informs their travel decisions in terms of how much they travel, what times they travel, where they travel and with whom they travel. As a result, this impacts upon wider aspects of women's lives including which schools and colleges should they attend and what work opportunities they pursue. 40 Background Sub-Saharan Africa represents one of the worst performing regions for road crash fatalities (WHO, 2018) with 26.6 deaths per 100,000 population reported by the WHO in 2018. Deaths of occupants of vehicles makes up 40% of this significant death rate with, given the low level of private vehicle ownership, is made up of a substantial number of public transport passengers. With the exception of South Africa, all vehicles used in the IPT sector in Africa are used imports of vans, including general cargo vans that are converted for passenger use with windows and seats inserted. This results in a fleet that can vary considerably in age and degree of upkeep to ensure roadworthiness (see Section 3.7 for further information). This contributes to the real and valid concern for their own safety amongst IPT users and this is reflected in the findings amongst passengers surveyed across the TRANSITION case study cities. Studies have repeatedly shown that sexual harassment on public transport is a widespread experience for women globally (FIA Foundation, 2016) and that it is as common a feature of cities, such as many across Africa, where informal transport makes up the majority of services available. Overcrowded vehicles and public spaces are characteristics of IPT provision that allow touching, groping and other forms of harassment of women to occur unchecked. Work by the FIA Foundation in their report, Safe and Sound[14], reported significant perceptions of insecurity within Cape Town from riding informal transport vehicles as well as walking to and waiting at bus stop for rides. Almost 70 per cent of women in a survey conducted in Egypt by the European Bank of Reconstruction and Development were dissuaded from using public transport to commute to work because of safety concerns[15]. These concerns were mostly a response to a high incidence of sexual harassment in formal Public Transport. Concerns of sexual harassment also extended to women workers in IPT. In Kenya, a study revealed that 76% of female informal transport workers have either experienced or witnessed sexual harassment at their place of work[16]. Comparison of situations and perspectives from the TRANSITIONS cities Passenger safety - Respondents to the TRANSITONS passenger opinion surveys reported different levels of fear of crashes from using IPT. They appeared to be clustered either at relatively low or high levels of perceived danger: at the lower end of the spectrum were Accra in Ghana, reporting that 12% of respondents were very worried of the risk of a crash, and Cape Town, where 18% of respondents reported being very worried by risk of a crash when travelling by informal public transport (with little difference between men and women in this regard). By contrast, 39% of respondents in Kumasi reported that they had a very high fear of road crashes. In Freetown this was as high as 55% and in Maputo, 73% of men and 81% of women were very worried about the accident risk. The data from Kumasi, showed the greatest differentiation of opinion between men and women, with 48% of the females as against 33% of the males very worried about risk of an accident. In addition, many respondents reported concern about the condition of the vehicles. In Freetown, the majority of the respondents were unsatisfied with the poor conditions of these vehicles which makes them very worried about their safety. Additionally, more females than males were also worried (53.8%) about their safety while using the poda-podas. 41 Figure 11 - Differences in perceptions of passenger safety between Accra and Freetown Sexual harassment and personal security - The TRANSITIONS cities also reported varying degrees of passenger experience of sexual harassment and perceptions of personal security. These ranged from around 3% of respondents in Accra, 11% in Cape Town, 17% in Maputo and 20% in Freetown that reported experience of sexual harassment. By contrast Kumasi, 45% of all respondents, but over 56% of women, reported experience of sexual harassment whilst travelling by IPT. The overall level of fear of personal security varied equally across the cities in a similar pattern. Survey respondents in Accra reported the lowest level of fear of personal security, where only 1% reported feeling that their personal security was very unsafe with no difference between men and women in that regard. In Cape Town only 11% said that they felt unsafe, with significantly more females feeling unsafe than males (40% more). Interestingly, even though Freetown had a relatively low level of reported sexual harassment (at 20%), 55% of respondents responded that they feel very unsafe regarding their personal security, with 57% of women compared to 52% of men reporting this to be the case. 42 Main findings and messages Fear of users' own safety from poor vehicle condition and unsafe driving behaviour was a clear finding from across the case study cities. Data from the TRANSITIONS cities and from other research highlight the variation in experience of sexual harassment and the locally specific understanding and reality of harassment and the social practices of masking and hiding the reality of harassment by men and women as an unavoidable part of the everyday reality of urban life. There is a need for a clear identification and understanding of the experience of sexual harassment when using public transport at a local level. A similar pattern could be observed for Maputo, where perceptions of safety (with 74% of women and 66% of men feeling 'very insecure') was considerably higher than the incident rates. Conversely, around 19% of respondents participating in the survey reported being very fearful for their personal security in Kumasi, with even more men than women responding that they feel unsafe for their personal security, even though this was a city with reported high level of experience of sexual harassment by women passengers. There is also a need to recognise that sexual harassment and the fear for personal security that particularly women passengers encounter is across their whole journey and includes, walking to and from public transport, waiting for public transport and interchanging between different forms of public transport. As a result, earlier research as part of the South African National Household Travel Survey in 2013 showed that, based on the NHTS database 2013, household heads were to a greater extent, very unsatisfied with personal security walking to and from public transport at 36% compared with 28% when waiting for the public transport vehicle and 28% whilst inside the public transport vehicle. As a result, integrating a focus on walking to/from and waiting for public transport is an important element of an authority's response to sexual harassment in urban transport. There is a need for action in this area across elements of urban public transport. There will need to be a multi-agency and multi-institutional response. Initiatives building on interaction with and support to operators during the COVID pandemic in terms of training for staff and operators as part of a behaviour change programme may be directions to explore. 43 EBRD, 2016. Safe transport for all: Issues and operational lessons from the Egyptian National Railways. FIA Foundation, 2016. Safe and sound: International research on women's personal safety on public transport. EMPOWER SHE-CAN tool: web-based tool for helping decision-makers tackle sexual harassment in sub-Saharan public transport Further resources People with disabilities make up 15 percent of the world's population and yet in many cities across the world, IPT systems fail to provide for their needs. This adds to the poverty and exclusion that many face. There is a need for both operators and policy makers to serve their mobility needs and to deliver the globally agreed goals for accessible transport systems for all. 3.6 Mobility for disabled people Background As set out in a policy brief developed by the High Volume Transport Applied Research Programme (2019) accessible public transport gives people with disabilities access to education, employment and healthcare, as well as social contacts with family and friends. The ability to move and travel independently is fundamental to breaking the downward spiral of dependence and poverty[17]. To support this, the United Nations Sustainable Development Goal 11 and the key target of 11.2, which calls for 'Safe, affordable, accessible and sustainable transport systems for all by 2030, specifically includes public transport to meet the needs of people with disabilities as well as other vulnerable people. Globally, persons with disabilities are often referred to as the largest minority, accounting for a total of over 1 billion or 15 percent of the world's population. Too often, they experience challenging poverty, marginalization and exclusion in society. Fear—of how to use the public transport services as well as other passengers' attitudes—is often a key factor, and many users report feeling unsafe on any form of public transport; and parents of children with disabilities fear for their child's safety as one of the key barriers in their journeys to school[18]. This results in people with disabilties often seeking out individualised solutions such as cars or taxis, or suppressing travel entirely. The transport system in terms of infrastructure, vehicle design as well as transport service staff and operations each has many features that limit people with disabilities ability to access services and opportunity. There is a requirement for integrated approaches within the transport system across these different elements . In addition, consideration of the cross-sections between the mobility needs and constraints facing people with disabilities and those of older people and women accompanying young children is an important element of the development of successful policies and solutions. 44 IPT use was found to be very limited amongst people with disabilities across all five cities, with Cape Town reporting the highest levels with 5% of respondents having mobility impairment due to age and 2% were people with disabilities. Other TRANSITIONS cities reported 1% or less respondents with disabilties using the IPT routes from the terminals where the passenger opinion surveys were undertaken. This is despite the fact many cities across Africa have higher levels of disability than the global average and, therefore, people with disabilties and impairments appear under-represented amongst IPT passengers. This woul represent substantial consequences for the mobility, income and inclusion in society of people with disabilities. Although a low level of respondents with disabilties used IPT, these passengers stated the need to ensure the provision of assistance to persons with special needs. The views they shared were the surveyors were quite compelling and included: Comparison of situations and perspectives from the TRANSITIONS cities "There should be measures in place for people with disability" "The bus conductors sometimes treats you in a bad way when you are disabled." "The step aid at the entrance or the bus is too high. They should put measures in place for older people. The conductor wasn't even here to help me get on board." "Old men find it difficult to board because the vehicles are not friendly [accessible] to them" "Step aid is too high and should be down [lowered] for it to be disability friendly" Main findings and messages The experience of people with disabilities in using IPT from across the case study cities is very negative. There is evidence that the main form of public transport in these cities is not meeting the mobility needs of people with disabilities. As a result, they are required to find alternative means of transport or suppress their need for mobility. This is expected to result in limited access to income-generating opportunities, education, health services and social networks, resulting in social exclusion. Physical access needs may need to be addressed on a longer-term basis in relation to vehicle investment programmes but also in terms of providing awareness training and increasing the customer care skills of operators in relation to their provision of services to users with disabilities. HVT Road Note 21 – Enhancing the mobility of disabled people: Guidelines for Practitioners HVT 2019 – Disability Inclusive Policy Brief Further resources 45 Informal Public Transport vehicles consume large quantities of fuel, predominantly diesel. When viewed over these vehicles' long working lives, IPT vehicles in African cities produce significant volumes of airborne emissions both daily and cumulatively. This is not only a problem in terms of transport-sector greenhouse gas (GHG) emissions, as it also negatively impacts the quality of air that passengers, vehicles crews and those on and near roads breathe. Addressing these issues in the short to medium term does not necessarily require replacing vehicles or electrifying IPT fleets – lowering IPT fuel consumption will directly reduce emissions. There are multiple ways to do so, which include changing driver behaviour, improving vehicle maintenance practices, and providing dedicated infrastructure that increase vehicle operational efficiency. 3.7 Air quality and GHG emissions Background It is a complex matter to understand the current extent of IPT's contribution to GHG and air quality issues. Not only is data needed on the actual and relative size of a city's IPT fleet compared to the overall motorised vehicle fleet, but it is also important to know from where IPT vehicles are sourced, what type and quality of fuel is available and where this fuel comes from. Information on the quality and emissions controls that are in place for vehicles and fuel and is also beneficial. In addition, day-to-day operational insights are also needed in terms of driver behaviour, fuel purchasing practices, actual fuel consumption, the distances that vehicles cover, and how old a vehicle is. This information enables quantification of local emissions and related health and healthcare impacts. While there is little published research on such local operating characteristics and studies of local air quality and resulting health issues, there is some high-level data on vehicle and fuel supply. Outside of South Africa, all vehicles used in the IPT sector in Africa are used imports, predominantly sourced from or via the European Union, and from Japan directly or via the United Arab Emirates. Local importation restrictions in terms of maximum vehicle age, roadworthiness and engine emissions standards do exist to varying degrees in Ghana, Mozambique and Sierra Leone, but there is some variance in the condition of each vehicle that ultimately is imported for use in the IPT sector. By contrast, South Africa has an established vehicle manufacturing sector, and in order to protect the new vehicle market that results, no used vehicle imports are allowed in this country. The predominant model used in the IPT sector is manufactured locally, and, aided by a government scrapping subsidy, the IPT vehicle fleet is comparatively new. In relation to fuel supply and related fuel quality controls, there is yet again a distinction between South Africa and elsewhere in Africa. The former's vehicle manufacturing base allows for more direct fuel type and emissions control, as vehicles are locally produced and fuels locally refined as opposed to both being dependent on importation. Environmental emissions regulation is comparatively very weak outside South Africa. This is primarily due to this country's ban on used vehicle imports, as well as fuel quality standards that have been in place for many years (especially in terms of the sulphur content allowed in diesel). It should, however, be noted that Ghana has been strengthening its fuel quality controls with a similar aim in recent years. 46 While the above vehicle- and fuel-related interventions contribute to reducing emissions for, and health impacts of, national vehicle fleets, and thus in turn for IPT vehicles, the only public sector policy that overtly targets emissions-related responses for IPT can be found in South Africa. This is the national Green Transport Strategy released in 2018 [19]. At a high level, this document notes the importance of reducing airborne pollutants from the transport sector to mitigate effects on public health and healthcare costs. In relation to IPT, the strategy proposes a process of engagement between government, operators and finance organisations to encourage a shift to cleaner fuels by converting minibuses to run on compressed natural gas. Comparison of situations and perspectives from the TRANSITIONS cities Informal Public Transport vehicles in the TRANSITIONS cities all see hard use. When not idling or crawling along in traffic, drivers try to get their next load of passengers as quickly as possible by driving aggressively and speeding back to the start of a route. Not only are such vehicles usually fully loaded with passengers, but they also accumulate significant mileages in the course of a working week. Aged, hard-working fleets, coupled with limited maintenance and a reliance on low-quality diesel, mean that IPT is a major contributor to greenhouse gas (GHG) emissions, as well as to local air quality and health impacts. Table 2 provides a summary comparison of IPT network and fleet characteristics. In Accra, it was found that, though IPT vehicles were imported from the used market, they were generally in a good condition at the time of importation. All these vehicles were diesel Mercedes-Benz Sprinter cargo vans that were converted for the carriage of passengers, with a typical age of 15 years at the time the research was conducted. Logging the total mileage or actual fuel consumption of each vehicle was difficult as most vehicles' odometers were not in working order, though drivers reported purchasing in the range of 12-40 litres of fuel per day. GPS data showed that vehicles typically covered in the range of 150-170km per day, and were actively working for 2.6-9.7 hours. Average operating speed was 20km/h, though in dense traffic this could drop to 10km/h. All 30 vehicles involved in the research in Cape Town were diesel Toyota Quantum minibuses. This model, also known as the Hiace in some markets, was also available in a less popular petrol variant, though few of these were in use by the IPT association. Reported first dates of vehicle registration were between 2015 and 2022. Daily operating distances ranged from 196km to 340km, over a working day of between 1.5 to 13.3 hours while travelling at average speeds of 25-75km/h (the latter possible along a freeway in the contra-peak direction). Though the digital fuel consumption installations did not work, odometers were all in working order. Drivers reported fuel purchases of 13-45 litres per day, and typical fuel consumption was calculated to be in the range of 26-43L/100km – a stark contrast to the manufacturer figure of 9.9L/100km. At least six different minibus models were found in use in the IPT sector in Freetown, though the most popular model was the same as in Accra, the Mercedes-Benz Sprinter. Their ages were difficult to establish as they were imported through informal channels, and may also have changed owners after landing in the country. The tracked vehicles on average covered daily distances of 21-219km with a working day of a few minutes up to just over an hour, indicating average travel speeds of 7-22km/h. The calculated fuel consumption across the 19 tracked vehicles was in quite a narrow range – between 12.1 and 14.0L/100km, against official figures of 8.0-12.1L/100km. Average daily volume of fuel used was 3L to 27L. As in Freetown, the IPT fleet in Kumasi consists of several different models, with seven noted in the research fleet. Their ages were estimated to be between 15 and 25 years, but as they were imported as used, exact figures could not be established. Average distances travelled per day were between 17km and 204km, with most vehicles covering well over 100km per day. Vehicles were active for 2-13 hours per day on average, with daily mean travel speeds of between 17 and 24km/h. Only one of the fuel probe installations worked for the entire week of tracking and thus actual fuel used and fuel consumption across the tracked fleet could not be calculated. On this one vehicle, reported daily refuelling volume was 17.5-43L. The predominant IPT vehicle in use in Maputo was a diesel Toyota Hiace minibus, with smaller numbers of three other diesel models with either 15 or 26 seats. All were imported used from Japan, and were represented in the research. The majority of the tracked fleet was manufactured between 1995 and 2005. Both the fuel sensor and GPS installations proved problematic, which was in part overcome by supplementary manual data collection. This combined method revealed that, on average, vehicles covered 144-252km per day. Daily fuel volume purchased was between 27L and 52L. Fuel consumption was calculated in the range 15.3-18.1L/100km for the 15-seater models, compared to official figures of 5.5-6.3L/100km. Consumption for the two tracked 26-seaters was 34 and 34.5L/100km respectively, in contrast with official figures of 13-14L/100km. 47 48 Direct air quality impacts and GHG emissions from IPT vehicles can be calculated if these vehicles' fuel type and consumption are known. While the overwhelming majority of IPT vehicles in the TRANSITIONS cities used diesel, in none of the case cities was there an existing database on the distances that vehicles covered, the speeds at which they travelled, or how much fuel was purchased. Neither government agencies nor IPT vehicle drivers and owners kept records of such data. Measuring direct airborne emissions at each vehicle's tailpipe was not viable. The equipment would have had to be imported from outside Africa, at significantly increased costs in comparison to the fuel probe (installed in fuel tanks) allowed for in this project. Given the wide range in condition and age of IPT vehicles in the case cities, the different operating conditions tied to the quality of infrastructure and traffic, and the consequent variations in fuel consumption this would bring, a large sample would have needed to be included for the results to be meaningful for estimating air quality impacts at the city level. TRANSITIONS therefore focussed on gathering fuel and related operational data through the installation of digital GPS trackers and fuel consumption measurement equipment. The success of these installations varied, with issues encountered including procurement challenges, difficult installation procedures, malfunctioning sensors, and malfunctioning communications between such sensors and the data interface systems. Overall it appeared that equipment or service providers did not have triedand-tested products ready to use in an IPT setting. It was, therefore, necessary to resort to manual tracking of distances covered and fuel purchased or consumed over successive days to calculate actual consumption. Such manual data collection processes also brought challenges, which included securing drivers' or owner collectives' participation, non-working or non-existent vehicle odometers, and reporting errors that were difficult to trace or correct. It was also labour-intensive to undertake such manual surveys, meaning that the resulting samples were small, even if they did yield greater results than what was possible through digital means. From the TRANSITIONS findings, it was clear that in all cities the actual fuel consumption was notably greater than vehicle manufacturers' claims. For example, in Freetown, fuel consumption was found to be 15-50% greater than claimed figures, while in Maputo and Cape Town consumption results were double, three times, or more, compared to manufacturer claims. This does not only confirm that fuel consumption claims are unrealistic, but also highlight the impact that IPT operating and vehicle conditions have on actual volume of fuel consumed. It appears counterintuitive that in Cape Town, where the IPT fleet was the most modern of all the TRANSITIONS case cities, the highest fuel consumption figures were found. In this city, vehicles from one of the monitored ranks operated a ±35km-long route on an freeway, typically spending much of their time in low gears with aggresive cut-andthrust driving and full passengers loads in the highly congested peak traffic direction. Main findings and messages 49 In the other, uncongested return direction, IPT vehicles travel at high speed, at times in excess of the national freeway speed limit of 120km/h. Both these behaviours would incur substantial fuel consumption penalties, and in the return direction such speeds are only possible in Cape Town as it is the only of the case cities with freeway infrastructure. This highlights the importance of understanding actual fuel consumption in the context of local operating conditions and the driver behaviour that such conditions produce. Explaining fuel consumption outliers, or overall elevated consumption, was less clearcut for the other case rank in Cape Town from which feeder-distributor IPT services operated. Since drivers self-reported daily fuel purchases (and in the absence of automated fuel tracking equipment) it was not possible to verify the accuracy of what drivers reported. It is possible that fuel costs might at times be deliberately overreported, so that drivers could motivate owners to reduce the daily vehicle rental (target) amount due and thus end up with more take-home pay. This not only applies to Cape Town, but also in the other TRANSITIONS case cities where the target system is common. Moreover, this explanation for fuel spend over-reporting is speculative, but nonetheless indicates the need for the development of workable electronic fuel consumption measurement techniques. Even allowing for outliers and over-reporting, the increased actual versus on-paper (manufacturers' specifications) fuel consumption found in the field in all TRANSITIONS case cities, translates directly to greater airborne pollutant and GHG emissions – and by extension to health issues - than what is typcially published. According to the Ecoscore tool, when combusted, one litre of diesel translates to 2640g of CO2. If the lowest consumption of 15.3L/100km in Maputo were used, it would translate into 404gCO2/km. Typical lower-order consumption in Cape Town was 26L/100km, equivalent to 686gCO2/km. These figures are of great concern if compared with the EU upper limit target for vans in the period 2020-2024 of 147gCO2/km – less than half of even the lowest figures calculated from the lowest figure that TRANSITIONS found in Freetown, being 319gCO2/km (calculated from 12.1L/100km). The absence of policies in the TRANSITIONS cities to address emissions from IPT was mirrored in the relatively few instances where interviewed stakeholders reported that such emissions were of concern. More problematically, there were no current actions to reduce fuel consumption in the IPT sector, though cleaner fuel standards, roadworthiness requirements and vehicle import age limitations were in place or being introduced in most of these countries no doubt played a role to reduce emissions to some extent, whether directly or indirectly. It is important to note that issues related to vehicle and fuel supply are subject to national and international supply chains and cooperation between multiple public and private stakehoders, and thus are complex matters to address. From a vehicle supply point of view, South Africa's protected new vehicles market has provided a distinct advantage over the other TRANSITIONS countries, though it likely came at cost in terms of higher prices that IPT owners paid for their vehicles. These prices, in turn, stimulated a large vehicle finance industry. It can be argued that such finance made it possible to have newer fleets, but at the same, if the levied interest rates were high – as they were found to be – operators could be left short-changed. 50 It was clear from the TRANSITIONS fuel surveys that IPT operators purchase large volumes of fuel on a daily basis. Indeed, in Cape Town, for example, fuel purchases make up the single largest IPT business cost, even if some allowance is made for some degree of over-reporting. In this city, drivers usually have to pay for fuel (and vehicle rental) out of fare revenue before they have a take-home income. Reducing fuel consumption would directly reduce their fuel expenditure, improving drivers' livelihood prospects. It is likely that such an economic argument would have more traction in the IPT sector than would environmental or societal good arguments. See Section 5.3 for a discussion of potential measures that could contribute to achieving these aims. Abdoun, A., 2018. Fuel quality and emission standard developments in Africa. Africa Clean Mobility Week 2018. Nairobi, UN Environment. Baskin, A., 2018. Slide presentation: Africa Used Vehicle Report. International Energy Agency, 2019. IEA Report: Africa Energy Outlook 2019 Schalekamp, H., Saddier, S., 2020. Emerging business models and service options in the shared transport sector in African cities. VREF for the Mobility and Access in African Cities (MAC) initiative, The state of knowledge and research. Gothenburg, Sweden: Volvo Research and Educational Foundations 28. UNEP, 2020. Used vehicles and the environment – a global overview of used light duty vehicles: flow, scale and regulation. Further resources 04 Institutional and Organisational Characteristics 4.1 Informal Public Transport regulation & enforcement 4.2 Public Transport status and degree of integration with the informal sector 4.3 Organisational and financial models of the informal transport sector 4.4 Labour conditions and remuneration 4.5 Engagement between government and the Informal Public Transport industry Although the term 'informal transport' is in common use, these forms of transport are often subject to several forms of regulation, including highly consequential practices such as fare setting. Understanding the extent to which key regulations such as route licences and vehicle standards are evenly and adequately enforced is important, as failure to do so is a significant contributor to problems of congestion and safety. 52 4.1 Informal Public Transport regulation & enforcement Background In most SSA cities, informal transport operations are subject to differing degrees of both self-regulation, and regulation by public authorities. Additionally, there are examples of so-called hybridity regulation, that seek to enable integration between Formal and Informal PT. Self-regulation usually involves a form of market entry control imposed by operator associations, in order to protect their interests in certain areas/along certain routes. In these circumstances, it is thought that gaining 'permission' to operate may have more to do with kinship and community than effective balancing of transport supply and demand. On occasions, route protection can become violent as drivers compete for passengers 'in the market' to meet daily revenue targets[21]. During stakeholder interviews in Cape Town it was reported that associations have put their own enforcement systems and 'traffic cops' in place to ensure some measure of order. IPT operators can be subject to several forms of regulation by public authorities: IPT fare setting – whereby public authorities agree standard fares with unions/associations, with prices typically (re-)negotiated when there are major changes in fuel prices. Within this section of the report, we look in more detail at organisational aspects of the relationship between public authorities and the IPT sector, from the regulatory mechanisms that typically apply, through to the structuring of IPT operators within unions and associations. This section concludes by looking at the extent of engagement between government and the IPT industry. 53 Membership of a union/association – which provides a mechanism for supporting route licensing, as well as for promoting certain service and labour standards. Quantity/Route licensing – these place controls on the numbers of vehicles that can operate overall and/or on certain routes, and should therefore help to reduce congestion and support the financial viability of operators with a valid license. Vehicle quality standards – involving specification of vehicle safety and emissions standards, with compliance checked through inspections. Driver licensing – drivers are trained and tested to gain a qualification for the relevant size of vehicle and number of passengers carried. Quantity controls Quality controls Traffic management and controls – these comprise the standard rules of driving on a public highway, as well as any special controls and traffic management that relate to IPT, such as where vehicles can stop for passengers to board and alight. These different forms of regulation will all have financial implications for IPT operators, such as the clear and direct effect of fare setting, as well as any route licensing fees that operators also need to pay. Different forms of hybridity regulation, that seek to deliver complementarity between Formal PT 'trunk' services and IPT 'feeder services', have been tested in Nigeria, South Africa and Tanzania. Elsewhere in the world, these have taken different forms of service commissioning and regulation: route licenses with financial rewards, area-based quantity licences; area-based concessions; area-based franchises; and route-based contracts. Significantly, these have included approaches that have sought to ensure operator profitability in return for consistent service delivery at times of the day with reduced passenger travel demand. Comparison of situations and perspectives from the TRANSITIONS cities As established in Section 3.1, the TRANSITIONS cities represent different situations in terms of the complexity and maturity of regulatory frameworks. Nevertheless, the central form of control, route licensing, is in place in all cities to some degree (as shown in Table 3, below), with the exception of an unclear situation in Freetown, and the question therefore arises to what extent the regulatory frameworks are applied and enforced in practice. Fare setting is undertaken for all cities except Cape Town, where the industry associations themselves are able to determine fares. The process involves negotiations between national ministries and unions/associations, but a number of questions remain. It has been stated that fuel prices trigger discussions, but it is not clear how fare affordability and financial viability of services are taken into account. Moreover, it is not apparent whether agreed fare levels are maintained in practice, given the opaque nature of accounting practices. Claims of increased prices during peak hours have been raised in previous studies. [22] 54 Table 3 - Overview of IPT regulation in the case cities Association membership and route licensing Membership of unions/associations and route licensing often appear to go 'hand in hand', with public authorities requiring affiliation with an association when processing operating licenses for specific routes. In the cases of Accra and Kumasi, the national Road Traffic Regulations Legislative Instrument 2180 requires all public transport operators to be members of a transport union and to belong to a station. Moreover, a license should be obtained to operate on specified routes from the local administration (Metropolitan, Municipal and District Assemblies). For IPT to operate legally in Cape Town, each vehicle is required to have an operating license (OL) which indicates the route or routes, and their respective start and end points ("A" and "B" points), on which the vehicle is allowed to operate. A sticker is applied on vehicles to indicate the authorised route numbers. A minibus-taxi association has to support the OL application of an individual operator (i.e. vehicle owner), which in practice means that a prospective MBT operator has to belong to one of these associations in order to operate legally. Speaking about the poda poda operations in Freetown, one government official stated that regulation of the poda-podas was limited to issuing licenses to drivers and vehicles and routing them. Others stated that the informal transport industry is not yet sufficiently defined by policy and regulation, but that the government is working on formalizing and creating policy and regulations for them. 55 More recently, public authorities have taken legislative steps to improve safety and efficiency of IPT. In 2019, the Municipality of Maputo stopped licensing new minibuses with 15 seats, allowing only the renewal of annual licences for these types of vehicles. The intention is to promote a migration to 26 seat vehicles in the future. Two years ago, the municipality also introduced regulations to prohibit the carrying out of passenger transport with MyLoves, supported by an intensive enforcement campaign by municipal police that was generally effective in implementing the ban. Nevertheless, given the pressure to provide transportation, the municipality is reconsidering the need to allow MyLoves to operate, but with improved conditions. In the case of Maputo, IPT regulation stems from the 1989 Transport Regulations for Automobiles (RTA - Decreto nº. 24/89, de 8 de Agosto) that first authorised, through licensing, the circulation of private collective transport. These took the form of Chapa 100, which were more similar to the services now known as MyLoves (open-back vans). Failure of route licensing approaches appear to occur for three main reasons: first of all, there can be large numbers of unions and associations and there is no clear incentive for them to limit their membership or the numbers of vehicles operating on routes. In the case of the Kumasi Metropolitan Area, there are around 24 registered unions and, while each union should have a clear mandate (such as to operate a certain route or to carry freight), various transport unions are now not operating according to these mandates. Additionally, it was claimed that some unions have now waived their registration fees in order to attract members. Secondly, the route licensing process by the local public authority may not be sufficiently well managed. In the case of Cape Town, it has been claimed that the Operating License system is failing to adequately match supply with demand. An oversupply of service on existing routes, as well as jostling to serve new urban development, has led the associations to set up their own enforcement approaches to avoid destructive competition. 56 And finally, adherence to route licensing is not sufficiently enforced by the local public authorities that issue permissions. Stakeholders in both Accra and Kumasi have observed a growing presence of 'floaters' or waawaa (as they are known locally in Kumasi) - unregistered trotros which operate outside of the unionised terminal system. During interviews, union leaders claimed that there are now more 'floating' trotros operating in Accra than registered ones, while for Kumasi, it was stated that enforcement activities were more effective in the past, making it difficult for any trotro operator to stop anywhere by the roadside. The prospect of corruption amongst enforcement officials was raised as a reason for increased 'floater' operations. By making discrete payments to officials, it was advised that waawaa operators can avoid queuing for passengers at the terminals. The need for more effective competition management and enforcement mechanisms appears to be a priority common to all cities. Vehicle quality standards A set out in further detail in Section 3.7, processes for ensuring the quality of vehicles are most developed in the case of the Cape Town. As allowed for in the National Land Transport Act of 2009, the National Department of Transport (NDoT) specifies the safety standards for, and from time to time issues an approved list of, vehicles that can be used as minibustaxis (MBTs). From the MBT operator perspective [25], it was reported that traffic law enforcement tends to focus on MBT vehicles to a greater extent than on other forms of public transport or road users. This is particularly by comparison to buses, where officers are purported to turn a blind eye on vehicle defects or overloading. Traffic officers pull over minibuses for any perceived infraction, forcing passengers to disembark without concern for their onward travel or financial situation (MBT fares are paid in cash, thus passengers need to pay again to continue their journey on another vehicle or mode). A similar problem was observed in Maputo. During the TRANSITIONS interviews, it was stated that "if you don't pay then they'll look for something to get you in to trouble, so people are forced to pay anything, almost every day." During the surveys of the crews, 39% of those surveyed identified paying the police officers as one of their usual operating expenses. In relation to Kumasi, the overseeing the inspection of vehicles appears to be left in the hands of Unions, in which case inconsistent practices might be assumed. No routine checks of vehicles were reported for Freetown. Driver licensing Holding a valid commercial driving licence is a prerequisite for registering as a driver with associations and unions in Accra, Kumasi and Cape Town, while a standard driving licence is sufficient to drive a poda poda in Freetown. Stakeholders in Freetown highlighted the need for dedicated training, relating to both the comfort and safety of passengers. As discussed further in Sections 3.5 and 4.4, driving behaviours are also influenced by competition for passengers and road conditions, hence addressing this aspect of service delivery is best achieved through a combination of actions. Fare setting is a widely established practice, occuring in four of the five TRANSITIONS study cities, but the process is not well understood. Given that it is a key determinant of both business viability and the affordability of mobility, it is a subject worthy of further research. Route licensing is a central component of IPT regulation and is considered a basic requirement of following the TRANSITIONS Routemap, which in turn requires that three main challenges are overcome: unions/associations do not have a clear incentive to limit their membership so oversupply may result; public authorities often lack the knowledge and process to monitor vehicles numbers and adequately match supply with demand when issuing licenses; and route licenses are often not adequately checked and enforced. Without proper enforcement of route licensing, then aggressive competition on routes and the associated congestion and road safety issues result in a spiral of decline. In these circumstances, the illegal operators such as waawaa in Ghana and pirates in Cape Town can proliferate. Creating clear enforcement structures, and potentially a dedicated team linked to a transport authority, may be necessary in order to avoid issues of corruption. 57 Main findings and messages Bayliss 2002 'Review: Urban public transport competition' – This paper presents a helpful representation of the spectrum of urban public transport (regulatory and procurement) regimes, from open market through to public monopoly, specifying a 'Paratransit' IPT domain, alongside a 'Fixed Track domain' relating to formal PT. Durant et al. 2022 'Re-evaluating roles and relationships between city authorities and informal public transport operators in Sub-Saharan Africa: a comparative analysis of five cities.' This paper, presented at the Thredbo Conference in September 2022, seeks to position the five case cities in relation to the regulatory spectrum described by Bayliss 2002, providing further commentary in relation to the text above. Further resources In most African cities Informal Public Transport services are offered next to or in competition with other (types) of informal or formal operators including those offering bus and rail services. Sometimes they share official public transport (interchange) facilities. Even though co-existing, the level of co-ordination between informal operators themselves, as well as between the IPT sector and formal bus or rail operators, is often non-existing or lacking. In these circumstances, achieving full integration of public and shared mobility, at the level of routes, frequencies, timetables, fares and payment systems, feels a distant prospect. 58 4.2 Public Transport status and degree of integration with the informal sector Background As described in the preceding sections, IPT operators are typically subject to at least some degree of regulation by public authorities, as well as self-regulation that occurs between different unions and associations. Despite this, achieving integration with other informal operators and with formal bus and rail operators will be more complicated than in the case of two or more formal, regulated, systems. Public transport integration is usually undertaken with the purpose of facilitating seamless, multi-operator passenger journeys. Integration thereby includes the organisation of modes and services into a rational system of operational features in terms of routes, frequencies, timetables, fares and ticketing, as well as policy aspects, such as planning, marketing and development. In this regard, it is possible to distinguish at least five levels of possible co-ordination integration: 1) physical integration thereby establishing transfer points between networks; 2) fare integration; 3) information integration; 4) institutional integration whereby the public sector is involved somehow; and 5) inter-operator integration whereby two or more parties integrated routes and/or fares. [22] The ultimate goal of any type of integration could be to enhance 1) reliability, security and comfort of the transfer, 2) minimize travel and transfer times, and/or to 3) reduce cost and discomfort of (inter-operator) transfers. Integration therefore seeks to achieve these aims by creating transfer of data/information and physical interchanges between informal operators and/or between informal and formal operators, by applying any combination of the five levels of integration. In Sub-Saharan Africa, the practice of integration has so far only really happened at the level of physical integration at or near interchange facilities between bus, rail and informal services. Additionally, there are a few cases where informal operators share routes and help each other out during periods of high demand. In the case of South Africa there is a statutory requirement for integrated transport planning including service routing and the siting of stations and public transport interchanges[23]. A successful case of modal integration and transfer relates to 'first and last mile' connectivity to and from rail and BRT services in Gauteng, South Africa, where reasonable integration with the formal services is observed, although the integration with informal transport services remains weak[24]. In Dar es Salaam integration between BRT and daladala services is accommodated in some end-of-line terminals and in-line stations, but here too integration with informal feeder routes remains largely incomplete[25]. All five TRANSITIONS cities have formal public transport systems operating next to informal systems, such as the Sierra Leone Road Transport Corporation and several ferry routes in Freetown or the MyCiTi BRT system and a regular bus service (GABS) in Cape Town. There are plenty opportunities for improvements to the integration of the systems. Nevertheless, the stakeholder interviews undertaken in all five cities show that there is hardly any coordination, let alone integration, between the formal and informal systems (See Table 3 for the overview of coordination and integration in place). Route licensing approaches introduced in 4.1 would represent a first step towards coordination and integration, by preventing damaging competition between modes on key corridors and defining key interchanges. This would require the poor levels of enforcement observed, particularly in Accra, Kumasi and Freetown, to be improved. Reasons for the lack of integration typically relate to lack of trust, bad image, lack of transparency and fragmentation of the informal industry. 59 Comparison of situations and perspectives from the TRANSITIONS cities Table 4 - Overview of types of transport coordination and integration in the case cities Public transport integration enables improvements in the ease and efficiency of taking public transport (formal and informal) for passengers in terms of time, cost, comfort, safety, access and accessibility, and convenience. The informal, self-regulatory and fragmented nature of IPT systems, by definition poses a challenge to achieving the different possible forms of integration: physical integration of route networks; route planning information; fares. Physical integration, at public transport interchanges, is the most feasible kind of integration that has been achieved (at least to some extent) in metropolitan areas in South Africa and Tanzania. 60 Main findings and messages Chengula, D. H., Kombe, K. (2017). Assessment of the Effectiveness of Dar es Salaam Bus Rapid Transit (DBRT). International Journal of Sciences, 36, 10-30. Venter, C., Barrett, I., Zuidgeest, M., Cheure, N. (2020). Public transport system design and modal integration in Sub-Saharan African Cities. Position paper: The state of knowledge and research. Volvo Research and Educational Foundations (VREF) Further resources 61 While to the observer, the on-road bustle of Informal Public Transport vehicles may appear chaotic, underlying these operations are complex hierarchical structures of self-organisation and varying business models. Understanding these structures and models, and the interests of different actors, will be essential to any attempt to work with and modify operations in this sector. 4.3 Organisational and financial models of the informal transport sector The collective organisation of informal public transport in Sub-Saharan African cities takes a variety of forms. The most widespread form is that of route associations, formed by operators to protect and self-regulate their markets. In most associations, membership is composed exclusively of vehicle owners, although some include vehicle drivers as well. As identified in Section 4.1, regulatory authorities sometimes require membership of a collective organisation in licensing regimes. Informal transport businesses can organise collectively at varying geographical scales and with differing levels of public authority sanction and support. In some countries there are national or regional supra-associations established to represent collective owner interests. Examples include the National Union of Road Transport Workers (NURTW) in Nigeria (Agbiboa 2020), which has developed to become a large organisation (circa 100,000 membership) formed through the merger of a number of existing unions/associations. NURTW dominates the urban and small vehicles sector, while the owner-centric Road Transport Employers Association of Nigeria (RTEAN) dominates the inter-urban and large bus sectors (Mobereaola 2009). It is important to note that IPT business models are typically based around the commercial relationship between a vehicle owner and the driver, except in the smaller proportion of cases of vehicle owner-drivers. This has a profound effect on employment conditions, as well as IPT operations on the road (as explored further in Section 4.3). The Savings and Credit Cooperatives (SACCOs) and Transport Management Companies (TMCs) found in Kenya represent an alternative organisational and financial model and have therefore been a particular focus of study, in part due to the improvements in service quality that have been achieved through improved access to finance and driver remuneration and welfare. Background Comparison of situations and perspectives from the TRANSITIONS cities Table 5 (below) provides a summary comparison of IPT organisational and driver remuneration approaches in the TRANSITIONS case cities. 62 Industry organisation - In all the case cities there are large informal IPT vehicle fleets in operation, with varying degrees of hierarchical self-organisation. In Accra there are over 11,000 trotro vehicles operating from over 300 trotro terminals, and which are organised into at least 25 unions and associations. In Kumasi there are around 9,000 trotro vehicles operating (4,000 legally and 5,000 illegally), organised into 24 registered unions in the Kumasi Metropolitan Assembly, and into eight and three unions in Ejisu and Tafo respectively. In Freetown there are around 5 500 poda-poda vehicles operating. In Cape Town there are between 10,400 and 14,200 minibus-taxi vehicles operating (over 7,700 legally and between 2,600 and 6,500 illegally), organised into 102 route associations. In Accra and Kumasi, trotros are organised into 'branches', with each branch operating a specific route or set of routes. Structures within branches, called 'locals', sometimes separate and become branches in their own right. As outlined in Section 4.1, it is mandatory for all trotro (and taxicab) operators to be a member of a registered union, the largest of which is the Ghana Private Road Transport Union (GPRTU), which represents around 70% of operators. Table 5 - Overview of IPT organisation and remuneration approaches in the case cities 63 Its membership includes both vehicle owners and drivers. Founded in 1967, GPRTU historically enjoyed a monopoly in controling and representing Ghana's trotro industry. However, in 2005 the Progressive Transport Owners Association (PROTOA) was allowed to compete in the same environment. The Ghana Co-operative Transport Association (GCTA) (known as the 'Co-op') is a further, more recent national organization which respresents trotro (and taxicab) owners and drivers. In Kumasi, in addition to GPRTU, PROTOA and GCTA there are 21 smaller unions, some of which are organised under an umbrella body called the Ghana Road Transport Coordinating Council (GRTCC). In contrast to Accra and Kumasi, in Freetown the informal transport industry organisation members are drivers, not vehicle owners and drivers. Poda-poda (and okada threewheeler vehicle) drivers are organised into operator associations that establish district branches in the city. District branches are divided further into 'park committees', which directly manage the daily affairs of the 'parks'. The overarching operator associations are the Sierra Leone Drivers' Union and the General Motor Transport Workers Association. In Cape Town, unlike in the West African cities, the informal transport industry is organised only around minibus services, and only vehicle owners are represented. Minibus-taxi vehicle owners are organised into multiple route associations, the majority of which are in turn affiliated to six regional supra-associations (known as 'motherbodies'). Funded by route association member contributions, the 'motherbodies' make decisions to better serve passenger demand (e.g., to expand services and ranking sites to limit the need for transfers) and maintain discipline amongst route association members. There are two national supra-associations: the South African National Taxi Council (SANTACO); and the National Taxi Alliance (NTA). SANTACO has a provincial sub-body in the Western Cape. Functions and services - With regard to the functions of operator bodies and the services they offer to members, the operator unions at national and branch levels in Accra provide a channel of communication with government agencies. The relationship between the unions and the regulatory authorities is focussed on the periodic negotiation of fares, and the acquisition of vehicle fleets. The Ghana Ministry of Transport has assisted GPRTU in the purchase of newer vehicles, by acting as intermediary or guarantor on large transactions. To join a branch a trotro driver must hold a valid driver's licence, and in some instances pay a joining fee. To join a branch a vehicle owner must pay a once-off fee. Union members pay monthly fees, which cover the day-to-day running of the union and contribute towards a member welfare scheme. In addition, every driver pays a daily 'booking fee' so that their vehicle is added to a loading board and can operate on a given route. This fee contributes to the general costs of running the terminal, including paying station workers such as porters, as well as contributing to the union's welfare fund. Belonging to a union gives the member financial support in the event of sickness or death, an annual share of bonuses, and training on various topics. In Kumasi a typical terminal is comprised of a number of 'branches', affiliated to different transport unions. The branch leadership organises passenger loading arrangements and ensures compliance with regulations. They collect fees and represent members during stakeholder engagements. Some unions have waivered joining fees in order to attract members and thereby reduce the proportion of illegal operators (known as 'wawaas'). They ensure that driver applicants hold a valid drivers' license and are at least 25 years old, and they check the physical condition of vehicles. Some unions are able to provide financial support to members in good standing who need money for vehicle maintenance. Like in Accra, driver booking fees contribute to a welfare fund. 64 In Freetown the poda-poda driver's union advances the working conditions of members, and represents member interests in engagements with government agencies. At the national level, the union engages around fare setting, while at local level it manages the operation of vehicles at each of the 'parks' within the city. The drivers' union obtains funds from membership fees, service fees, and donations. In Cape Town, route associations derive income from vehicle owner members, and regional 'motherbodies' derive income from route association members. Unlike in the West African cities, there is no organisation drivers can join dedicated to advancing their interests. Motherbodies and associations use their membership income to monitor operations and passenger demand to inform operational decisions. Administrative functions include support for operating license applications, adjustments and renewals, as well as support to members when dealing with law enforcement agencies. Business and financial models - With regard to business operating models, in Accra both GPRTU and GCTA require the payment of basic salaries to drivers, which correspond to half the amount of their daily farebox revenue. Any additional source of revenue is allocated to vehicle crews. Expenses associated with trotro operation are the cost of fuel, daily target (i.e. the half of farebox revenue allocated to the vehicle owner), vehicle maintenance, operating licence, union membership, roadworthiness certificate, vehicle insurance, and tax. The cost of fuel is the largest expense. In Kumasi, trotro drivers enter into agreements with owners regarding the portion of farebox revenue that needs to be paid at the end of each month. Any extra revenue above this portion is kept by the driver. Apart from the owners portion of farebox revenue, the drivers' expenses include cost of fuel, vehicle maintenance, operating permits, payment to conductors, payment to touts for loading passengers, and booking fees (set by GPRTU at 10% of farebox revenue). 65 As in Accra, the unions therefore sometimes apply for loans from commercial banks to purchase vehicles on behalf of members. The main challenge in qualifiying for bank loans is collateral. Typically owners pay about twice the purchase price of the vehicle, over a period of about 2-3 years. Some unions have purchased collectively-owned vehicles and plots of land out of membership and booking fees. Membership fees are also sometimes used for maintaining facilities at stations. In Freetown, the acquisition and maintenance of poda-poda vehicles is financed by private individuals. There is no funding opportunity by either government or private banks. Vehicles are purchased from Europe or America by private individuals with the necessary financial resources. Vehicle owners then recruit drivers who operate the minibuses and pay the owners a share of farebox revenue at the end of each day. Sometimes the drivers pay the money to an intermediary who collects it on behalf of the owners. They also pay themselves from whatever they make after they have earned the 'master money' (i.e., the daily target). In Cape Town, drivers collect fares, out of which they pay vehicle rental to the owner (i.e., the daily target), all fuel costs, and the wages of a conductor (known as a 'gaatjie') (although not all drivers make use of gaatjies). Some associations have introduced a commission model, similar to that in Accra and Kumasi, to counteract the aggressive driver behaviour that the target system creates. New vehicles are acquired through bank loans and there is one finance house (SA Taxi) dedicated to this industry. Assistance from the state has taken the form of a Taxi Recapitalisation Programme, through which scrapping allowances are available to owners who surrender and replace old vehicles. Main findings and messages What then are the main similarities and differences found across the case cities? A notable similarity is that all the cities have nested hierarchical structures of industry representation. Clearly different organisation structures are needed to manage issues that range from vehicle queuing at local ranks, to fare setting, to national policy negotiation. A notable difference is that Cape Town has no dedicated body to represent drivers' interests, while the other cities do. There may be a correlation between the inclusion of drivers in the unions in Ghana, and the slightly more secure commission-based remuneration model prevalent in Accra and Kumasi. The South African industry structures also do not include for-hire transport service operators, but the consequences of this are unclear. A further difference is the private financial institutions supporting new vehicle acquisition in Cape Town, and state vehicle renewal subsidy support. Organisations and approaches for supporting improvements to vehicles fleets are less well developed (or non-existent) in the other cities. 66 Baffi, S. & Lannes, J-P. (2021). Understanding Paratransit: Defining and diagnosing paratransit for sustainable mobility planning. Mobilise Your City. Behrens, R., McCormick, D., Orero, R., & Ommeh, M. (2017). Improving paratransit service: Lessons from inter-city matatu cooperatives in Kenya. Transport Policy, 53, 70-88. Fortune, G. (2022). Informal transportation and decarbonization. Discussion Paper, World Bank Group. Kumar, A., Zimmerman. S. & Arroyo-Arroyo, F. (2021). Myths and realities of "informal" public transport in developing countries: Approaches for improving the sector. SSATP Discussion Paper, World Bank Group. Further resources 4.4 Labour conditions and remuneration Regrettably, employment conditions in the IPT sector are characterised by low and uncertain levels of income, as well limited long-term welfare options. Nevertheless, the value of these jobs should not be underestimated in fragile economies where families are absolutely reliant on the income for the most basic needs. This employment situation, and the effects of 'target' and commission based payment approaches, impacts directly upon the behaviour of drivers as they compete for passengers, resulting in inefficient and dangerous practices. Background Several studies have reported ubiquitous informal employment conditions in the IPT sector, which are often exploitative in nature, and have identified three main forms of driver remuneration. It is thought that driver payment is most commonly based on a 'target system' in which drivers keep the fare revenue that is left, once fuel, vehicle rental costs and other costs are deducted. A second form, considered to be less common, involves the payment of a commission based upon an agreed portion of weekly farebox revenue. And finally, there are cases of where fixed salaries are paid, typically with an additional ridership bonus incentive, as is the case of Transport Management Companies (TMCs) in Nairobi. More specific examples that can be drawn from the literature on this subject include the following: 67 Research published in 2002 examined exploitative labour relations amongst daladala minibus businesses in Dar es Salaam, revealing that 83% of respondents were employed casually, without any recorded agreement on wages or conditions of service and remunerated on the basis of the target system. The ability of vehicle crews to negotiate the daily target was found to be severely curtailed, due to high levels of prevailing unemployment and labour turnover. Eight months of ethnographic fieldwork to study the experiences and micropolitics of danfo minibus crews in Lagos, revealed that working conditions were both insecure and dangerous. Interviews with matatu business owners in Nairobi have shown that that exploitative and insecure labour conditions have a negative impact on regulatory compliance (in relation to operating permissions and traffic laws). Comparison of situations and perspectives from the TRANSITIONS cities Information on the driver wage practices in each city, and the role of IPT unions in representing drivers, were introduced at Section 4.3 (Business and financial models) and are summarised in Table 5. In Cape Town, Freetown and Maputo, the target-based system of remuneration is in place (with an element of commission in the latter city), while in Accra and Kumasi driver salaries are based on commission. During the TRANSITIONS workshops the project gained further insights into the work of the Unions, their primary concerns and the types of initiatives they take to support drivers and crew. In one working group discussion, a union representative expressed concern about a public authority initiative to provide larger buses, which could result in job losses amongst the large number of minibus drivers. In the case of Accra, TRANSITIONS project members visited a central terminal and heard of the Unions efforts to purchase a plot of land where its drivers could, over time, build their own houses. In both Accra and Kumasi, the unions play a role in providing financial support to members in case of illness or injuries. The unions rely on the payment of small fees in order to provide these social benefits, which are also used for other priorities including the management of terminals and ranks, as well as night-time security, as is the case in Cape Town. Employment of women in the sector – Creation of employment opportunities for women in the transport sector is considered important to reduce so-called 'gender blindness', leading to the provision of services that are more sensitive to the needs and concerns of women passengers (see Section 3.5 for information on sexual harassment problems). Stakeholder interviews undertaken in the case cities therefore sought to gain an indication of the proportion of women employed in the industry. The overwhelming response was that in most cities, there is only a very small number of women involved in IPT sector jobs, such as working as crew on vehicles or in administrational roles within Unions. One exception is that of Freetown, where women are employed in executive positions (National Treasurer, National Finance Secretary) as well as driving IPT vehicles. Unfortunately, this greater representation of women in the workforce is due to the civil war, rather than a positive policy initiative, as necessity resulted in women taking on jobs that would previously have been undertaken by men. 68 Main findings and messages Working conditions in the sector are quite similar across TRANSITIONS cities, indicating that public authority initiatives to professionalise the sector and improve working conditions are so far limited in number, reach and scale. Unions and associations do seek to provide housing and social support for their workers, but their financial capacity to deliver this is limited, when we consider that their fees are only one of a number of outgoings that a driver needs to pay for, before they can take a salary. With the exception of Freetown, then women employment in the IPT sector is very limited. Changing this dynamic would help contribute towards more gender sensitive operational practices in the industry, as part of a wider drive towards professionalisation and improved service provision. Boateng, F.G., 2020. "Indiscipline" in context: a political-economic grounding for dangerous driving behaviors among tro-tro drivers in Ghana. Humanity Social Science Community 7, 8. UN Women / World Bank Gender Equality in Transportation Online course - https://olc.worldbank.org/content/gender-equality-transportation-self-paced Further resources 69 4.5 Engagement between government and the Informal Public Transport industry the improvement of physical assets (e.g. vehicle fleets or provision or upgrade of infrastructure), the restructuring of informal transport businesses into companies or cooperatives, the professional development (or "capacity building") of drivers, business owners, civil servants the introduction of information and communication technologies (ICT), often through mobile phones. Channels for engagement between public authorities and the IPT sector appear to have been shaped by two main needs. The first relates to the ongoing management and adjustment of the regulatory framework, and in particular, the process of fare-setting (as referred to in preceding sections). A second form of engagement has been triggered by major schemes and projects that have important implications for the IPT sector, and where international donor agencies are also typically involved. The most notable cluster of such projects have involved proposals to introduce Bus Rapid Transit in cities on the continent, which has been achieved in South Africa, Dar-es-Saleem and Lagos. In these cases, engagement between the IPT sector, public authorities and development actors have commonly sought to address four major issues and outcomes: The largest such endeavour has been in South Africa, where informal operators were engaged to be the operators of the new bus services. Achieving this shift certainly required complex exchanges, and there remains a lack of comprehensive and clear evaluations of the 'successes of such schemes from the perspectives of both the public authority and IPT sector. A smaller cluster of major projects – where informal transport businesses lay at the core – have been fleet upgrading programmes, such as those in Cape Town and Dakar. While such engagement in the context of projects is well-intended, it is important to question the extent to which the parameters of these schemes (e.g. size and number of buses, routes, conditions for IPT operators) were set through involvement with the IPT sector, or were defended through consultation with the sector once key decisions were already made. In other words, to what extent are the projects 'top-down' or 'bottom-up' initiatives. Background It is rare to see a trouble-free relationship between the IPT sector and the government. In nature, informal transport developed in reaction to a lack of action from the government's side, or an inefficient or insufficient institutional public transport service. Supporting or recognizing the informal sector as an essential player might therefore be viewed as an admission of failure by public authorities. However, in the context of rapid urban growth and urgent need to develop public transport services, more and more governments are seeking to engage with the IPT sector to find solutions or to integrate them to a higher-capacity system. 70 Comparison of situations and perspectives from the TRANSITIONS cities Periodic negotiation of transportation fares - following variations in fuel prices Acquisition of rolling stock – the Ministry of Transport has historically assisted GPRTU in the purchase of newer vehicles, by acting as intermediary or guarantor on large transactions (the scale of this scheme needs to be researched further). In Accra, the relationship between unions and the public authorities is structured around two main areas of cooperation: In terms of projects to reintroduce large bus systems, original plans to implement a BRT system in Accra were not successful, although the Aayalolo Bus Service (ABS) was eventually introduced on the Amasaman to Central Business District Corridor in 2016 [29]. This project does present lessons to other cities where major schemes are proposed. When the scheme was initiated, three major IPT unions were invited to form transport companies to be able to operate the bus services, but several decisions made the process ineffective: (i) these companies represented only the executives of the unions, and neither the crew nor the owners were shareholders, (ii) no mechanism was put in place to reduce the number of trotros operating along the bus corridor – creating competition, (iii) while the bus companies were supposed to purchase the vehicles they were going to operate, the Government of Ghana went ahead and bought the buses, without pre-defining a retrocession mechanism to the operators. This created a situation where the role of Greater Accra Passenger Transport Executive (GAPTE) was forced to change from regulatory authority to operator, and finally, in the absence of a sound business model, revenues were not able to cover operating expenses (fuel, salaries), which affected the quality of service. The feasibility of a BRT scheme for Kumasi, that would make use of buses purchased for the Aayalolo services, is currently being assessed. Cape Town is known for the successful implementation of the first phase of a BRT system and its innovative approach to the integration of informal transport, which was reflected in the Cape Town Comprehensive Integrated Transport Plan (CITP). Informal operators were invited to form new companies to run new services (including BRT), following a three-step approach: (i) rationalize the transport network, (ii) optimize operations, (iii) renew the fleet. In 2017, several minibus-taxi associations were invited to take part in a pilot program which looked at improving the business model and creating new transport companies, which ultimately could be contracted by the city. The introduction of scheduled services in association with rationalised service routes (from 3 to 5 routes) and vehicle fleets (from 78 to 32 vehicles) contributed to improve services significantly, reduce the fuel consumption by 45%, and reduce the number of working hours for the drivers. However, the relationship between the minibus-taxi industry and the government remains instable and tense, with significant mistrust, poor coordination and violent competition among operators. In Freetown, the relationship between the informal sector and the government has in the past been minimal, and restricted largely to fare setting. It is understood that the channels for communication are now opening. Engagement with the IPT sector appears to be based primarily on regulatory matters, or major projects with largely fixed parameters. Examples of 'bottom up' initiatives that involve the IPT sector in the planning process for transport improvements are more limited or absent. IPT operators provide an essential service to the population and have a knowledge of passenger demand and operating constraints that is precious and that should be taken into account in any transport network restructuring or mass transit project. 71 Main findings and messages Between 2013 and 2016, Maputo's government took the initiative to create cooperatives from the existing associations, providing the incentive that the IPT operators would receive brand new buses delivered by the government. This '1000 Buses Plan', involved the provision of 385 buses and 15 mixed vehicles to Chapas IPT operators that were willing to reform as cooperatives. The unions Asoctra and Atromap now operate these new buses, but this experience has not been without problems. It is understood that the initiative created a strong tension in the ASOCTRA association, which resulted in the departure of more than two-thirds of its members. Meanwhile the Atrimu association is not involved, but has strongly expressed its desire to be integrated into this kind of programme. Schalekamp, H., 2015. Paratransit operators' participation in public transport reform in Cape Town: a qualitative investigation of their business aspirations and attitudes to reform. Ph.D. thesis, University of Cape Town. Van Schalwyk, D., 2011. A troubled journey: The South African government and the Taxi Recapitalisation Policy, 1998-2008 (No. 1). Ph.D. Thesis, University of the Free State. Further resources 05 Actions for clean, affordable and safe 'informal' public transport 5.1 Infrastructure and operations 5.2 Network management and Urban Vehicle Access Regulations 5.3 Fleet and fuel 5.4 Business development 5.5 Digital passenger services 5.1 Infrastructure and operations 73 Having explored the structure of the IPT sector and its relationship with public authorities (in relation to regulation and wider engagement), in this section we cover five main categories of actions that could be taken to improve IPT services. Examples of these actions are provided where possible, together with related experiences and perspectives from the TRANSITIONS case cities. This category of actions encompasses both 'hard' infrastructure measures and 'soft' management measures, the latter of which seek to optimise the use of available highway and terminal space to achieve efficiency and safety aims. During the TRANSITIONS research work, both passengers and union/association representatives highlighted the deficiency of existing terminals/stations, identifying that even simple improvements would make a substantial difference for passenger comfort. As listed in the table below, potential actions for infrastructure improvements extend well beyond terminals, to the provision of dedicated lanes for public transport (including informal public transport) and designation of bus stops with suitable shelter and safe curb-side spaces for waiting passengers. In some areas of cities, improving the basic road surfaces may be the priority as this will contribute significantly to passenger comfort, as well as vehicle efficiency and speed. Where hard infrastructure improvements are made, then consideration also needs to be given to management and enforcement requirements to ensure they are used in the way intended. Taking into account the capacities of relevant public authorities, concentration of enforcement resources around key 'bottlenecks' and connections in the transport network may well be most realistic. The table below identifies the main types of actions that could be undertaken. Overview of types of actions Stark contrasts are evident in the quality of transport infrastructure in the cities of Sub-Saharan Africa, ranging from modern city centres to rudimentary, un-paved roads in rapidly urbanising hinterlands. Given the emphasis on providing clean and affordable mobility for all citizens, an infrastructure investment strategy supporting the role of IPT services could be expected to focus on getting the basics right: comfort and safety for passengers, together with priority measures on the highway for shared mobility. Examples of IPT-oriented infrastructure projects and good practice case studies are limited, hence learning must also be drawn from more general guidance for public transport and multi-modal interchange provision. 74 TRANSITIONS did not undertake surveys of infrastructure provision, the quality of terminals and conditions 'on the road' and on the roadside. Nevertheless, perspectives have been gained through a combination of the local knowledge of the City Research Leaders and feedback received in the stakeholder interviews and passenger opinions surveys. Experience and perspectives from the TRANSITIONS cities Action type Description Comments and case studies Terminal/station provision The TRANSITIONS cities of Accra and Kumasi provide examples of both underdeveloped and redeveloped terminals, including lessons to be drawn from these situations (see below). Dedicated space for terminals should be provided, taking into account related activities such as trading, storage of materials, etc. Bus/informal transport priority lanes Terminals form a key part of the passenger experience, with thousands or even millions of passengers passing through on a daily basis. In some cases, unions and associations have secured dedicated sites, but often terminals are established informally using carriageway space and shoulders at road junctions. Road network and terminal management/ITS Improvements to road surfacing and condition (typically peripheral areas) Secondary interchanges and bus stops along routes Safe infrastructure and public space for walkers & cyclists at terminals Dedicated lanes for licensed IPT could be provided along trunk routes, enabling these services to pass other traffic, leading to improvements in speed and efficiency. Where provision along a full route is not feasible, priority measures can be provided at key junctions. BMT lanes (for Buses and Minibus-taxis) were introduced on the N2 freeway (an 11km section) in Cape Town during the period 2006-7.[30] Priority restrictions for formal and Informal Public Transport are in place during peak hours. [31] The City of Johannesburg considered provision of dedicated minibus-taxi lanes as part of its Strategic Public Transport Network review in the early 2000s, but this idea was not implemented due to the BRT plans emerging at the time.[32] Road network management involves active management of existing infrastructure to reduce congestion and improve safety. This can involve, for example, control of IPT and other passenger transport vehicles at official and unofficial stopping places, to avoid them lingering, clustering, blocking each other's passage, etc., which can cause serious restriction to the roadway. Alongside the deployment of police and road traffic enforcement teams, Intelligent Transport Systems (ITS) can be deployed as digital solutions for: data collection; monitoring and real-type management of situations (e.g. through traffic signals); and enforcement (e.g. registration plate recognition). Management of IPT operations and vehicle movements are currently influenced by a combination of traffic rules and police enforcement, together with association and operator influenced vehicle queuing and loading practices at key locations in the network such as terminals. A first step may involve good training for police and other enforcement teams on situational awareness and communication, to ensure they function effectively and don't just make matters worse. Other than traffic signals at junctions (e.g. deployment on a key corridor in Accra), ITS does not yet play a significant role, with commentators suggesting that 'western' ITS solutions are not yet suitable in the context of SSA.[33] Providing for safe and comfortable waiting spaces at stops, together with convenient interchange between modes, such as to formal public transport and walking, need to be carefully considered and provide for in improvements along IPT corridors. A defined and safe waiting area with appropriate surfacing, safe access to/from the stop, adequate lighting and basic information on the route and destinations should be provided. Where road conditions are poor, this will have impacts upon passenger comfort and vehicle efficiency. In many cases then the condition of paved roads degenerates rapidly without due attention, with potholes emerging. This reduces speeds as vehicles weave to avoid the worst sections and bumps that cannot be avoided cause wear and tear on the vehicles. Unpaved roads may become unpassable in the rainy season and deeply rutted, resulting in the need for rehabilitation. Regular maintenance and desilting of drains should be undertaken, so that stormwater drains as it should, avoiding needless flooding and keeping the main roads passable even in heavy rains. Interchange between modes, such as to walking, cycling and formal public transport, need to be carefully considered and provided for in the design. The needs of mobility impaired (disabled) passengers also need to be taken into account. The Comprehensive Integrated Transport Plan (2018-2023) of Cape Town's Transport and Urban Development Authority includes a specific plan for the development of walking and cycling networks and a clear objective to integrate walking and cycling (NMT – Non-Motorised Transport) with rail and road-based forms of public transport. 75 IPT terminals - The condition of terminals have been a particular focus of discussion given their pivotal role as multi-modal interchanges and as an important part of the passenger experience. Accra provides an example of a city where the condition of the terminals was identified as a priority area for improvement by passengers. In the case of the Kimbu Terminal, the main yard area for Trotros to wait and load passengers is unpaved, resulting in a dusty environment on dry days and muddy conditions during the rainy season. Association representatives identified that simple measures such as spreading chippings across the yard would already make a difference, indicating that the public authorities could undertake this type of action. Many trotros seek to avoid queuing in the terminal located inside the new building, by enabling passengers to board and alight on main road. This causes congestion as visible in the photo, and therefore both design and enforcement measures need to be carefully considered to ensure efficient vehicle flow in and around terminals. Retail space is provided on an upper floor, rather than alongside the terminal, which may reduce the number of 'convenience' purchases made. Attention needs to be paid to the design of pedestrian infrastructure, to enable safe and convenient access to the terminal across highways. Taking into account that the capacity of terminals is limited and that IPT vehicles often also queue on neighbouring roads, this can results in an uncomfortable and disorienting environment, particularly for those with mobility impairments[34]. Kumasi provides an example of where a modern terminal design has been delivered, which helps with the identification of important design elements. The Kejetia Transport Terminal was recently transformed from a largely 'open air' facility into a modern building providing an IPT terminal and off-street parking, as well as restaurants, a police station and offices (see Figure 14). Taking the perspective of IPT operators and passengers, then important considerations include: Passengers also identified the absence of and/or uncleanliness of seating areas, and lack of public facilities such as toilets. Similar problems were identified in Freetown, where the waiting conditions for IPT crew and passengers are uncomfortable. Observations on the terminals in Freetown also highlight their important function as retail centres, with people making quick purchases of items from street hawkers. This creates a vibrant environment, but also one with reduced security and increased stress, with a risk of pick-pocketing and passengers sometimes feeling 'forced' to board certain vehicles by a driver's assistants. 76 NODES Toolbox - The NODES project, co-funded by the European Commission, developed a Toolbox to help practitioners to assess and benchmark and design new and upgraded transport interchanges (multi-modal mobility hubs) to provide improved intermodality, safety and liveability: https://civitas.eu/tool-inventory/nodestoolbox Bus Priority Infrastructure Planning Toolbox – Transport for New South Wales, Australia, has published a Bus Priority Infrastructure Planning Toolbox that provides good illustrations of several forms of priority measures: https://www.transport.nsw.gov.au/system/files/media/documents/2021/Bus-PriorityInfrastructure-Planning-Guide.pdf Where such important and necessary investments in terminal infrastructure are planned, then proper consideration needs to be given to all forms of mobility and the needs of stakeholders and businesses that use these spaces (see recommended resources). IPT priority lanes and road conditions - Provision of priority lanes for IPT services arose in the passenger opinion survey in Cape Town, perhaps due to their existing experience of the existing priority measures on the N2 freeway (passengers in other cities may not have prior knowledge of these types of actions). One study undertaken in South Africa observed that IPT drivers already undertake illegal driving manoeuvres to create their own priority, and the research sought to understand what efficiency benefits might be gained through implementation of once-off infrastructure interventions, such as: pre-signal lanes, queuejumping lanes, as well as dedicated public transport lanes. The findings indicated that substantial savings could be realised in terms of travel time and operators' costs, ranging from 12% for smaller interventions to 30% in the case of dedicated lanes. In the case of Maputo, 'bad road conditions' was in second position, in terms of the number of respondents that identified this as an aspect of IPT services where improvements are most important. In this regard, many passengers differentiated between the poor condition of access roads, in comparison to main trunk routes. Further resources 5.2 Network management and Urban Vehicle Access Regulations 77 Access restrictions for informal public transport vehicles typically come in the form of: Specific informal transport route assignment - The issuing of route and/or operating licences can be used as a way to plan and control the informal public transport network. In practice, however, we see that route licensing is often not used as a network planning tool. Rather city authorities use them to control demand and supply on established routes. PT and informal transport integration (e.g. informal transport as 'feeder' service) - The route (or area) licensing can be extended to manage trunk-feeder arrangements in which informal transport services feed to, and distribute from, interchanges with formal trunk services. This requires some level of physical integration at a station or rank facility. This has been tried in several cities with various levels of success. IPT vehicle size restrictions (i.e. larger vehicles with more passengers) - Access restrictions that dictate vehicle sizes allowed in certain parts of the city may help to improve the efficiency of IPT operations and reduce bottle-necks in key locations. This has been tried in several cities, most specifically in Dar es Salaam, where only 25- to 34-seater daladala are permitted within parts of the city at the expense of the smaller 15 passenger daladala vehicles that used to dominate the roads of the city. City centre access bans - A very specific type of access restriction involves cordoning off a particular part of the city, such as the central business district, for certain types of vehicles. This may, for example, involve restricting access to the city centre for freights vehicles over a certain size, and/or preventing access for private cars, helping to reduce congestion and provide safer environments for walking and cycling. Corridors for public transport may nevertheless be retained within these areas, helping to ensure good accessibility to the city centre using collective transport. Overview of types of actions Route licensing has been introduced as a key form of network management in all of the TRANSITIONS cities to some extent or another, although the level of enforcement IPT has been a significant factor in the performance of this type or regulation. Ongoing application of route licensing is seen as a fundamental tool for working with IPT operators, ensuring that those that comply with this form of network management benefit from the intended improvements (i.e. reduced competition and congestion around terminals). In terms of additional forms transport network management, cities across the world are increasingly introducing different forms of Urban Vehicle Access Regulations (UVARs), which are enforced based on location, time of day, type of vehicle/service or size of vehicle wanting to enter a certain area. Also, in Sub-Saharan Africa we have seen introduction of restrictions that seek to create a shift to larger vehicles, or create exclusive areas or corridors of operation for formal Public Transport. 78 The EU CLARS Platform provides an overview of the different forms of Urban Access Regulations in place in Europe, including maps showing where these have been implemented. Such restrictions can be extended to include vehicle emission requirements, such as in many European cities, or time of day requirements, such as for freight vehicles at night. In contrast to the approach outlined above that prioritizes public transport, including IPT, there are instances of public authorities setting in place outright bans on IPT in central city areas. In Zimbabwe, for example, during 2020 the government issued a decree that made kombis and all other forms of public transportation illegal, except for the state-owned Zimbabwe United Passenger Company (ZUPCO) buses. IPT operators were invited to join ZUPCO, enabling them to continue their operations, but according to conditions specified by the public authority. As the TRANSITIONS Routemap seeks to promote and enhance the value of IPT services in providing collective transport, appropriate regulation of IPT services is recommended and IPT access bans are discouraged. Further resources 5.3 Fleet and fuel Improved maintenance of the existing fleet as a priority in the short-term Fleet renewal schemes in the medium-term Shifts to electrification and alternative fuels in the medium – long-term Newer vehicles, regular maintenance practices, and cleaner sources of energy can all contribute to limiting environmental emissions and related harmful health impacts from IPT operations. In addition, improved driving behaviour on the part of IPT drivers can have a positive impact not only on such emissions, but also on passenger safety. However, achieving safe and clean IPT services through fleet and fuel improvements may not always be affordable. Public sector transport budgets usually enjoy little leeway or political support for IPT financial assistance, while limited access to private sector capital reduces owners' appetite to invest in vehicle replacement and maintenance. Meanwhile drivers need to pay their crews, fuel bills, association fees and vehicle rental amounts before securing their own wages. Any new costs in the IPT system cannot be passed on to passengers, whose household budgets are already stretched thin. Proposed interventions in fleet and fuel improvements need to navigate this fragile financial situation, balancing the sometimes-competing aims of clean, affordable and safe IPT. Taking this into account, TRANSITIONS sets out a progression based on: Actions related to IPT fleets and fuel improvements can be divided into those that involve i) vehicles at the supply, acquisition and maintenance stages, ii) driver-led actions to reduce fuel consumption, iii) infrastructure provision interventions, and iv) fuel- and emissionsrelated actions. These actions are described in the table below, and, where possible, examples are given of where such actions have been implemented in the TRANSITIONS case cities as well as elsewhere in Sub-Saharan Africa. 79 Overview of types of actions Vehicle supply and acquisition – In all the TRANSITIONS countries except South Africa, IPT vehicles are imported, used vehicles. In effect, these countries and cities are being used by the origin countries to cast aside unwanted, outdated vehicles, that would not meet new emissions standards required to achieve local air quality and climate change targets. Unfortunately, since these vehicles tend to be available at a lower price point than the equivalent new vehicle in the local market, they are attractive to operators who have limited financial resources. This is a problematic trend that will require concerted action not only by the origin and destination country authorities, but also by intermediary countries through which these vehicles are distributed. In South Africa, its protected new vehicle market and local manufacturing industry have created conditions for one particular, locally produced model to become dominant in the market. As it is relatively expensive, a local financing industry has emerged. In particular, there is one finance house that focuses exclusively on IPT finance. 80 Experience and perspectives from the TRANSITIONS cities 81 It appears to be targeting the less financially literate – and perhaps desperate – IPT owners, charging what amounts to punitive interest rates to mitigate against the financial risks presented by its clientele. Addressing this situation will also require concerted public authority intervention. Across all of the TRANSITIONS countries, it is unlikely that the political will exists to intervene effectively in these vehicle supply and acquisition dynamics, which suggests that there is the scope (and likely need) for outside intervention, for example by development finance institutions, to bring some balance and positive change. Fuel and emissions – IPT vehicles in all of the TRANSITIONS cities, with the exception of Freetown, were found to spend many hours on the road every day, for much of the time carrying full loads of passengers. Judging by the relatively low commercial speed, including in Freetown, a lot of effort – and fuel – go into navigating congested, limited road space that is in most instances shared with general traffic. While IPT drivers spend a lot of money on a daily basis to purchase fuel, actual fuel consumption and the emissions that arise from burning this fuel were not prominent concerns. Ensuring that they carry sufficient passengers to meet the day's financial targets was a more pressing concern. From the owners' perspective, fuel and emissions were also not key considerations at the time of purchase. Rather than an environmental or health argument, it seems an economic argument aimed at changing drivers' practices would hold more sway in order to stimulate improvements in fuel consumption and emissions from IPT. Since there are existing engagement and representation platforms in the TRANSITIONS cities between government authorities and IPT owners or drivers, the pre-conditions exist for building momentum to share and implement the aforementioned economic argument. It is important to bear in mind, though, that operational decision-making is largely left to drivers, who typically see one another as competitors on the road. Change should be conceived and implemented at the system- or area-wide level, otherwise individual drivers will continue to be motivated by the first-to-the-passenger mentality. Passenger views – Passengers are the primary source of income for IPT operations. As such they have significant collective economic power to spur change. The TRANSITIONS city passenger opinion surveys repeatedly surfaced referenced problems with vehicles, drivers and crew and infrastructure, which can be used to motivate public authorities, operators and drivers to take action that can also serve to meet fuel and emissions imperatives if packages strategically with interventions that directly target the noted issues. The predominant issued highlighted by IPT passengers were as follows: fare level, vehicle and crew attitude dominated in the Accra survey; poor treatment by drivers and lack of service supply were foremost in Cape Town passengers' mind; in Freetown, it was overwhelmingly vehicle condition; vehicle condition, passenger space and driver attitude surfaced most in Kumasi; and in Maputo, the most noted passenger concerns were lack of supply, followed some way behind by poor road conditions. Each of these mentioned concerns could be addressed by a package of actions that not only attends to the root issue which passengers experienced - whether it relates to drivers and crew, owners, vehicle or infrastructure – but which also incorporates the actions listed in the table above to meet vehicle, fuel and emissions quality objectives. Kumalo K, 2019. Electric vehicles: market intelligence report, commissioned by GreenCape Montmasson-Clair, G., Dane, A., and Moshikaro, L., 2020: Harnessing electric vehicles for industrial development in South Africa, TIPS (Trade & Industrial Policy Strategies) report for South Africa Department of Trade, Industry & Competition and NAAMSA (National Association of Automobile Manufactures of SA), June 2020 Further resources SSATP (2010) 'Bus Renewal Scheme in Dakar: Before and after' - https://www.ssatp.org/sites/ssatp/files/publications/SSATP-DiscussionPapers/DP11-BusRenewal-Scheme-Dakar-with-cover.pdf Furthermore, IPT operators in TRANSITIONS cities pointed out that they wished to be responsive to passengers needs, and in practice they indeed needed to be so as a financial imperative. If they could be motivated to implement fleet and behavioural changes based on what their paying customers desired, then it would likely be a more palatble message than if it delivered by a government agency or be based on global arguments about climate change. 82 5.4 Business development Understanding informal transport as a commercial business, as well as how different business and operational models influence driver behaviour, provides insights on how supporting actions for IPT may bring about positive change. These may take the form of promoting certain organisational structures, provision of financing schemes and direct incentives for drivers. TRANSITIONS Route Marker 4 highlights the importance of capacity building within IPT organisations, relating primarily to the unions and associations. A key point raised was that the unions and associations were founded to represent and help organise and manage IPT operations, but not to function as standalone business themselves. The unions and associations are, however, in a position to help coordinate provision of training to the principal business partners, typically the vehicle owner and the driver. The table below identifies the main types of actions that could be undertaken. 83 Overview of types of actions 84 BLUE DOT Taxi Service This pilot scheme, initiated by the Western Cape Government, involved partnering with the provincial minibus-taxi industry to achieve the following aims: - improve the quality and safety of the service provided to the passenger; - achieve empowerment in, and transformation of the industry; and - address two of the industry's most challenging issues, namely illegal operations and violent conflict. Eight new companies were established by the Western Cape's regional taxi councils to participate in the pilot along with Umanyo Travel Services (UTS), the company established by the South Africa National Taxi Council's (SANTACO) provincial branch. 800+ minibus-taxis that participated in the scheme were easily identified by their large Blue Dot sticker and drivers were required to undertake training. Customer feedback was a central element of the scheme, with passengers encouraged to rate the service anonymously. When customers submit their ratings, they were asked whether the taxi is: - Speeding - Driving safely and following the rules of the road - Too full Experience and perspectives from the TRANSITIONS cities Perspectives have been gained in all 5 cities through a combination of the local knowledge of the City Research Leaders and feedback received in the stakeholder interviews and passenger opinions surveys. There are is also a very interesting pilot scheme that took place in Cape Town, the Blue Dot taxi service, which packages several of the business development actions referred to with advanced digital tools (see Section 5.5). Complementing the passenger feedback approach, participating minibus-taxis were installed with vehicle trackers. This monitoring allowed the Blue Dot operators to offer a monthly financial reward based on driver behaviour and performance. Positive impacts achieved by the scheme have included a significant increase in tax compliance by operators and a 50% reduction in speeding events. [37] Subsidisation – In Cape Town, it was commented that "the minibus-taxi industry is keeping the South Africa economy moving and was recognised by government for doing so in two ways: transporting people to work, and in itself providing substantial employment. However, aside from capital contribution provided to replace old vehicles as part of the fleet renewal scheme, there was no contribution universally available to the Minibus-taxi sector that could be called a subsidy. From CODETA's point of view (an umbrella organization gathering 48 individual route associations), it was raised that an operating subsidy would allow drivers not to have to wait for a full complement of passenger nor to only operate in peak passenger demand periods. The provincial government recognised these calls for a subsidy, but countered that the bus contracts that the Western Cape Department for Transport and Public Works (DTPW) issued were not an operator, but a passenger subsidy, as it was paid per ticket sold rather than being a direct contribution to the operator's finances. Pursuing this approach to subsidisation would require greater transparency in relation to Minibus-taxi operator finances for a case to be made for subsidisation, but there remains a wider problem. It was raised during stakeholder interviews that the state of the economy and government finances meant that "we [the provincial government] don't have money for anything at the moment; how are we going to fund this bigger vision around [equitably funded] public transport?" Financing schemes - The dominant union in Ghana (GPRTU), which owns and operates the majority of the trotro fleet, conducts regular renewal programs on hire purchase, in partnership with banks or financial institutions. MASLOC has been a key partner in that process and is supported by the government who wishes to boost transportation business in Ghana. Other banks also specialize in fleet renewal programs and offer affordable and flexible monthly repayments with minimal documentation required. Hence, there is a high upscaling potential if such programs are led at the Metropolitan or National level. However, apart from GPRTU and PROTOA, there is very little scope for operators to renew their vehicles or fleet of vehicles. Recapitalization requires discipline and significant margins, which operators fail to achieve. The lack of an affordable financial mechanism also acts as a disincentive for operators to renew their vehicles and invest in the business. MASLOC seems to be the only institution to provide loans at reasonable rates. Remuneration – Interviews in Cape Town highlighted the undesirable incentives created by the "target" driver remuneration system. For owners, they viewed the business primarily as a revenue stream, with little benefit to them to invest in vehicle upkeep. 85 CODETA has introduced measures to counter both these outcomes: drivers were paid a commission – an agreed portion of total revenue – and thus were not solely reliant on the target system, while owners were reprimanded if their vehicles were old or in poor condition. In Accra and Kumasi, both at Co-op and GPRTU, the Union imposes the payment of basic salaries to drivers, which corresponds to double the amount of their daily sales. Any surplus on daily sales is an additional source of revenue for the drivers and mates, but they are struggling to receive these surplus payments. Safe driver training – Interviews conducted in Accra and Kumasi seem to indicate that drivers or riders do not receive any kind of formal training and learn to drive 'on the job', which contributes to poor driving standards and higher numbers of accidents. It also suggests that licences are granted to public transport operators without testing driving skills. Driver tracking to improve productivity and road safety – case studies: In addition to the Blue Dot scheme introduced above, two further case studies that provide further inspiration are as follows. One research project in Nairobi involved cooperation with fleet owners and the introduction of monitoring devices to 255 minibuses. The devices provide real time information to the owner of the minibus about the productivity and safety of the driver. It was found that the monitoring technology eases labour contracting frictions by improving the contract that owners offer their drivers. The drivers were found to respond by driving in ways that are less damaging to the vehicle, reducing their under-reporting of revenue and meeting their targets more often, resulting in higher profits for the firm. A second study reports on the Safe Travel To School (STTS) programme that aims to provide safer travel for child passengers in Cape Town by monitoring driver performance through a tracking device installed in each vehicle and rewarding good driver performance. The programme started with 78 drivers recruited in 2015 and expanded to 800 drivers from 16 districts of Cape Town. Financial incentives are paid out across four quarters each year, rewarding drivers with the best performances and those who have improved their driving during the 3-month period. [39] 86 This category of actions encompasses aspects related to driver ranking and reviews, provision of passenger information (through network mapping and journey planning), payment systems, and ride hailing solutions. The table below identifies main types of actions that could be undertaken. While many of the improvements called for by informal transport users require hard investments in vehicles or infrastructure (and business model overhauls), the use of digital technologies could open new avenues to transform services and improve passengers' experience, without requiring very high capital expenditure. This section presents some of the options that could be considered, based on the needs and opportunities identified in our five case cities, as well as documented experience in other countries on the continent. 87 5.5 Digital passenger services Overview of types of actions 88 Reliance on private sector initiative: most of the digital passenger services presented above are dependent on the private sector's appetite to invest in the development of these solutions. This means that there must be a viable business case associated with the development of these services. As they are likely to generate new costs, these must be compensated by an equivalent increase in revenue (either through increased demand and fare revenue, or through new revenue streams such as advertisement for instance). The implementation of cashless payment systems, for instance, could be difficult if transaction costs deteriorate an already fragile equilibrium. Data collection and mapping efforts could be financed directly by the public sector, but this might not be sustainable in cities with more limited budgetary capacities. Address users' needs: it is unclear whether actions aimed at improving passenger information are a priority for users in the cities that we surveyed. Most respondents appear to be regular users of their informal transport route and may not require maps or journey planners for their usual trips. However, there is a possibility that latent demand exists, and that some prospective travellers are not taking public trips because they are not aware of the existence of route to their destination. Resistance from the industry: leapfrogging from an artisanal mode of operation to a digital business could be difficult to accept for the informal transport industry as jobs could be threatened as a result of this transition. The development of cashless payment systems, for instance, could mean that conductors are no longer needed onboard vehicles. This would therefore require a retraining plan to guarantee that conductors do not become unemployed. Since the informal transport industry is a large source of employment for workers without formal qualifications, the social implications of a digital transition should not be underestimated. The main constraints and opportunities associated with these interventions are as follows Feedback mechanism for passengers: passenger satisfaction varies importantly across cities (low overall in Freetown, while relatively high in Cape Town), but complaints about interactions with vehicle crews – and conductors in particular – have been recorded in all five cities. Passengers feel that they are taken hostage by crews because they are dependent on their service but have no redress mechanism in case of a problem. Using digital technology to allow passengers to share some feedback directly with the operator group executives or the owner of the vehicle could therefore contribute to addressing this frustration. To be accepted by crews, such a review mechanism should however not be perceived as a punitive measure but associated with internal capacity building efforts. Prevention of harassment: in Freetown, 20% of IPT users reported having been victims of some form harassment (see Section 3.5 for further information). Unsurprisingly, female travellers are overrepresented amongst victims. Digital technologies could play a role in reporting and publicizing this phenomenon. First, incidents could be reported electronically to the authorities and the operator group responsible for the service or terminal where they happen. Second, a dedicated platform or account on social media could be set up to publicize the nature and scale of this problem, and raise awareness amongst the travelling public in order for inappropriate behaviours to no longer be tolerated. Some operational improvement (or at least information). Depending on specific city and route circumstances, waiting times and pick up and drop off points can be sources of dissatisfaction for passengers. In Cape Town and Maputo, for instance, passengers reported under-supply of vehicles and waiting times at terminals as an important source of concern. Although it might be difficult to decrease headway due to operational and economic constraints, there could be an opportunity to introduce real-time information systems about waiting time at terminals to allow users to plan their trip more efficiently and avoid wasting time. 89 Opportunity to create a new market space. Because of the queueing system in place at terminals, whereby passengers are forced to board the first vehicle in line for their destination, individual operators cannot use the quality/comfort of their vehicle as a differentiating factor to capture higher market shares. As a result, there is potentially a segment of users that would be willing to pay higher fares to travel in a more comfortable/safer vehicle that remains unserved. This constitutes and area of improvement that should be explored. Experience and perspectives from the TRANSITIONS cities Based on the results of the passenger survey, the following observations can be made regarding the opportunity to encourage digital passenger services in our five cities: 06 Conclusions 91 an emphasis on getting the basics right; and related to this, the enormous potential of relatively low cost measures working with existing operators and fleets. Reviewing the organisational role and structure of unions, associations and cooperatives, taking into account their current competencies and potential to deliver training and support business development. During the course of the TRANSITIONS project it has become apparent that there this is increasing recognition of the vital role that IPT plays in metropolitan areas across SubSaharan Africa, and a growth in momentum amongst the international community to find ways to work with the sector to provide low carbon, affordable and safe mobility. The research team has sought to contribute to this agenda, bringing together multiple sources of information, through literature reviews, as well as the stakeholder interviews, passenger opinion surveys and fuel consumption surveys undertaken in the cities of Accra, Kumasi, Freetown, Cape Town and Maputo. Review of this information, together with discussions with stakeholders at the project's Western Africa and Southern Africa workshops, have led to the Routemap proposition for pilot IPT projects, presented at Section 2 of this report. While projects that involved working proactively with the IPT sector are limited, there are neverthless valuable examples to learn from. These include measures such as: the digital mapping of networks in Accra and Nairobi, Minibus-taxi lanes and trials of hybridity regulation in Cape Town; the fleet renewal schemes undertaken in Dakar and Cape Town; as well as reorganisation and professionalisation of IPT associations as SACCOs in Kenya. These case studies highlight that the desire to work proactively with the sector is far from new, and further long-term studies of the evolution and results of these initiatives would be beneficial. Drawing on the research undertaken by the project and these existing case studies, the TRANSITIONS Routemap seeks to support joint working by the public authorities and the IPT sector, presenting: In this respect, the TRANSITIONS Routemap differs from some of the major schemes (such as Bus Rapid Transit projects that involve reform and assimilation of the IPT sector; and fleet renewal schemes), by proposing a more gradual and bottom-up approach for supporting professionalisation of the existing IPT sector. This involves good and fair enforcement of (often) existing route licensing; upgrading and maintenance of existing road, bus stop and terminal infrastructure, and creating space for terminals where these are currently located on road margins; as well as working with the industry to improve the efficiency of its existing vehicles, through maintenance and driver training. Improving these aspects would increase readiness of IPT unions and associations to become involved in major transport schemes where these are brought forward. First and foremost, the TRANSITIONS Routemap requires public authorities and the IPT industry to agree on what they wish to achieve working together (Route Marker 1). Taking into account the rapid growth of metropolitan areas in Africa, there is an overwhelming case for engagement. Projects to introduce formal PT have often faced long delays, and where they are implemented, only serve a fraction of the population. This is not to say that the Routemap presented here does not also face challenges and areas of uncertainty that will need to be addressed. Matters that will require further research and development of solutions include: Professionalisation of the IPT sector will involve looking again at business cases with stakeholders, and examining to what extent fuel efficiency and operational efficiency can increase profitability. Basic information such as the sheer number of vehicles involved in IPT operations are currently lacking, and this would help strengthen the overall case for investment to achieve reductions in GHG emissions and local pollution. A further challenge arising relates to how supply and demand on IPT routes can be better managed, while also seeking to ensure that appropriate service levels can be provided in less profitable off-peak periods. This will depend on the design of route licensing, data gathering and enforcement processes that are realistic taking into account the capacities of public authorities. This matter also calls into question whether financial support (subsidies) for the IPT sector could be possible, as well as the role that mobile technology could play in the future, facilitating efficient delivery of ride-pooling services in areas away from the main IPT corridors and during periods of less demand. The TRANSITIONS workshops revealed a strong appetite amongst public authority and IPT representatives for international exchange and further learning, in order that these and other outstanding questions can be answered, and so that the opportunities presented by improvements to existing mobility service providers can be realised. 92 Endnotes [1] Fortune, G., 2021 (Draft – forthcoming) Informal Transportation & Decarbonization V1.4 – paper refers to an ambitious and crude attempt to size the Informal Transport sector in SSA, based on available information from 25 locations (cities and countries). The information is not consistent in terms of the forms of 'informal transport' included in the total figure. For example, in some cases motorcycles or taxis were excluded. [2] Categories of policy positions based on Cervero, 2000. Informal transport in the developing world. UNHabitat. [3] A summary of the 'regulatory cycle', as conceptualised and described by Gwilliam, 2008. Bus transport: Is there a regulatory cycle? Transportation Research Part A: Policy and Practice 42, 1183–1194. Available at: https://doi.org/10.1016/j.tra.2008.05.001. [4] See for example: Wilkinson, P., 2010. The regulatory cycle stalled? An assessment of current institutional obstacles to regulatory reform in the provision of road-based public transport in Cape Town, South Africa. Research in Transportation Economics 29, 387–394. Available at: https://doi.org/10.1016/j.retrec.2010.07.049; and Finn, B., Mulley, C., 2011. Urban bus services in developing countries and countries in transition: A framework for regulatory and institutional developments. JPT 14, 89–107. Available at: https://doi.org/10.5038/2375-0901.14.4.5. [5] Durant et al., 2022 (forthcoming), Re-evaluating roles and relationships between city authorities and informal public transport operators in Sub-Saharan Africa: a comparative analysis of five cities. Undergoing peer review. [6] Klopp, J.M., Cavoli, C., 2019. Mapping minibuses in Maputo and Nairobi: engaging paratransit in transportation planning in African cities. Transport Reviews 39, 657–676; AND Williams, S., White, A., Waiganjo, P., Orwa, D., Klopp, J., 2015. The digital matatu project: Using cell phones to create an open source data for Nairobi's semi-formal bus system. Journal of Transport Geography 49, 39–51. [7] Behrens, R., Hawver, H., Birungi, C., Zuidgeest, M., 2017a. Case study investigation of unscheduled feeder and scheduled trunk service relationships in Cape Town. Presented at the 36th Annual Southern African, Transport Conference, 2017, Pretoria, South Africa; AND du Preez, D., Zuidgeest, M., Behrens, R., 2019. A quantitative clustering analysis of paratransit route typology and operating attributes in Cape Town. Journal of Transport Geography 80, 102493. [8] Saddier, S., Patterson, Z., Johnson, A., Chan, M., 2016. Mapping the jitney network with smartphones in Accra, Ghana: The AccraMobile experiment. Transportation Research Record 2581, 113–122. [9] Andreason and Moller-Jensen, 2017. Access to the city: Mobility patterns, transport and accessibility in peripheral settlements of Dar es Salaam. Journal of Transport Geography 62, 20-29 [10] Joseph et al., 2020. Activity participation and perceptions on informal public transport and bus rapid transit in Dar es Salaam. Transportation Research Record 2674(11), pp. 573-583 [11] Turner & Kwakye, 1998. Transport and survival strategies in a developing economy: case evidence from Accra, Ghana. Journal of Transport Geography 4(3), pp. 161-168 [12] Chancel, L., Cogneau, D., Gethin, A., and Myczkowski, A. 2019. How Large Are African Inequalities? Towards Distributional National Accounts in Africa, 1990-2017, World Inequality Database Working Paper no. 2019/13. [13] World Bank. 2021. Connectivity for Human Capital : Realizing the Right to Education and Healthcare through Improved Public Transport in African Cities. Mobility and Transport Connectivity;. World Bank, Washington, DC.. https://openknowledge.worldbank.org/handle/10986/35185 [14] FIA Foundation, 2016. Safe and sound: International research on women's personal safety on public transport. [15] EBRD, 2016. Safe transport for all: Issues and operational lessons from the Egyption National Railways. [16] FLONE, 2018. Report on gender equity assessment of Nairobi's public minibus transport services. FLONE Initiative [17] HVT 2019. Disability Inclusive Policy Brief http://transport-links.com.w01c1b50.kasserver.com.w01c1b50.kasserver.com/download/disability-inclusive-policybrief-accessible-version/ [18] Kett, M., Cole, E. & Turner, J., 2020. Disability, Mobility and Transport in Low- and Middle-Income Countries: A Thematic Review. Sustainability, 12 (2), p.589. Available from: https://www.mdpi.com/2071-1050/12/2/589 . [19] National Department of Transport, 2018. Green Transport Strategy for South Africa (2018-2050) [20] Ecoscore Tool, 2022. How to calculate the CO2 emissions from fuel consumption - https://bit.ly/3wIjvU3 [21] See Finn et al. 2011 and Gwilliam 2011 for further background information. [22] Rivasplata, C., 2006. An Analysis of the Impacts of British Reforms on Transit Integration in the Metropolitan Areas. Ph.D. Dissertation, University of California, Davis; AND Rivasplata, C. (2008). Public transport integration in a privatized market–Recent policy lessons from abroad. CODATU XIII Conference, November 12–14. Ho Chi Minh, Vietnam. [23] Venter, C., Barrett, I., Zuidgeest, M., Cheure, N., 2020. Public transport system design and modal integration in Sub-Saharan African Cities. Position paper: The state of knowledge and research. Volvo Research and Educational Foundations (VREF) [24] Adewumi, E., Allopi, D., 2014. An appropriate Bus Rapid Transit System. The International Journal of Science & Technology. 3(4): 248-254 [25] Chengula, D. H., Kombe, K. 2017. Assessment of the Effectiveness of Dar es Salaam Bus Rapid Transit (DBRT). International Journal of Sciences, 36, 10-30: AND Venter et al. 2020 (see Endnote 18) [26] Rizzo (2002) Being taken for a ride: privatisation of the Dar es Salaam transport system 1983–1998. J. Mod. Afr. Stud. 40, 133–157. Available at: https://doi.org/10.1017/S0022278X01003846. [27] Agbiboa, D.E., 2016. 'No condition is permanent': Informal transport workers and labour precarity in Africa's largest city. International Journal Urban Regional 40, 936–957. Available at: https://doi.org/10.1111/1468-2427.12440. AND Agbiboa, D.E., 2020. Between cooperation and conflict: the national union of road transport workers in Lagos, Nigeria. Crime Law Social Change 73, 605–622. Available at: https://doi.org/10.1007/s10611-019-09878-x. [28] Ommeh, M., McCormick, D., Mitullah, W., Orero, R., Chitere, P., 2013. Paratransit labour and regulatory compliance. [29] Abekah-Nkrumanh, G., Opoku Asuming, P. & Telli, H. 2019. The effects of the introduction of a bud rapid transit system on commuter choices in Ghana - https://www.theigc.org/wpcontent/uploads/2019/10/Abekah-Nkrumah-et-al-2019-Policy-Brief.pdf [30] Tichaeur, C. and Watters, M. 2008 'N2 BMT lane – a first for South Africa' - https://www.semanticscholar.org/paper/N2-BMT-lane-a-first-for-South-Africa-TichauerWatters/f2a4be0dbe772447467ab359504c7573c6402273 [31] Western Cape Government, 2009. Bus and Minibus Taxi Lane Operation Nets 122 Offenders - https://www.westerncape.gov.za/news/bus-and-minibus-tax-lane-operation-nets-122-offenders [32] Study by De Beer and Venter, 2019. Priority infrastructure for minibus-taxis: an analytical model of potential benefits and impacts. [33] See for example Cisse, 2020. Adapting first world systems to improve African mobility - https://www.intelligenttransport.com/transport-articles/95942/adapting-first-world-systems-to-improveafrican-mobility/ [34] Case studies of terminal conditions in the TRANSITIONS cities were presented and discussed during a 'Walk-Ride-Walk' session at the Africa Regional Forum for Action – Inclusive & Active Mobility in a Changing Climate (June, Kigali) [35] Pearce, J. and Hanlon, J.T. 'Energy conservation from systematic tire pressure regulation', HAL open science - https://hal.archives-ouvertes.fr/hal-02120515/file/Energy_conservation_from_systematic_tire.pdf [36] US Department of Energy Alternative Fuels Data Center - https://afdc.energy.gov/conserve/vehicle_maintenance.html#:~:text=Properly%20inflated%20tires%20last%2 0longer,%2C%20and%20up%20to%203%25. [37] Further information on the Blue Dot taxi service pilot scheme can be found at: https://www.westerncape.gov.za/tpw/blue-dot-taxi-service [38] Kelly, E., Lane, G., and Schoenholzer, D. 2018. The impact of monitoring technologies on contracts and employee behaviour: Experimental evidence from Kenya's transit industry. [39] Janmohammed, A., Niekerk, A.V., Samuels, R., Naidoo, M., As, S.V., 2019. Engaging minibus taxi drivers in the quest for child safer roads. Global Health Innovation 2. Available at: https://doi.org/10.15641/ghi.v2i1.72 www.hvt-transitions.info Project Partners TRANSITIONS This research was funded by UKAID through the UK Foreign, Commonwealth & Development Office under the High Volume Transport Applied Research Programme, managed by DT Global. The views expressed in this report do not necessarily reflect the UK government's official policies. This document has been designed by: TRANSITIONS Project February 2023