Overview
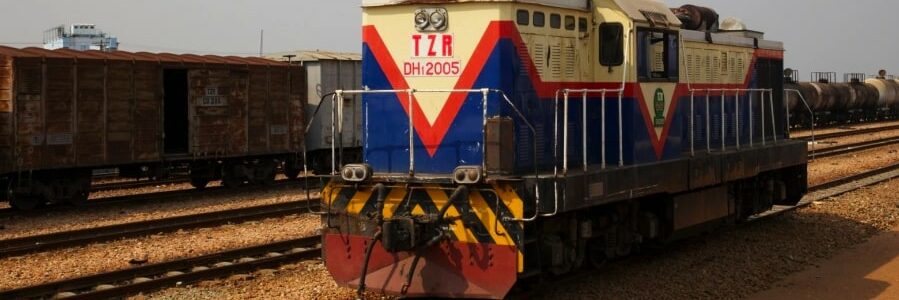
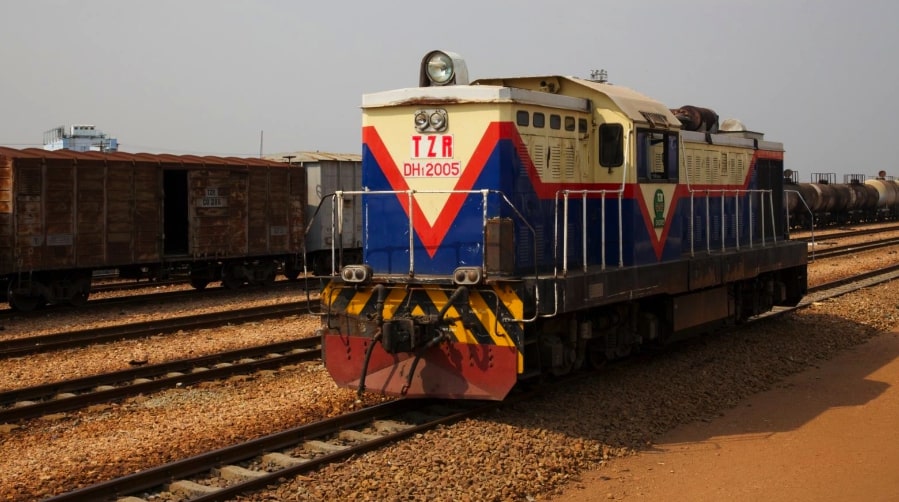
This report analyses overall railway traffic volumes in low-income countries in Sub-Saharan Africa. It builds on desktop data collection from international sources, as well as inputs from key stakeholder engagement. The main aim of the report is to give an overview of the current state of the railway sector in the region, from which more specific case studies can be derived for more detailed feasibility studies of low-carbon traction solutions.
Publications with the same themes


Publications with the same study countries
Related news & events
News
PDF content (text-only)
Deliverable 1.2 TRAFFIC VOLUME REPORT - Novel traction systems for sustainable railway futures in LICs September 2021 HVT038 – University of Birmingham This research was funded by UKAID through the UK Foreign, Commonwealth & Development Office under the High Volume Transport Applied Research Programme, managed by IMC Worldwide. The views expressed in this report do not necessarily reflect the UK government’s official policies. Reference No. HVT038 Lead Organisation/ Consultant University of Birmingham Partner Organisation(s)/ Consultant(s) Title Novel traction systems for sustainable railway futures in LICs Type of document Project Report Theme Low carbon transport Sub-theme Long distance road and rail transport Author(s) Clive Roberts, Stuart Hillmansen, Marcelo Blumenfeld Lead contact Clive Roberts Geographical Location(s) Sub-Saharan Africa Abstract This report analyses overall railway traffic volumes in low-income countries in Sub-Saharan Africa. It builds on desktop data collection from international sources, as well as inputs from key stakeholder engagement. The main aim of the report is to give an overview of the current state of the railway sector in the region, from which more specific case studies can be derived for more detailed feasibility studies of low-carbon traction solutions. Keywords Rail transport, traffic volumes, low carbon, hydrogen, Africa, low-income countries, rail traction solutions, Benin, Democratic Republic of Congo, Ethiopia, Djibouti, Guinea, Liberia, Madagascar, Malawi, Mozambique, Nigeria, Sudan, Tanzania, Togo, Uganda Funding UKAid/ FCDO Acknowledgements i TRAFFIC VOLUME REPORT - Novel traction systems for sustainable railway futures in LICs CONTENTS 1. Introduction 1 1.1 Background 1 1.2 Aims and objectives 1 1.3 Scope 1 1.4 Methodology 3 2. Update on the State of Knowledge (SOK) 6 2.1 Main findings 6 2.2 Recent updates and future plans 11 2.3 Commentary on data availability 13 2.4 Commentary on trends and forecasts 14 2.5 Commentary on the selection of case studies 16 3. Scenario analysis 18 3.1 Introduction 18 3.2 African vision 20 3.3 Renewed links 21 3.4 Private railways 22 3.5 Forgotten tracks 22 4. Rail infrastructure and performance indicators 24 4.1 Benin 24 4.2 SITARAIL 25 4.3 Democratic Republic of Congo 26 4.4 Ethio-Djibouti Railway 27 4.5 Guinea 28 4.6 Liberia 29 4.7 Madagascar 30 4.8 Malawi 31 4.9 Mozambique 32 4.10 Nigeria 33 4.11 Sudan 34 4.12 Tanzania 35 4.13 Togo 36 4.14 Uganda 37 5. Concluding remarks 38 6. References 40 ii TRAFFIC VOLUME REPORT - Novel traction systems for sustainable railway futures in LICs TABLES Table 1: List of countries within the scope of the project 2 Table 2: Countries currently not operating railway services 3 Table 3: Countries that exceed income and development thresholds 3 Table 4: Validation of CIA Factbook data using network size (route-km) 4 Table 5: Network size and network density comparison with countries 8 Table 6: Data currency for all countries (and international routes) within the study scope 14 Table 7: List of selected case studies 16 Table 8: Annual traffic volumes in the LICs contemplated by the project 18 FIGURES Figure 1: Traffic volume analysis methodology 5 Figure 2: Different track gauges used in Sub-Saharan Africa (8) 6 Figure 3: Railway lines, cities, and economic hubs in Sub-Saharan Africa 7 Figure 4: Network density per area and population of Sub-Saharan LICs 9 Figure 5: Traffic volumes observed in Sub-Saharan LICs 10 Figure 6: Traffic densities in Sub-Saharan LICs 11 Figure 7: GDP growth in Sub-Saharan Africa (excluding high income) 15 Figure 8: Time series of SNCC's traffic volumes and GNI per capita in the DRC 15 Figure 9: Future scenarios and their trajectories in selected themes 19 Figure 10: Proposed High Speed Rail Network of the AU Agenda 2063 20 iii TRAFFIC VOLUME REPORT - Novel traction systems for sustainable railway futures in LICs ACRONYMS BCRRE Birmingham Centre for Railway Research and Education CEAR Central East African Railways CFM Ports and Railways Company of Mozambique ERC Ethiopia Railways Corporation FCDO Foreign, Commonwealth & Development Office GNI Gross National Income HDI Human Development Index HVT High Volume Transport IMC IMC Worldwide Ltd SDG Sustainable Development Goals SGR Standard Gauge Railway SNCC Societe Nationale de Chemin du Fer (DRC) SRC Sudan Railways Corporation SSA Sub-Saharan Africa TAZARA Tanzania Zambia Railway Authority UN United Nations URC Uganda Railway Corporation 1 TRAFFIC VOLUME REPORT - Novel traction systems for sustainable railway futures in LICs 1. Introduction 1.1 Background Building on the UN Sustainable Development Goals (SDGs) and the Paris Agreement, decarbonising the transport sector has become a priority to many countries. These initiatives act to (a) promote modal shift from carbon intensive to more energy efficient modes (such as road and air to rail), and (b) remove fossil fuels from the sector with zero-emission traction systems. Such efforts are more easily said than done, especially for financially constrained low-income countries that cannot afford the traditional route of railway electrification. Railway electrification is a resource intensive endeavour that requires considerable efforts in the construction and maintenance of complicated infrastructure. Adding these amounts to the ongoing costs of building new lines and renewing existing routes can prove an unfeasible reality to most LICs. Given the emergency for action to reduce the environmental impacts of transport activities, as well as the Social Costs of Carbon associated with them, there is a critical need to rethink traction systems that are affordable and do not require large infrastructure to operate. However, it is also important to understand the particularities and the differences between countries within the Sub-Saharan African, in the various aspects of infrastructure ownership, infrastructure availability, operational performance, and network maturity. The reality found in several Sub-Saharan African LICs consists of legacy lines that date back to the times of the European presence in the continent that are too disconnected to be understood as a network. In most cases, countries house extracting lines connecting ports to mines or other commodity hubs. 1.2 Aims and objectives This project therefore builds on these paradigms with a main aim of exploring and developing novel solutions for traction systems that are not only zero-emission, but also relevant to the context of Sub-Saharan African low-income countries (LICs). To do so, the project operates in three phases, which can be descried in a simplified manner as (1) information gathering and review of the state-of-knowledge; (2) analysis of traction requirements for novel traction systems using selected case studies; and (3) development of novel traction solutions as well as retrofitting plans for existing fleet. This report finalises the first phase of information gathering, and focuses on updating the state of knowledge and analysing traffic volumes encountered in Sub-Saharan LICs. The main objectives of this report are to: • Update the database compiled during Phase 1 of the High Volume Transport (HVT) project; • Provide an overview of general traffic volumes which will be useful in the selection of potential case studies for the subsequent work packages; and • Forecast of traffic volumes and demands based on current developments and strategic plans. 1.3 Scope As defined by the HVT programme, this project focuses on low-income countries (LICs) situated in SubSaharan Africa. The general definition of Sub-Saharan Africa is drawn from the United Nations Statistical Division (1). However, the project team decided to include Sudan in the research because of the similarities between the country’s railway infrastructure and the other Sub-Saharan African nations. To start with, small island nations were not considered for their scale. Subsequently, the main criteria for the project scope derives from the definition of low-income countries. The term is used widely to cluster countries according to the economic maturity. The definition of low-income countries in this project follows that of the World Bank, of having a Gross National Income (GNI) of US$1,035 per capita or less (2). Nonetheless, it was found that the economic criterion alone would exclude countries that share similar issues with railway infrastructure and also qualify for international lending. The project team decided to add a 2 TRAFFIC VOLUME REPORT - Novel traction systems for sustainable railway futures in LICs second layer based on Human Development Indices (HDI) as defined by the United Nations Development Programme (3). In this evaluation, countries scoring 0.55 or less are classed as low-development nations. It was found that some countries in Sub-Saharan Africa are classed as low-income but not as lowdevelopment, and some countries are classed as low-development but not as low-income. Some nations are found to be both in the low-income and low-development groups. These countries share some similarities in their state of infrastructure and operational performance. Therefore, to be included in this project, countries needed to be classed in the lower tier of at least one of the indicators (GNI per capita or HDI). Some excluded countries were added to commentary and analysis as they may have similar context or share railway lines with the countries within the scope of the project. Table 1 lists the countries within the scope of the project, as well as their GNI per capita and latest Human Development Index. Different colours have been used as identifiers: (a) Green background indicates GNI per capita higher than US$1,035; (b) Yellow background indicates GNI per capita of US$1,035 or less; (c) Orange background indicates low HDI (0.55 or less); and (d) Blue background indicates HDI higher than 0.55. Table 1: List of countries within the scope of the project Country GNI per capita Human Development Index Benin 1250 0.545 Burkina Faso 780 0.452 Cote d'Ivoire 2290 0.538 Djibouti 3310 0.524 DR Congo 530 0.480 Eritrea 600 0.459 Ethiopia 850 0.485 Guinea 930 0.477 Liberia 580 0.480 Madagascar 520 0.528 Malawi 380 0.483 Mozambique 490 0.456 Nigeria 2030 0.539 Sierra Leone 540 0.452 South Sudan 1090 0.433 Sudan 590 0.510 Tanzania 1080 0.529 Togo 690 0.515 Uganda 780 0.544 It is important to emphasise that the combined criteria may leave out countries that are also relevant to the study. Firstly, because they may not currently operate railway services, but may or may not count with infrastructure to do so (Table 2). Secondly, because they may have indicators which are closer to the scope of this project than the countries in the middle-income tier ( Table 3). Finally, because some countries may share border-crossing lines with countries that are within the scope of the project (both tables). 3 TRAFFIC VOLUME REPORT - Novel traction systems for sustainable railway futures in LICs Table 2: Countries currently not operating railway services Country GNI per capita Human Development Index Burundi 280 0.433 Central African Republic 520 0.397 Chad 700 0.398 Eritrea 600 0.459 Guinea-Bissau 820 0.480 Mali 870 0.434 Niger 600 0.394 Rwanda 830 0.543 Senegal 1460 0.512 Somalia1 312 0.351 The Gambia 750 0.496 Table 3: Countries that exceed income and development thresholds Country GNI per capita Human Development Index Cameroon 1500 0.563 Ghana 2220 0.611 Kenya 1750 0.601 Republic of the Congo 1720 0.574 Zambia 1430 0.584 Zimbabwe 1390 0.571 As observed, it is difficult to set hard boundaries in scope because economic and/or development indicators do not necessarily correlate with the maturity of railway infrastructure or levels of operational performance. In addition, countries that do not currently operate railways may count with infrastructure that is ready to be operated (such as the case of Senegal and Mali). In face of the impossibility to cluster groups, this document provides further information of railway operations in each country where services are currently available. It must be noted that, this report provides the general country overviews and data availability to help narrow down and focus on specific countries before selecting the routes for the case study in workpackage 2. 1.4 Methodology This report observes the overall railway performance of low-income countries in Sub-Saharan Africa, using a combination of international databases, national reports, and direct inputs from key stakeholders. As discussed in the next section, the poor availability, quality, and currency of data in LICs in Sub-Saharan Africa remains a challenge to research activities. In order to maintain consistency between countries, this report builds on a systematic search for the latest data available that matches the indicators sought. The search looked for the latest and most accurate information publicly available for each country. Within the project database, the traffic volume analysis looked for a range of economic, social, and infrastructure statistics to derive main indicators for each country or international line. These indicators are referred to as the ‘Rail Infrastructure and Performance Indicators’ (RIPI). RIPIs have been produced for the countries that strictly fit within the scope of the project. Relevant cases from adjacent countries are discussed in other sections. Cross-border lines such as SITARAIL (linking Burkina Faso and Cote d’Ivoire), TAZARA (connecting Zambia and Tanzania), the Nacala corridor (crossing Mozambique and Malawi), and the Ethio-Djibouti Railway (passing through Ethiopia and Djbouti) were equally considered in the study. 1 Information for Somalia dates back to 2018 for GNI per capita and 2017 for HDI. 4 TRAFFIC VOLUME REPORT - Novel traction systems for sustainable railway futures in LICs The decision to treat these as part of the national network or as single entities was made according to two factors: (1) the level of data reporting available, and (2) whether there are other lines in the national network besides the international link. With that, SITARAIL and Ethio-Djibouti Railway are considered as a single entity, and the statistics take both countries into question. GNI and HDI are presented separately whereas land area and population combine those of both countries. Conversely, TAZARA and the Nacala corridor are part of the wider network of their respective countries, with the common fact that the majority of both lines are situated in only one country. Firstly, annual reports of the Tanzania Railways Corporation (TRC) report on TAZARA activities alongside the other TRC lines. It is unclear whether the report includes the movement performed in Zambia or only those in Tanzanian territory. Since Zambia is outside the scope of the project, data from the TAZARA line is included in the Tanzania RIPI. Similarly, Mozambique reports the movements of the Nacala corridor (operated by two concessionaires) in its annual report. Therefore, the section of the line that crosses Malawi is computed within the RIPI for Mozambique. Another instance of border adjustment in this project occurred in the assessment of Sudanese and South Sudanese railways. The line connecting Wau in South Sudan to Babanusa in Sudan used to be part of the network that precedes the separation of the two countries. Latest data from the Sudan Railway Corporation (2014) does not specify whether the section of line in South Sudan has been included or not. For calculation purposes, this report assumes that the line is included in the statistics presented. The method used for compiling data followed a systematic approach that prioritised consistency. Error! R eference source not found. illustrates the combination of primary and secondary statistics to generate the RIPI comprising traffic volumes. Firstly, international databases, where data is standardised, were consulted. For geographic information such as land area, population, and network size and gauge, the CIA Factbook was used (4). The economic indicator of GNI per capita was sourced from the World Bank (5). For Human Development Indices (HDI), information was drawn from the United Nations Development Programme database (6). Under scrutiny, the CIA Factbook has shown consistency with other reliable sources. As demonstrated in Table 4 for network size, there is little discrepancy between the Factbook and other sources. Sources for comparison included the UIC database, apart from Uganda where the data was drawn from the country’s annual report. Table 4: Validation of CIA Factbook data using network size (route-km) Country CIA Factbook UIC database Difference DRC 4007 3641 9% Ethiopia 759 754 1% Madagascar 673 673 0% Malawi 767 797 -4% Mozambique 3128 3116 0% Nigeria 3798 3528 7% Sudan 4313 4313 0% Tanzania 3682 3662 1% Uganda 1244 1266 -2% 5 TRAFFIC VOLUME REPORT - Novel traction systems for sustainable railway futures in LICs Figure 1: Traffic volume analysis methodology Railway-related indicators derived from a number of sources. For both transport stock and performance, the International Union of Railways (UIC) database was the primary source consulted (7). The UIC database provides statistics on length of lines and tracks on the infrastructure network, passenger and freight traffic (e.g. passenger-kilometres and tonne-kilometres), train movements, rolling stock, staff numbers, financial results, etc. for more than 100 railway companies. The information is provided by railway companies worldwide and made publicly available via UIC’s online tool known as ‘RAIL Information System and Analyses’ (RAILSA). As it is not mandatory for railway companies to provide information, whenever data was not available on the international database, specific searches were conducted through annual reports of railway operators or responsible ministries. Unavailable data is acknowledged in Section 2. 6 TRAFFIC VOLUME REPORT - Novel traction systems for sustainable railway futures in LICs 2. Update on the State of Knowledge (SOK) 2.1 Main findings In 2018, the University of Birmingham’s Centre for Railway Research and Education (BCRRE) conducted a review of the state of knowledge on railway infrastructure in low-income countries (LICs) in Sub-Saharan Africa. The project consisted of a thorough literature review supported by a stakeholder workshop in Nairobi, Kenya, to assess the levels of infrastructure and operational performance in the region. Three main findings of Phase 1 will be discussed here. Firstly, data recording and publication is fragmented and the levels of reporting varies significantly between countries. Secondly, in most countries railway networks remained unchanged since the period of European influence, leading to outdated and dilapidated assets. Finally, a lack of standardisation dating back to colonial times has fragmented the region into extraction lines between ports and commodity hubs with little connectivity and interoperability. Figure 2: Different track gauges used in Sub-Saharan Africa (8) Data availability and consistency remains one of the main challenges for railway research in the region. Information regarding railway performance and assets was found to be outdated or missing. This was emphasised in the three main sources for the state of knowledge in the region (9; 10; 11). Until 2009, the World Bank maintained a comprehensive database dedicated to railway infrastructure in Africa, which was used to fill knowledge gaps during phase one (12). Since then, improvements in data reporting have been found to vary greatly among countries, being also influenced by changes in ownership. Regarding the maturity of railway infrastructure, the main finding of Phase 1 is that the overall state of SubSaharan African countries is mostly in poor shape. With the exception of a few newly built lines, the network in the region has remained unchanged since the period of European influence, with assets dating back to almost 100 years ago. As a result, most lines are extraction lines connecting commodity hubs to ports (Error! R 7 TRAFFIC VOLUME REPORT - Novel traction systems for sustainable railway futures in LICs eference source not found.). Moreover, also as a result of the fragmented and competitive European exploitation of the region, there is very little connectivity and interoperability. Error! Reference source not f ound. illustrates the wide diversity of track gauges in use across the continent, which reduces the efficiency of rail to promote regional economic activity. With the emergence and subsequent dominance of road transport in the second half of the twentieth century, the railways in Sub-Saharan African low-income countries entered a downward spiral of shrinking revenues, insufficient maintenance, and inefficient operations that led to the current state. It was found that in many countries, major sections of tracks were not in operation and required rehabilitation before any operation could recommence, such as Ghana, Uganda, and Benin. Since the 1990s the region experimented with privatisations and concessions as an attempt to revitalise the railway sector with varying levels of success. Concessions such as SITARAIL (Burkina Faso/Cote d’Ivoire), CAMRAIL (Cameroon), Nacala-CDN (Mozambique), and MADARAIL (Madagascar) remain active and productive in some cases. Other agreements were not as successful such as the Rift Valley Railway concession (Kenya/Uganda) where the operator did not achieve the expected performance set in the contract. Similarly, TransRail operating between Senegal and Mali has recently stopped operations due to the fluctuation in the price of commodities. Two countries were found to have fully private lines that were operated by the mining companies exploring the natural resources (Guinea and Togo). Based on the restricted information available, these have been relatively successful in maintaining sustainable traffic volumes. However, there has been no direct correlation between liberalised markets where concessions have been made, traffic density, and labour productivity (9; 10). One of the reasons for that is the nature of concessions made in African LICs which hindered productivity. Loose regulatory frameworks were responsible for the lack of maintenance that resulted in asset dilapidation. Figure 3: Railway lines, cities, and economic hubs in Sub-Saharan Africa Regardless of the ownership structure, the state of infrastructure in Sub-Saharan LICs was found to be insufficient when compared to the global averages, with a much more drastic contrast when compared to 8 TRAFFIC VOLUME REPORT - Novel traction systems for sustainable railway futures in LICs world leaders in railway transport (9; 11; 8). The total network size of the countries of this study combined is smaller than that of the top ten countries in the world in terms of network size and traffic (Table 5). The network density for all Sub-Saharan LICs, measured in route-km per km2 of land area, is only one tenth of that of the United States, which has a similar land area. Network density in route-km per million population is also significantly smaller than countries with more developed railways, even those extremely highly popluated ones such as China and India. Table 5: Network size and network density comparison with countries Country Land Area (km2 ) Network size (route-km) Network density (route-km/1,000 km2 ) Population Network density (route-km/ million people) USA 9833517 293564 29.9 334,998,398 876 China 9596960 131000 13.7 1,397,897,720 94 Russia 17098242 87157 5.1 142,320,790 612 Canada 9984670 77932 7.8 37,943,231 2,054 India 3287263 68525 20.8 1,339,330,514 51 Argentina 2780400 36917 13.3 45,864,941 805 Germany 357022 33590 94.1 79,903,481 420 Australia 7741220 33343 4.3 25,809,973 1,292 Brazil 8515770 29850 3.5 213,445,417 140 France 643801 29640 46.0 62,814,233 472 Sub-Saharan LICs 10355903 26236 2.5 632,854,305 41 There are, however, considerable differences among countries in the region, as shown on Error! Reference s ource not found.. The chart uses SITARAIl and Ethio-Djibouti Railways instead of the countries because they are cross-border lines. Calculations were made using the combined area and population of the countries crossed by the line. 9 TRAFFIC VOLUME REPORT - Novel traction systems for sustainable railway futures in LICs Figure 4: Network density per area and population of Sub-Saharan LICs Even with smaller networks, traffic volumes found in the region are low when compared to global averages. Based on the information available, only six networks achieved more than one billion transport units (as a combination of tonne-km and passenger-km) per annum (Error! Reference source not found.). Leading c ountries seem to have a private element in common. Mozambique transported over 10 billion transport units in 2019, of which 80% were produced by concession lines. Despite leading the cohort of countries by a large margin, the Mozambican volumes are only approximately one tenth of the performance of the railway sector in the United Kingdom of 97 billion transport units (13; 14). For comparison, the United States, which covers a similar land area with ten times more route-kms of track, transported 2.4 trillion transport units in 2019. Such comparisons are only demonstrative of scale and not of performance, given that the network size of each country is considerably different. It must also be noted that the absence of up-to-date data for all LICs in SubSaharan Africa may distort higher performances achieved recently. See Section 2.7(commentaries on data availability) for a summary of data currencies for the countries within the study scope. -0.2 0 0.2 0.4 0.6 0.8 1 1.2 0 500 1000 1500 2000 2500 3000 3500 4000 4500 5000 Km of track per million population Km of track per 1,000km2 Km of track per 1,000km² of area Km of track per million population 10 TRAFFIC VOLUME REPORT - Novel traction systems for sustainable railway futures in LICs Figure 5: Traffic volumes observed in Sub-Saharan LICs Error! Reference source not found. also highlights the dominance of freight transport in the railway sector of S ub-Saharan African LICs. With the exception of Tanzania, freight accounts for over 90% of the movements by rail in the region. The routes of most lines in the continent, which favour economic corridors of commodities and may not link the largest urban areas in the countries, explain the disproportionate division. The focus on freight, however, is not necessarily an indicator of low maturity of the sector. Large countries like the United States, Canada, Australia, and Brazil operate high volumes of freight and small volumes of passengers due to the distance between main urban centres. When looking into traffic densities, Liberia leads the cohort with a performance of approximately 7.4 million transport units per route-km (Error! Reference source not found.). This stands as greater density than Canada ( 5.6 million transport units per route-km), and is not far from the United States (8.1 million). Similarly, Guinea achieves over 5 million transport units per route-km with the transport of iron ore by private companies (data from 2005). With a much more recent dataset, Mozambique recorded over 3 million transport units per route-km, of which the concession lines were a main contributor. However, these are still far from worldleading countries such as China and Russia that achieve over 30 million transport units per route-km. On the other hand, many other countries are still far behind in their operational efficiency, recording densities in the thousands of transport units per route-km. While the high performers had a private element in common, the low performers are not all state-owned, such as the case of SITARAIl and BENIRAIL (Benin) operated by Bollore Logistics. 0 500 1000 1500 2000 2500 3000 3500 4000 4500 5000 Benin SITARAIL DR Congo Ethio-Djibouti Railway Guinea Liberia Madagascar Malawi Mozambique Nigeria South Sudan Sudan Tanzania Togo Uganda Freight volumes (million tonne-km) Passenger volumes (million passenger-km) 11 TRAFFIC VOLUME REPORT - Novel traction systems for sustainable railway futures in LICs Figure 6: Traffic densities in Sub-Saharan LICs Notwithstanding the relatively high performance of Liberia and Guinea, the overall region still carries very low traffic densities in its networks. Key contributors to the poor performance are the state of infrastructure assets which limit operations (9; 11). The maximum axle load that the railway track structure can withstand in Sub-Saharan African LICs is approximately 15 tonnes, in contrast to 25 or over 30 tonnes in more developed regions (9). In addition, the poor condition of infrastructure and the absence of digital signalling technology severely limit the capacity of the lines. There has been accounts of average speeds of only 18 km/h in those countries (9). Such reality explains the geopolitical paradigm of the last decade in Sub-Saharan LICs. Attention of African LICs has shifted towards the construction of brand new lines, using standard gauges and modern standards, rather than renewing existing infrastructure. These plans align under the continental vision of a high-speed network in its Agenda 2063 vision (15). Building on that momentum, several countries have signed large loans, mostly with Chinese funders, to build new Standard Gauge Railway (SGR) lines [refer to next section for details]. Countries such as Nigeria, Ethiopia, Kenya, and Tanzania have built new lines using international loans. The lines in Ethiopia and Tanzania are electrified while those in Kenya and Nigeria still run with diesel locomotives. These agreements have been met with certain resistance but they have drastically changed the technical paradigm of Sub-Saharan African Railways. For instance, the newly constructed line between Djibouti and the dry port of Mojo in Ethiopia has reduced journey time from 84 hours to under 15 hours (16). Similarly, the Standard Gauge Railway has reduced journey times between the port of Mombasa and Nairobi to less than 5 hours, and similar improvements were found in Tanzania (17). 2.2 Recent updates and future plans 2.2.1 Benin • According to Bouraima and Yanjun (18), Benin seeks to rehabilitate 438km of the railway from Parakou to Cotonou. China Railway Construction Corporation is expected to construct the extension of the remaining 450km Parakou to Cotonou line to reach 594km. 2.2.2 Burkina Faso • In 2019, a bilateral agreement was signed by the presidents of Côte d’Ivoire and Burkina Faso for the modernisation of the Abidjan – Ouagadougou – Kaya route and an extension of the manganese deposits at Tambao near the borders of Niger and Mali (19). 0 2000 4000 6000 8000 10000 12000 Benin SITARAIL DR Congo Ethio-Djibouti Railway Guinea Liberia Madagascar Malawi Mozambique Nigeria South Sudan Sudan Tanzania Togo Uganda Traffic density (thousand transport units/route-km) 12 TRAFFIC VOLUME REPORT - Novel traction systems for sustainable railway futures in LICs 2.2.3 Cote d’Ivoire According Bouraima and Yanjun (18), there were various studies and funding carried out to assist with numerous railway projects such as: • the construction of the San Pedro-Bamako railway for the exploitation of minerals; • the construction of the 338km Ouangolo-Niellé-Sikasso-Bougouni railway at a cost of CFA franc240 billion, including 86km in Ivory Coast; • the construction of the 181km long Man-Nzérékoré (Guinea Conakry) railway at a cost of CFA franc127 billion; and • the “RAIL CITY†project at a cost of CFA franc300 billion to revalue the landholdings of SIPF in Plateau district. 2.2.4 Ethiopia • In the end of 2016, the Ethio-Djibouti railway was opened. The 759 km standard gauge line links the capital Addis Ababa to Djibouti port is fully electrified and was built by Chinese companies using a loan from the Asian country (20). • Funding was awarded in 2020 for a comprehensive two-year study of the technical, economic, environmental and social feasibility of building a 1,435 mm gauge railway linking Addis Ababa in Ethiopia with Khartoum in Sudan, together with an extension to Port Sudan on the Red Sea (21); • The African Development Bank board approved a US$1·2m grant to the Ethiopian government, while the NEPAD Infrastructure Project Preparation Facility will provide a US$2·0m grant and the two countries will each contribute US$0·1m. 2.2.5 Guinea According to Bouraima and Yanjun (18): • Construction of a new railway facility to connect the Santou mining zone and the Port of Dapilon in Guinea. This is referred to as the Dapilon - Santou rail project which has an estimated cost of $3bn; an investment from SMB-Winning consortium. • The construction of the new rail line is expected to enable faster and more efficient transportation of bauxite to the docks in high concentration. Also, it is to help expand the mining zone while reducing the corporate transportation cost. • There is also an agreement with the Chinese-backed international consortium to build a 650km Standard Gauge Railway (SGR) and a deep water port at a cost of $14bn in exchange for permission to mine a massive, untapped deposit of high-grade iron ore. 2.2.6 Liberia • A memorandum of understanding has been signed between a mining project developer, Niron Metals plc and the Liberian government to enable the exportation of iron ore from a proposed mine at Zogota in Guinea through Liberia by rail (22). 2.2.7 Nigeria • In 2016, the country opened a Standard Gauge Railway (SGR) line between Abuja and Kaduna. The China Civil and Engineering Construction Company built the 186 km line which was funded by a loan from China. • A US$2billion budget was approved by the Nigerian Federal Executive Council in September 2020 for the construction of a rail line from northern Nigeria to Niger. A memorandum of understanding was signed in January 2021 between Nigeria’s Federal Ministry of Transportation and a Portuguese company, Mota-Engil to construct this route along with 12 new stations on the route within 32 months (23). • In 2019, the Nigerian government signed a US$3.9billion contract with China Railway Construction Corp International (CRCCI) for the completion of the Abuja- Warri railway corridor. This project is mainly 13 TRAFFIC VOLUME REPORT - Novel traction systems for sustainable railway futures in LICs financed by the Export-Import Bank of China (75%) and the CRCCI (10%) through a public-private partnership (24). • The government also launched the construction of a rolling stock assembly plant at Kajola in Ogun state in the same year. The plant is to be used for the assembly of locomotives, coaches, wagons and diesel multiple units for both domestic use and export to other West African countries (25). 2.2.8 Tanzania • Tanzania Railway Corporation has recently signed contracts for two Chinese construction companies to build the country’s 1,435 mm gauge network, covering the 249 km from the dry port at Isaka to Mwanza on Lake Victoria (26). • Construction of the first 207 km section of the 1,219 km main line between Dar es Salaam and Morogoro is being built by a consortium of Yapı Merkezi and Mota Engil Africa under a €1·8bn contract awarded in 2017, and is expected to be completed in 2021. 2.2.9 Togo • The metre-gauge railway running inland from the coast at Anéhoto to Lomé and Blitta is currently out of use. Passenger services ceased in the mid-1990s, and since 2013 only the 40 km Tabligbo – Dalavé route has been operational, carrying phosphate and ore (27). • A short 3 km cross-border connection was completed in 2014 linking a cement plant at Aflao in Ghana with the port of Lomé. 2.2.10 Uganda • In 2018, an agreement to fund rehabilitation of the 375 km Northern Line between Tororo and Gulu was signed by the European Union (EU) and the government of Uganda. The Ugandan government contributed €13·1million and the EU provided a €21·5m grant as well as funding of a logistics hub at Gulu (28). 2.3 Commentary on data availability • Lines operated by concessionaires were mostly found to lack transparency reporting. Information about Benin (BENIRAIL) and SITARAIL (Burkina Faso/Cote d’Ivoire) were only briefly available on the company’s annual report from 2018. The document mentions only the annual tonnage moved, in that tonne-km had to be inferred by multiplying it by the length of the line. • The Democratic Republic of Congo (DRC) was the only country where up-to-date data was published the International Union of Railways (UIC). Being one of the few countries in the region to hold a membership of the union, the national operator (SNCC) maintains an updated record annually up to 2019. • Up-to-date information regarding the Ethio-Djibouti Railway Corporation was sent via e-mail by the operator’s director following the project stakeholder engagement workshop. • Information for Guinea was particularly difficult to source. The country, which seems to compute the highest traffic volumes in the region, accounts with a collection of private mining lines. The latest information available dates back to 2005 in the World Bank database. • Similarly, there are few concrete sources of primary and secondary statistics for the Liberian railway sector. Building from the concessionaire online sources, Arcelor Mittal operates its renewed line between Buchanan and Tokadeh connecting its mining operation and its port. Numbers are inferred from the company’s press release. • Madagascar and Uganda have published partial reports on their respective websites, which are slightly outdated (2014 and 2017 respectively). All statistics are included and allow the completion of their respective RIPIs. • Three countries were found to lack any updated information: Malawi, Togo, and South Sudan. • Nigeria, despite being one of the few countries where renovation work and the construction of new lines have taken place, did not publish complete data sets within international standards since 2005. In its Annual Abstract of Statistics, the country publishes total number of passengers and total number of tonnes 14 TRAFFIC VOLUME REPORT - Novel traction systems for sustainable railway futures in LICs carried but not passenger-km not tonne-km. Similarly, information on railway transport stock is not published. A number of contacts in the Federal Ministry of Transportation have been contacted to provide updated information but none has been received to date. • It was found that Sudan reported their national statistics regularly and comprehensively until 2014 within the UIC database. No later data was found. Staff from the Sudan Railway Corporation were contacted to provide up-to-date information but none has been received to date. • Tanzania and Mozambique publish annual reports that are up-to-date (2018 and 2019 respectively), comprehensive, and clear in terms of performance (passenger-km and tonne-km). However, rolling stock data from Tanzania has not been found past 2004. Mozambique, on the other hand, presents data in accessible format for both publicly owned and concession lines. Table 6: Data currency for all countries (and international routes) within the study scope Country/ International Route Data Currency Source(s) Benin 2005 2018 UIC database Bollore Logistics report SITARAIL 2018 Bollore Logistics report DR Congo 2019 UIC database Ethio-Djibouti Railway 2021 Ethiopian Railway Corporation (contact) Guinea 2005 World Bank database Liberia 2018 Arcelor Mittal website Madagascar 2014 MADARAIL website Malawi 2007 UIC database Mozambique 2019 Annual statistical report Nigeria 2005 World Bank database Sudan 2014 UIC database Tanzania 2005 2018 World Bank database Tanzania Railway Corporation annual report Togo 2005 World Bank database Uganda 2017 Uganda Railways Corporation report 2.4 Commentary on trends and forecasts This research looked at the latest datasets publicly available and included stakeholder inputs to understand recent trends and project demand forecasts. The limited information available on the current and future projects prevents any appropriate analysis of trends to produce equivalent forecasts. Most countries have not published data regularly enough to enable time series comparisons. Furthermore, transparency remains an issue concerning Sub-Saharan African countries as information released to the public on new projects is very limited. On a broader level, however, economic data is readily available but not entirely relevant to the context of railway demand and traffic forecasts. Overall, the region has sustained positive economic growth, albeit at decreasing rates, as shown in Error! Reference source not found. (29). Some countries such as E thiopia, Eritrea, Benin, and Uganda are still experiencing accelerated growth over 6% per year, whereas the economies of South Sudan and Sudan have shrunk. 15 TRAFFIC VOLUME REPORT - Novel traction systems for sustainable railway futures in LICs Figure 7: GDP growth in Sub-Saharan Africa (excluding high income) In general, economic growth is associated with increasing transport demand (30). More specifically, research covering over a century of data suggests that price elasticities tend to reduce when overall income grows in developing countries (31). This suggests that, as economies develop, fluctuations in transport demand ease and are turned into more sustained influence on demand. With such, traditional demand forecasting methods use four-stage models also based on economic data to forecast trip generation and mode choice (32). Nonetheless, while the evidence indicates a link between economic growth and transport demandis, it unwise to infer that it is the unquestionably the case for railway transport. This is even more crucial in countries where the rail sector is not operating at high levels. Traffic demand requires appropriate infrastructure, operational, and regulatory improvements to take place. This has happened in some countries, especially with the opening of Standard Gauge Railways, yet traffic has not necessarily followed the growth in capacity (33; 34; 35). That is because connectivity, convenience, and efficiency play important roles even when costs by rail are lower than by road (34). This can be observed in the only country of the cohort where reliable time series data is available. The Société nationale des chemins de fer du Congo, in the Democratic Republic of Congo, has consistently published its freight traffic data between 2003 and 2019. This type of analysis could not be expanded to other countries as similarly comprehensive data was not available. As shown in Error! Reference source not found., t raffic volumes have not grown proportionally with the economy. In contrary, rail traffic decreased by more than 50% while GNI per capita grew over 150%. Figure 8: Time series of SNCC's traffic volumes and GNI per capita in the DRC Reports from the Ugandan government show a similar issue with the concession of its lines to the Rift Valley Railway Corporation which was cancelled due to poor performance. Therefore, while releases on new projects may highlight potential increases in traffic volumes, these cannot be taken as a certainty in an aggregate manner. The literature documents how increases in rail traffic correlates with economic growth, but there is very little evidence of the latter influencing the former (36; 37; 38; 39). There is strong evidence that infrastructure and operational bottlenecks must be overcome to allow for economic growth to influence traffic density and promote competitiveness of the sector. Moreover, the four-stage model requires econometric data which is not available to accurately estimate trip generation and/or mode split. That said, although formal methods cannot be used to forecast specific changes in demand, a more general understanding of broader influencing factors may hint into potential changes in traffic volumes. One of them is the accelerated urbanisation trends in the continent. According to 0 100 200 300 400 500 600 0 100 200 300 400 500 600 2003 2004 2005 2006 2007 2008 2009 2010 2011 2012 2013 2014 2015 2016 2017 2018 2019 Million tonne-km Million passenger-km GNI per capita 16 TRAFFIC VOLUME REPORT - Novel traction systems for sustainable railway futures in LICs the OECD, Africa’s cities will be home to an additional 950 million people by 2050 (40). With that, one can infer that the demand for passenger services between cities, and demand for the transport of goods, are likely to increase. Simliarly, there is a strong political will to reconnect the continent with railway lines, even with the inclusion of high-speed services. The ambitious plan detailed in Africa’s Agenda 2063 emphasises key corridors for rail development and may assist with positive changes in railway traffic (15). A symbol of that can be taken by the current developments in the sector, yet these have been done mostly at national or bilateral level rather than regionally. The combination of new SGRs, and improvements and extensions to existing metre gauge lines (e.g (41)). With new lines, and potentially the adoption of new technologies, operational costs may be reduced to increase the competitiveness of the mode against road counterparts. Given the impact of price elasticities observed in the literature for transport (31; 42), reduction in costs can lead to increased traffic in a virtuous cycle that promote more competitive traffic densities. On the other hand, these exogenous factors still depend on the sector’s ability to deliver appropriate infrastructure and governance to translate technical and technological advancements into operational efficiency gains. So far, the opening of new Standard Gauge Railway lines has not been able to transform the landscape in such direction (33; 35), and Chinese loans still remain the primary source of funding for the construction of new lines and/or renovation of existing tracks. It seems, therefore, that reliable forecasts for the region depend on its own ability to deliver existing plans and ambitions. The recent trajectory in countries where SGRs were not contracted indicates growing challenges, and data for the new SGRs seems to show that new lines are not necessarily an assurance of volume growth. In that, it appears that low-income countries in Sub-Saharan Africa need to implement appropriate infrastructure and governance to unleash the dynamics that enable traditional forecasting methods to take place. 2.5 Commentary on the selection of case studies Given the difficulty in elaborating a systematic process to select case studies in the region for further research, the project team adopted an alternative qualitative approach based on stakeholder inputs and line characteristics. Following the key stakeholder workshop, experts were asked to submit their suggestions for case studies. Four suggestions were received for two lines: Kampala – Namanve in Uganda, and Addis Ababa – Djibouti linking Ethiopia to Djibouti. The former was given a high interest for its peculiar setting of a short commuter line in a region dominated by long-distance freight routes. The latter was not considered for being electrified already and therefore requiring less drastic decarbonisation measures. Furthermore, the supporting role of the Nigerian Ministry for Transportation has highlighted the country’s railways as a potential case study. In particular, the Abuja – Kaduna line stands as a representative of the new Standard Gauge Railways (SGRs) that some countries have built, or are planning to build. The 186 km line was planned to operate mixed traffic, yet government officials have mentioned that only passenger services are currently running. The Ministry has agreed to supply detailed information about rolling stock and traffic volumes, yet none has been received at the time of this report. On top of that, the research team assessed a number of routes in the countries within the scope of the project. Lines were then chosen to represent different lengths and uses of routes, taking data availability into consideration. The final representative line is the Buchanan – Tokadeh route operated by Acelor Mittal. The privately owned line stands as a case of dedicated heavy haul freight lines which have distinct requirements. Table 7: List of selected case studies Routes considered Route type Data availability Kampala – Namanve (Uganda) Commuter Train type – online reference sources available Train parameters – online reference sources available and / or data from UoB model library Buchanan – Tokadeh (Liberia) Heavy haul freight Dar es Salaam – Kigoma (Tanzania) Long distance passenger 17 TRAFFIC VOLUME REPORT - Novel traction systems for sustainable railway futures in LICs Routes considered Route type Data availability Alignment & gradient profile – available from Google Earth Pro Line speeds: Assumed based on published journey times Abuja – Kaduna (Nigeria) Standard Gauge Railway (designed for mixed traffic but currently only operating passenger services) Data confimed by the Ministry, yet to be made available to refine initial models based on Google Earth information. 18 TRAFFIC VOLUME REPORT - Novel traction systems for sustainable railway futures in LICs 3. Scenario analysis 3.1 Introduction Trend analyses of railway traffic in low-income countries in Sub-Saharan Africa has indicated little predicatability and highlighted the shortcomings of potential forecasts in the region. The fragmented trade, and diverse uses and maintenance levels of lines across the region mean that volumes are highly volatile. The story in Uganda is a relevant example where the network was concessioned in an attempt to increase productivity which was not realised. Other countries such as Guinea and Liberia resorted to authorisation pathways where private companies have become responsible for the lines used, which led to high productivity and traffic densities. Of the countries studied in this project, Tanzania represents the third group where large investments are being made in the construction of new Standarg Gauge Lines to increase traffic volumes and make rail transport more attractive through economies of scale. For various reasons, price competition between road and rail in Sub-Saharan Africa, has not led to proportional economies. In road, cartels and high profit rates, coupled with poor road conditions and security costs, maintains the price per tonne-km high (43). In rail, lowering costs is much more difficult than dismantling cartels and reducing profit margins. The high capital and operational costs requires railway operators to move sufficient volumes to make lines financially viable. This explains why. The World Bank (44) roughly estimates that a railway line needs to move approximately 1 million tonnes of freight to break even. This is based on previous analyses and counts with a haulage of approximately 500 km, which would loosely result in 500 million tonne-km per year. These numbers are more focused on freight as (1) most passenger services and lines around the world are subsidised, and (2) more than 90 per cent of the traffic units in the countries assessed are in the form of good rather than people. Of the 15 countries studied in this project, only four achieve the mark of one million tonnes per year (in green), and three of them are either privately owned (Guinea and Liberia), or privately operated (concessions in Mozambique). In addition, these totals comprise more than one line in Mozambique. Ethio-Djibouti Railways is a new Standard Gauge line built under a Chinese loan and currently still under a concession agreement for Chinese operations. It must be noted that the data presented in the table contains some estimates (Malawi, Nigeria, Togo, and Uganda) and outdated information (Madagascar – 2017 and Sudan – 2013). Table 8: Annual traffic volumes in the LICs contemplated by the project Country Million tonnes per year Benin 0.11 SITARAIL 0.8 DR Congo 0.40 Ethio-Djibouti Railway 1.45 Guinea 5.34 Liberia 7.39 Madagascar 0.18 Malawi 0.10 Mozambique 3.62 Nigeria 0.07 South Sudan 0.00 Sudan 0.99 Tanzania 0.36 Togo 0.30 Uganda 0.10 19 TRAFFIC VOLUME REPORT - Novel traction systems for sustainable railway futures in LICs In place of forecasts, this section will analyse four different scenarios and their impacts on traffic volumes. A review did not find a comprehensive set of forecasts for traffic growth, so scenarios will build on a projections made for the East Afican region by the World Bank (45). In 2013, the report projected that traffic would grow 800% from 1.6 million tonnes to 14.6 million tonnes annualy. Such forecasts were potentially taking into account the contemporary plans for an East African Standard Gauge Network which has only been partially completed. Moreover, there have been issues and uncertainties surrounding the matter. While it was believed that an SGR line could carry 25 million tonnes annually against 5.5 million tonnes of a renovated legacy line, growth was not fully realised in the Kenyan case where the Port Authority needed to impose mandates on importers to fully utilise the line (46). However, the use of scenarios is meant to accommodate a range of possible futures, with the intent to capture the space between the probable and the desirable. There are many variables influencing traffic volumes, such as the quality of infrastructure; sections in use/disuse; speed limits; presence/absence of subsidies; ownership models; etc. Therefore this research uses a more flexible approach based on the work of Gallopin et al. (47). This approach uses a number of scenarios named as classes and variants, and analyses their behaviour over a set of themes. In alignment with the HVT programme, the themes expand beyond operational indicators to include environmental, economic, and social aspects into consideration. The themes in question are: • Traffic volumes, also understood as operational efficiency • Technology adoption as a measure of innovation • Environmental impacts of railway transport • Financial viability reflecting the profitability of railway lines • Governance reflecting the role of government in maintaining the railway sector • Social impacts encompassing the wider influence on mobility, equity, and access to opportunities The scenarios are summarised in Error! Reference source not found. and explained in detail in their relevant s ub-section. Figure 9: Future scenarios and their trajectories in selected themes 20 TRAFFIC VOLUME REPORT - Novel traction systems for sustainable railway futures in LICs 3.2 African vision This scenario explores the possibility of the completion, or at least part-completion, of the goals stated in the Agenda 2063 initiative of the African Union (15). This includes a network of ten High Speed Rail Corridors as pictured on Error! Reference source not found. (48). Very close to a desirable scenario, it encompasses s ignificant changes in integration, technological advancement, modal shift, and cohesive governance. Based on a study by CPCS (48), these links can carry at least 50 million tonnes, whilst some may achieve much greater volumes of up to 15 billion tonnes thanks to improved capacity and speed. Construction of new tracks occurs simultaneously to renewal of existing lines for regional traffic, and adds up to 20,000 km of tracks to the continent. This increases the network density and improves overall access by population and businesses. Figure 10: Proposed High Speed Rail Network of the AU Agenda 2063 It logically follows that in such vision traffic volumes will increase considerably, perhaps achieving the 800% growth foreseen by the World Bank. Nonetheless, the growth will not be linear but an exponential curve. To achieve such outcome, a slower start is to be made with works on interoperability, and the construction of new infrastructure and procurement of rolling stock. Once the systems are in place, the curve shoots upwards. To achieve that, the constant adoption of technological advancements must take place so that capabilities and performance levels are paved to enable the following steps in traffic volumes. This goes hand in hand with the financial viability, where a positive feedback loop increases efficiency which in turn lowers the price of haulage. Novel traction systems can find ways to increase capacity without the initial costs of electrification, until volumes make the latter a justifiable investment. The positive impacts on the environment, however, can be observed from the beginning of the development trajectory, and takes an accelerated pace. These are a result of cleaner technologies that reduce emissions at the point of use, as well as modal shift resulting from lower haulage prices. Savings in emissions, however, follow the law of diminishing returns, and once technological capabilities reach a certain point, improvements begin to result in ever smaller marginal reductions. 21 TRAFFIC VOLUME REPORT - Novel traction systems for sustainable railway futures in LICs All the changes in the African Vision scenario are built on the understanding of better and more cohesive governance. This is stark contrast of the situation so far, where initiatives for railway development have been fragmented and dispersed. The scenario envisages a more active presence of policy maker and regulators as enabling forces to facilitate the adoption of new technologies and facilitate funding of railways to promote modal shift. Social impacts, if these lines are planned cohesively as per the Agenda 2063 plan, will take place throughout the timeline. Firstly with the revitalisation of local routes, then with the possibility of easier travel through longer routes, and also benefitting in access to goods from more cost effective supply chains. On a smaller but not irrelevant scale, the growth of the railway industry in the region also has a positive impact on jobs, entrepreneurship, and opportunity. 3.3 Renewed links The scenario of Renewed Links foresees a much more modest growth in the railway network, especially across low-income countries. In this scenario, high-speed rail links are achieved in higher income countries but cannot find economic justification in low-income countries within the timeframe. Instead, it views a greater focus on the renewal and some upgrading of the existing network to reinstate traffic across the region. The scenario presents a mix of probable and possible futures, based on the latest happenings in countries such as Nigeria, Kenya, and Uganda. Nigeria and Kenya, both countries that built new Standard Gauge Rail lines using international loans, have found considerable challenges in matching the high construction costs with sufficient traffic. Kenyan and Ugandan railways have also decided to invest in the reivtalisation of existing metre gauge lines as a more cost effective way to improve traffic in the region. Traffic volumes in the Renewed Links scenario take an initial hit as works must be performed on the only track avaialable. However, once the work is done, sections of the network that are currently unused, or with severe speed restrictions, will return to full capacity and permit greater overall volumes. According to the World Bank study (45), track renewal could achieve up to 5.5 million tonnes hauled (considering 40 train services per week, and 40 wagons per train), or 60 million per line fully upgraded to allow for 25 tonnes per axle. The physical limitations of renovated/upgraded track, in contrast to new SGR lines with higher specifications, may result in a slower upwards curve in traffic volumes. Nonetheless, considering a constant increase in governance and consequently technological adoption, it is expected that achievable (and achieved) traffic volumes are to increase at an accelerating pace and potentially exceed the initial calculations. The study highlights that metre gauge lines in Brazil can achieve 45 tonnes per axle, which could see traffic volumes reach 100 million tonnes on busy links. This scenario understands a crucial role of governance in providing a fruitful platform for innovation so that capabilities can be increased further than just returning the legacy network to its original state. Strong support in capacity building accompanies funding, especially when the latter comes from international loans. Also, governance plays an important role in connectivity and interoperability, improving the border crossing on currently dispersed and fragmented standards. Such combination adds much needed capacity on the networks and reinstates sufficient financial viability so that haulage costs are competitive against rail. Regulation may still be necessary at points to internalise external costs and promote fair competition that benefits stakeholders equally. The increased role of rail in freight traffic, currently relegated to around 10% of the volumes moved in LICs in Sub-Saharan Africa, is expected to have a direct impact on the overall emissions from transport. With that, environmental benefits are expected to follow an S-shaped trajectory. Slower in the beginning reflecting the time to reinstate infrastructure, but rapidly accelerating once the lines at full capability. At a certain point, diminishing returns result in marginal gains over increasing efforts until the sector achieves carbon neutrality. Similarly, social benefits increase from added accessibility of the reinstatement of abandoned routes, but at a smaller scale to the African Vision scenario where rail offers competitive alternatives to medium and long distance links. Opportunities arise in the sector, yet given the scale of the industry, the impacts are constrained. 22 TRAFFIC VOLUME REPORT - Novel traction systems for sustainable railway futures in LICs 3.4 Private railways This scenario contemplates the space between the possibility and the probability that railways in LICs in SubSaharan Africa will follow the paths of Guinea, Liberia, and parts of Mozambique in that private companies take over full or partial control of lines. It elaborates on a potential version of ‘business as usual’ trajectories, where the railways are not renovated nor developed in a way that stimulates appropriate traffic to generate financial viability. One may argue that some countries in the region are heading towards such direction, where the inability (in both finance and governance) to fund railway operations and maintenance relegates lines to poorer and poorer conditions until traffic is unsustainable. At that point, the only way out lies in private companies taking over. It must be noted that not all concessions fall within this scenario, since they depend on specific contractual terms. Concessions where regulation is absent, on the other hand, may follow the trajectories of this scenario. Governance in this case is a downward curve where the hand of retulators and policy makers is steadily reduced from the sector. Traffic volumes follow a known trajectory in these cases. After stagnation in traffic volumes and the need for private investment, the private sector chooses only profitable lines to operate specific services. That is a logical result of the incentives surrounding their goals: reduction of costs, and increase in productivity. Cases around the world indicate a curve in the increase of traffic volumes, where essential work is conducted on promising lines, leading to traffic densities comparable to high-income countries. Such transformation happens mostly in mining connections where the economies of scale produce good financial margins.These may include upgrading lines or even building Standard Gauge lines in order to carry maximum axle loads and haul as many tonnes as possible. However, single traffic of only one product may create limits on traffic volumes by demand forces rather than technical capability. This is observed in Guinea and Liberia where haulage reaches values north of 7 million tonnes annually. On the other hand, some corridors may achieve much greater volumes if linking entire regions (i.e. East African Community). Furthermore, traffic volume are also limited by the law of diminishing returns, and at a certain point, the amount of engineering effort required to increase volumes become financially uninsteresting. That is why the Private Railways scenario understands that financial viability follows a similar curve to traffic volumes, as both are closely linked in this case. Financial viability is limited by demand, and in case of extractive activities, may be limited by supply as well. Technology adoption is also modest in this scenario because it is driven by market forces. There is a push for technologies that increases productivity but all innovation is strictly scrutinised by cost-benefit analyses. Radical innovation, such as traction systems, are less likely to be adopted if they require large investments in fleet and/or infrastructure. Consequently, the environmental impacts remain largely unchanged since they are unlikely to be prioritised. In fact, since some less proficable corridors may be abandoned, modal shift can revert to an even greater dominance of road transport, and lead to further environmental degradation. The same can be said for social benefits where there are few changes, lest some negative impacts. The productivity of privately run lines may not revert to social benefits if all are focused on the exports of commodities. 3.5 Forgotten tracks This scenario is a variation of the Private Railways, and to some extent, a projection of current trends in some LICs. Forgotten tracks explores the possibility that, apart from a few lines, most lines fail to produce sufficient financial viability to maintain operations. The lack of appropriate maintenance (due to financial shortcomings and skills gaps) initiates a vicious circle where capacity is reduced and therefore haulage costs increase. As a result, they fail to attract private investment, and cannot justify high level of subsidies or direct funding from public money. One by one, lines are slowly abandoned while goods are transported on roads where lower operational costs ensure some level of movement. Such trajectory comprises an apathy towards the adoption of new technologies, since continuous losses prevent stakeholders from investment beyond the bare essentials. Following the slow degradation of assets, financial viability slowly declines from maintenance, to speed restrictions, to section closures, to line abandonement. 23 TRAFFIC VOLUME REPORT - Novel traction systems for sustainable railway futures in LICs With it, the social benefits linked to railway transport erode to give way to unregulated modes where societal interests are an afterthought. With that, affordability and accessibility are reduced at the expense of unsolved cartels and high fares in road and air transport. The trajectory of governance is expected to take a up and down curve until oblivion. Initially, the government and public funds are required to take over in order to maintain services. This is not dissimilar to the recent examples in Uganda where the concession could not produce sufficient volumes so assets were returned to the government body; and Kenya where in face of the high interests on the loaned Standard Gauge line has led the government cancel renewal of the concession and operate the line itself. Nonetheless, once the lines start to degrade to a certain level, funding for governance starts to be applied elsewhere and with that the network rapidly enters a downward spiral of shrinkages. Finally, the impacts on the environment are felt as mode shifts towards more polluting options, mainly on road. This scenario does not take into account potential changes in the road sector, and adopts a business as usual perspective on it. Without appropriate policies, the unregulated road sector maintains reluctance to implement cleaner technologies, and that 10% of freight moved by rail ends up generating up to three times more emissions per tonne-km. 24 TRAFFIC VOLUME REPORT - Novel traction systems for sustainable railway futures in LICs 4. Rail infrastructure and performance indicators 4.1 Benin Economic maturity and human development GNI per capita (in US$) 1,250 Human Development Index (HDI) 0.545 Railway infrastructure Network size (route-km) 450 Network density (route-km/ 1,000 km2 land area) 3.8 Network density (route km/ million population) 41 Gauges in use 1,000 mm Railway transport stock Total number of locomotives 24 Total number of carriages 20 Total number of wagons 326 Operations and performance Annual freight traffic (million tonne-km) 48.6 Annual passenger traffic (million passenger-km) 0 Traffic density (total transport units / route-km) 111 Additional notes • Freight traffic extrapolated from the operator’s (Bollore Logistics) 2018 report (43). Data given of 108,000 tonnes per year transported over a line with 450 km • Fleet information dates back to 2005 from the UIC database. The operator (Bollore Logistics) has not replied to the information request • Bollore has stalled its upgrade programme due to an ongoing legal proceedings regarding the concession agreements with the government of Benin 25 TRAFFIC VOLUME REPORT - Novel traction systems for sustainable railway futures in LICs 4.2 SITARAIL Economic maturity and human development GNI per capita (in US$) Burkina Faso Cote d’Ivoire 780 2,290 Human Development Index (HDI) Burkina Faso Cote d’Ivoire 0.452 0.538 Railway infrastructure Network size (route-km) 1,260 Network density (route-km/ 1,000 km2 land area) 2.1 Network density (route km/ million population) 30 Gauges in use 1,000 mm Railway transport stock Total number of locomotives N/A Total number of carriages N/A Total number of wagons N/A Operations and performance Annual freight traffic (million tonne-km) 1,008 Annual passenger traffic (million passenger-km) 252 Traffic density (total transport units / route-km) 1,000 Additional notes • Freight traffic based on simple extrapolation from the operator’s (Bollore Logistics) 2018 report (43). Data given of 800,000 tonnes and 200,000 passengers per year transported over 1,260km line • Fleet information not available from the operator • In 2019, an agreement was made to upgrade the line, which is expected to increase traffic to 5 million tonnes of freight and 800,000 passengers per year (19) 26 TRAFFIC VOLUME REPORT - Novel traction systems for sustainable railway futures in LICs 4.3 Democratic Republic of Congo Economic maturity and human development GNI per capita (in US$) 530 Human Development Index (HDI) 0.480 Railway infrastructure Network size (route-km) 4,007 Network density (route-km/ 1,000 km2 land area) 1.8 Network density (route km/ million population) 52 Gauges in use 1,000 mm 1,067 mm Railway transport stock Total number of locomotives 91 Total number of carriages 233 Total number of wagons 3,196 Operations and performance Annual freight traffic (million tonne-km) 158 Annual passenger traffic (million passenger-km) 16 Traffic density (total transport units / route-km) 43.4 Additional notes • Data on transport stock and performance taken from the International Union of Railways (UIC) database and reflects 2019 statistics. 27 TRAFFIC VOLUME REPORT - Novel traction systems for sustainable railway futures in LICs 4.4 Ethio-Djibouti Railway Economic maturity and human development GNI per capita (in US$) Ethiopia Djibouti 850 3,310 Human Development Index (HDI) Ethiopia Djibouti 0.485 0.524 Railway infrastructure Network size (route-km) 759 Network density (route-km/ 1,000 km2 land area) 0.7 Network density (route km/ million population) 7 Gauges in use 1,435 mm Railway transport stock Total number of locomotives 41 Total number of carriages 30 Total number of wagons 1,100 Operations and performance Annual freight traffic (million tonne-km) 1,089 Annual passenger traffic (million passenger-km) 8 Traffic density (total transport units / route-km) 1,445 Additional notes • Recent data provided by member of staff of the Ethiopian Railway Corporation 28 TRAFFIC VOLUME REPORT - Novel traction systems for sustainable railway futures in LICs 4.5 Guinea Economic maturity and human development GNI per capita (in US$) 930 Human Development Index (HDI) 0.477 Railway infrastructure Network size (route-km) 1,086 Network density (route-km/ 1,000 km2 land area) 4.4 Network density (route km/ million population) 99 Gauges in use 1,000 mm 1,435 mm Railway transport stock Total number of locomotives N/A Total number of carriages N/A Total number of wagons N/A Operations and performance Annual freight traffic (million tonne-km) 5,760 Annual passenger traffic (million passenger-km) 38 Traffic density (total transport units / route-km) 5,339 Additional notes • The above data are sourced from a 2005 World Bank database and thus may be considered outdated • Note that no fleet data were available to the knowledge of the authors at the time of publication 29 TRAFFIC VOLUME REPORT - Novel traction systems for sustainable railway futures in LICs 4.6 Liberia Economic maturity and human development GNI per capita (in US$) 580 Human Development Index (HDI) 0.480 Railway infrastructure Network size (route-km) 243 Network density (route-km/ 1,000 km2 land area) 2.5 Network density (route km/ million population) 49 Gauges in use 1,435 mm Railway transport stock Total number of locomotives 4 Total number of carriages 0 Total number of wagons 195 Operations and performance Annual freight traffic (million tonne-km) 1,796 Annual passenger traffic (million passenger-km) 0 Traffic density (total transport units / route-km) 7,391 Additional notes • Transport stock and performance data extracted and loosely extrapolated from the operator (Arcelor Mittal) website (44) 30 TRAFFIC VOLUME REPORT - Novel traction systems for sustainable railway futures in LICs 4.7 Madagascar Economic maturity and human development GNI per capita (in US$) 520 Human Development Index (HDI) 0.528 Railway infrastructure Network size (route-km) 673 Network density (route-km/ 1,000 km2 land area) 1.2 Network density (route km/ million population) 30 Gauges in use 1,000 mm Railway transport stock Total number of locomotives 17 Total number of carriages 0 Total number of wagons 260 Operations and performance Annual freight traffic (million tonne-km) 122 Annual passenger traffic (million passenger-km) 0 Traffic density (total transport units / route-km) 181 Additional notes • Data collected from the operator’s (MADARAIL) website (45). There is no date attached to the transport stock information, and the performance data refers to 2014. 31 TRAFFIC VOLUME REPORT - Novel traction systems for sustainable railway futures in LICs 4.8 Malawi Economic maturity and human development GNI per capita (in US$) 380 Human Development Index (HDI) 0.483 Railway infrastructure Network size (route-km) 767 Network density (route-km/ 1,000 km2 land area) 8.2 Network density (route km/ million population) 46 Gauges in use 1,067 mm Railway transport stock Total number of locomotives 24 Total number of carriages 14 Total number of wagons 424 Operations and performance Annual freight traffic (million tonne-km) 33 Annual passenger traffic (million passenger-km) 44 Traffic density (total transport units / route-km) 100 Additional notes • Transport stock and performance data from 2007 as reported to the International Union of Railways (UIC) 32 TRAFFIC VOLUME REPORT - Novel traction systems for sustainable railway futures in LICs 4.9 Mozambique Economic maturity and human development GNI per capita (in US$) 490 Human Development Index (HDI) 0.456 Railway infrastructure Network size (route-km) 3,128 Network density (route-km/ 1,000 km2 land area) 4 Network density (route km/ million population) 112 Gauges in use 1,067 mm Railway transport stock Total number of locomotives 57 Total number of carriages 132 Total number of wagons 1,679 Operations and performance Annual freight traffic (million tonne-km) 10,520 Annual passenger traffic (million passenger-km) 793 Traffic density (total transport units / route-km) 3,617 Additional notes • Transport stock and performance data published by the state-owned railway company Ports and Railways of Mozambique (CFM). Annual traffic statistics include the privately operated lines, yet transport stock only refers to the state-owned fleet. Data from the 2019 annual report (46). 33 TRAFFIC VOLUME REPORT - Novel traction systems for sustainable railway futures in LICs 4.10 Nigeria Economic maturity and human development GNI per capita (in US$) 2,030 Human Development Index (HDI) 0.539 Railway infrastructure Network size (route-km) 3,798 Network density (route-km/ 1,000 km2 land area) 4.2 Network density (route km/ million population) 22 Gauges in use 1,067 mm 1,435 mm Railway transport stock Total number of locomotives 126 Total number of carriages 672 Total number of wagons 3,885 Operations and performance Annual freight traffic (million tonne-km) 77 Annual passenger traffic (million passenger-km) 174 Traffic density (total transport units / route-km) 66 Additional notes • The above data are sourced from a 2005 World Bank database and thus may be considered outdated • Staff from the Nigerian Railway Corporation and the Federal Ministry of Transportation have been contacted to supply up-to-date information. None has been received to date. • In recent communication, an engineer from the Federal Ministry of Transportation highlighted that the original Cape gauge network is barely usable to date, and operations have focused on the new standard gauge railway (SGR) system. 34 TRAFFIC VOLUME REPORT - Novel traction systems for sustainable railway futures in LICs 4.11 Sudan Economic maturity and human development GNI per capita (in US$) 590 Human Development Index (HDI) 0.510 Railway infrastructure Network size (route-km) 4,313 Network density (route-km/ 1,000 km2 land area) 2.3 Network density (route km/ million population) 107 Gauges in use 1,067 mm Railway transport stock Total number of locomotives 103 Total number of carriages 216 Total number of wagons 3,600 Operations and performance Annual freight traffic (million tonne-km) 823 Annual passenger traffic (million passenger-km) 81.5 Traffic density (total transport units / route-km) 210 Additional notes • Transport stock and performance data are sourced from the UIC concerning the Sudan Railway Corporation, but are figures for 2014 and thus may be outdated • Members of staff of the Sudan Railway Corporation have been contacted to supply more up-to-date information. None has been received to date. 35 TRAFFIC VOLUME REPORT - Novel traction systems for sustainable railway futures in LICs 4.12 Tanzania Economic maturity and human development GNI per capita (in US$) 1,080 Human Development Index (HDI) 0.529 Railway infrastructure Network size (route-km) 3,682 Network density (route-km/ 1,000 km2 land area) 4.2 Network density (route km/ million population) 72 Gauges in use 1,000 mm 1,067 mm Railway transport stock Total number of locomotives 149 Total number of carriages 216 Total number of wagons 3,600 Operations and performance Annual freight traffic (million tonne-km) 715 Annual passenger traffic (million passenger-km) 614 Traffic density (total transport units / route-km) 361 Additional notes • Transport stock data is from the World Bank and dates back to 2005, and thus can be considered outdated • Traffic volumes (tonne-km and passenger-km) were taken from the 2018 annual report of the Tanzania Railway Corporation and include traffic on the TAZARA line. 36 TRAFFIC VOLUME REPORT - Novel traction systems for sustainable railway futures in LICs 4.13 Togo Economic maturity and human development GNI per capita (in US$) 690 Human Development Index (HDI) 0.515 Railway infrastructure Network size (route-km) 568 Network density (route-km/ 1,000 km2 land area) 10.4 Network density (route km/ million population) 92 Gauges in use 1,000 mm Railway transport stock Total number of locomotives N/A Total number of carriages N/A Total number of wagons N/A Operations and performance Annual freight traffic (million tonne-km) 150 Annual passenger traffic (million passenger-km) 20 Traffic density (total transport units / route-km) 299 Additional notes • The above data are sourced from a 2005 World Bank database and thus may be considered outdated 37 TRAFFIC VOLUME REPORT - Novel traction systems for sustainable railway futures in LICs 4.14 Uganda Economic maturity and human development GNI per capita (in US$) 780 Human Development Index (HDI) 0.544 Railway infrastructure Network size (route-km) 1,266 Network density (route-km/ 1,000 km2 land area) 6.4 Network density (route km/ million population) 36 Gauges in use 1,000 mm Railway transport stock Total number of locomotives 43 Total number of carriages 21 Total number of wagons 1,558 Operations and performance Annual freight traffic (million tonne-km) 119 Annual passenger traffic (million passenger-km) 0 Traffic density (total transport units / route-km) 94 Additional notes • The above data are sourced from a 2017 report published on the website of the national operator (Uganda Railways Corporation). • The report highlights that large parts of the network, as well as part of the transport stock, are not in operational condition. • Members of staff of the Uganda Railways Corporation (URC) have been contacted to provide updated information. None has been received to date. 38 TRAFFIC VOLUME REPORT - Novel traction systems for sustainable railway futures in LICs 5. Concluding remarks This report builds on the previous work conducted by the University of Birmingham during Phase 1 of the HVT programme. The main aim of this activity was to update the state of knowledge of rail infrastructure in lowincome countries in Sub-Saharan Africa and compile the operational performance of each country in terms of traffic volumes and transport stock. This task established a more defined research scope to be taken forward in the research. Firstly, the project classified countries not only according to their gross national income (GNI) but also according to their human development indices (HDI). It was found that dividing the cohort based on a single metric (income) would exclude countries that experience similar levels of development and similar levels of maturity of their railway infrastructure. Subsequently, the traffic volume analysis narrowed its scope to countries that currently operate railway services. Reflecting on the findings from Phase 1 and the recent updates, it was seen that there has been some developments in the railway sector in the region, yet the countries are still far behind from their shared vision reported in the Agenda 2063 document (15). A few countries have opened new Standard Gauge Railway (SGR) lines, while only two did so with electrification. The others maintained diesel traction for the new lines. Railway movement in the region remains predominantly for freight, which accounts for over 90% of all traffic. The network, which has grown modestly, is still similar to that during the European exploitation of the continent, using railway lines to connect commodity hubs to ports. In fact, countries that have achieved the highest traffic volumes of the cohort seem to focus on carrying mining products, such as Guinea, Liberia, and Mozambique. These countries also have in common the presence of private companies operating within their borders, either in the form of private lines or concessions. Given the strong focus on profitability of private operations, it was not surprising to find that two countries (Mozambique and Guinea) achieved greater traffic densities (transport units/route-km) than some highincome European countries where passenger traffic is predominant. However, when compared to leading countries in railway freight, there is still a significant gap to be bridged. The disparity is even more prominent when considering the region as a whole. The countries and lines assessed in this report achieve an average traffic density of less than one million transport units per route-km, in contrast to 30 million achieved by China and Russia. Overall, this is explained by the poor condition of railway infrastructure assets that limit loading and speeds on the line. Notwithstanding the overall low performance, the indicators highlighted the variance in performance between countries. It was observed that there is no correlation between GNI and/or development index and traffic densities. For instance, despite the highest GNI of the cohort, Nigeria accounted with one of the lowest traffic densities. It must be noted, though, that the data found for the country is outdated and thus must be taken carefully. In fact, data currency, transparency, and availability remains one of the main challenges in the research concerning low-income countries in Sub-Saharan Africa. Most countries have not published data on transport stock nor traffic volumes for many years. In some cases, data is fragmented, and only a few countries have published data clearly and consistently. Moreover, only Ethiopia has published data regarding its SGR line. To counteract the lack of data, a qualitative scenario analysis was conducting where four main scenarios were explored. Scenarios were chosen to represent the range between the desirable, the possible, the probable, and the avoidable. Each was given a name to represent their main idea, namely African Vision, Renewed Links, Private Railways, and Forgotten Tracks. In each, not only changes in traffic volumes were considered, but also in five other themes: Technology Adoption, Environmental Impacts, Financial Viability, Governance, and Social Benefits. As logically expected, more positive scenarios that explore a certain improvement from the current state see correlated growth in most or all markers. Conversely, more negative trajectories result from either disparate movement between domains, or a combined downfall vicious circle that leads to a complete halt in traffic apart from a few lines. Overall, this traffic report analysis has found some recent updates in terms of infrastructure but fewer changes in the data available. Direct contact with members of staff of operating companies was helpful but 39 TRAFFIC VOLUME REPORT - Novel traction systems for sustainable railway futures in LICs not sufficient. Given the state of the infrastructure that remains mostly unchanged apart from the new SGR lines, low traffic volumes are not surprising. The lack of information was also observed regarding current and future projects. This prevented the research team to conduct refined analysis and produce forecasts appropriately. Affordability is still one of the main concerns for new projects, and even the new lines are now facing challenges to repay the loans. Therefore, it is argued that the following stages of the project must take cost as one of the main requirements for traction solutions in low-income countries in Sub-Saharan Africa. With that, the availability of new forms of fuel (i.e. Hydrogen) must be taken into consideration, similarly to the increasing social costs of carbon emissions of lower emission fuels. 40 TRAFFIC VOLUME REPORT - Novel traction systems for sustainable railway futures in LICs 6. References 1. United Nations Department Of Economic and Social Affairs Statistics Division. Standard country or area codes for statistical use. New York : United Nations, 1999. 2. World Bank. World Bank country and lending groups. [Online] 01 01 2021. [Cited: 01 02 2021.] https://datahelpdesk.worldbank.org/knowledgebase/articles/906519-world-bank-country-and-lendinggroups. 3. United Nations Development Programme. Latest Human Development Index Ranking. [Online] [Cited: 01 02 2021.] http://hdr.undp.org/en/content/latest-human-development-index-ranking. 4. CIA. The World Factbook. [Online] https://www.cia.gov/the-world-factbook/. 5. World Bank. GNI per capita, Atlas method (current US$). [Online] 2020. [Cited: 13 01 2020.] https://data.worldbank.org/indicator/NY.GNP.PCAP.CD. 6. United Nations Development Programme. Latest Human Development Index Ranking. [Online] 2020. [Cited: 13 01 2020.] http://hdr.undp.org/en/content/latest-human-development-index-ranking. 7. International Union of Railways. RAIL-ISA UIC Statistics. [Online] 2020. [Cited: 15 01 2020.] https://uicstats.uic.org/. 8. Blumenfeld, Marcelo, et al. Developing a New Technical Strategy for Rail Infrastructure in Low-Income Countries in Sub-Saharan Africa and South Asia. Sustainability. 2019, Vol. 11, 16. 9. Bullock, R. Off track: SSA railways. Washington, D.C. : World Bank, 2009. 10. African Development Bank. Rail infrastructure in Africa: financing policy options. Abidjan : African Development Bank, 2015. 11. Olievschi, V N. Railway transport: framework for improving railway sector performance in SSA. Washington, D.C. : World Bank, 2013. 12. World Bank. Africa Infrastructure: Railways. [Online] 31 12 2009. [Cited: 01 02 2020.] https://databank.worldbank.org/source/africa-infrastructure:-railways. 13. Railways, passengers carried (million passenger-km). [Online] [Cited: 08 02 2021.] https://data.worldbank.org/indicator/IS.RRS.PASG.KM. 14. Railways, goods transported (million ton-km). [Online] [Cited: 08 02 2021.] https://data.worldbank.org/indicator/IS.RRS.GOOD.MT.K6. 15. African Union. Agenda 2063: The Africa We Want. Addis Ababa : African Union, 2013. 16. The hottest projects in Ethiopia and what is being done to open for investments. Delelegn, Mebratu. Nairobi, Kenya : s.n., 2018. East Africa Rail Conference. 17. BBC. Kenya opens Nairobi-Mombasa Madaraka Express railway. BBC. [Online] 31 May 2017. [Cited: 20 02 2021.] https://www.bbc.co.uk/news/world-africa-40092600. 18. Bouraima, Mouhamed Bayane and Yanjun, Qiu. Past, present and future development of West African railways. Journal of Sustainable Development of Transport and Logistics. 2020, Vol. 5, 1, pp. 103-114. 19. Railway Gazette. Côte d'Ivoire – Burkina Faso railway upgrade agreement. [Online] 12 08 2019. [Cited: 07 02 2021.] https://www.railwaygazette.com/infrastructure/cote-divoire-burkina-faso-railway-upgradeagreement/54339.article. 20. Railway Technology. Ethiopia-Djibouti Railway Line Modernisation. [Online] [Cited: 11 02 2021.] https://www.railway-technology.com/projects/ethiopia-djibouti-railway-line-modernisation/. 21. Railway Gazette. Addis Ababa – Khartoum railway study funded. [Online] 10 06 2020. [Cited: 11 02 2021.] https://www.railwaygazette.com/infrastructure/addis-ababa-khartoum-railway-study-funded/56722.article. 22. Liberian railway could carry iron ore from Guinea. [Online] 06 05 2019. [Cited: 08 02 2021.] https://www.railwaygazette.com/freight/liberian-railway-could-carry-iron-ore-from-guinea/48423.article. 41 TRAFFIC VOLUME REPORT - Novel traction systems for sustainable railway futures in LICs 23. Railway Technology. Mota-Engil commences work on $1.8bn linking Nigeria-Niger railway line. [Online] 10 02 2021. [Cited: 10 02 2021.] https://www.railway-technology.com/news/mota-engil-nigeria-niger-railwayline/. 24. Railway Gazette. Nigerian railway construction agreement signed. [Online] 31 10 2019. [Cited: 10 02 2021.] https://www.railwaygazette.com/infrastructure/nigerian-railway-construction-agreementsigned/54925.article. 25. Construction of Nigerian rolling stock factory begins. [Online] 11 11 2019. [Cited: 10 02 2021.] https://www.railwaygazette.com/business/construction-of-nigerian-rolling-stock-factorybegins/55094.article. 26. Chinese companies awarded Mwanza – Isaka standard gauge contract. [Online] 11 01 2021. [Cited: 10 02 2021.] https://www.railwaygazette.com/infrastructure/chinese-companies-awarded-mwanza-isaka-standardgauge-contract/58213.article. 27. Togo railway plan. [Online] 22 03 2019. [Cited: 10 02 2021.] https://www.railwaygazette.com/infrastructure/togo-railway-plan/48210.article. 28. Uganda rail revival funding agreed. [Online] 25 10 2018. [Cited: 10 02 2021.] https://www.railwaygazette.com/infrastructure/uganda-rail-revival-funding-agreed/47419.article. 29. World Bank. GDP growth (annual %) - Sub-Saharan Africa. [Online] 01 01 2021. [Cited: 01 04 2021.] https://data.worldbank.org/indicator/NY.GDP.MKTP.KD.ZG?end=2019&locations=ZG&start=2010. 30. UNECE. Transport for Sustainable Development: The case of inland transport. Geneva : United Nations Economic Commission for Europe, 2015. 31. Fouquet, Roger. Trends in income and price elasticities of transport demand (1850–2010). Energy Policy. 2012, Vol. 50. 32. Tsekeris, Theodore and Tsekeris, Charalambos. Demand Forecasting in Transport: Overview and Modeling Advances. Economic Research-Ekonomska Istraživanja. 2011, Vol. 24, 1, pp. 82-94. 33. Mureithi, Carlos. Kenya’s expensive Chinese-built railway is racking up losses even as loans come due. [Online] 09 October 2020. [Cited: 10 April 2021.] https://qz.com/africa/1915399/kenyas-chinese-built-sgrrailway-racks-up-losses-as-loans-due/. 34. Chen, Yunnan. Ethiopia and Kenya are struggling to manage debt for their Chinese-built railways. Quartz Africa. [Online] 04 June 2019. [Cited: 10 April 2021.] https://qz.com/africa/1634659/ethiopia-kenya-strugglewith-chinese-debt-over-sgr-railways/. 35. Miriri, Duncan. Kenya forcing importers to use costly new Chinese railway, businessmen say. Reuters. [Online] 03 December 2019. [Cited: 10 April 2021.] https://www.reuters.com/article/us-kenya-railwaysidUSKBN1Y70LT. 36. Economies of density in rail freight transport: potential for utilisation in Southern Africa. Pienaar, W J, de Bod, A and Havenga, J H. 3, s.l. : Journal of Governance and Regulation, 2012, Vol. 1, pp. 44-49. 37. Freight transport under globalisation and its impact on Africa. Pedersen, Paul Ove. 2, s.l. : Journal of Transport Geography, 2001, Vol. 9, pp. 85-99. 38. Fourie, Johan and Herranz-Loncan, Alfonso. Growth (and Segregation) by Rail: How the Railways Shaped Colonial South Africa. Cape Town : Economic Research Southern Africa, 2015. 39. A review and analysis of railway transportation system in the economic community of West African States: Towards the development of sustainable regional goal. Bayane, Bouraima Mouhamed, Yanjun, Qiu and Bekhzad, Yusupov. 02, s.l. : Global Journal of Engineering and Technology Advances, 2020, Vol. 02, pp. 11-22. 40. OECD. Africa's Urbanisation Dynamics 2020: Africapolis, Mapping a New Urban Geography. Paris : OECD Publishing, 2020. 42 TRAFFIC VOLUME REPORT - Novel traction systems for sustainable railway futures in LICs 41. Burroughs, David. International Railway Journal. [Online] 19 May 2021. [Cited: 26 May 2021.] https://www.railjournal.com/financial/ugandan-parliament-approves-e327m-kampala-malaba-linerefurbishment/. 42. Teravaninthorn, Supee and Raballand, Gael. Transport Prices and Costs in Africa: A Review of the Main International Corridors. Washington, D.C. : World Bank, 2009. 43. World Bank. Africa’s Infrastructure: a time for transformation. Washington, DC : World Bank, 2010. 44. Atsushi, Iimi, Humphreys, Richard Martin and Mchomvu, Yonas Eliesikia. Rail Transport and Firm Productivity: evidence from Tanzania. Washington, DC : World Bank, 2017. 45. World Bank. The economics of Rail Gauge on the East African Commmunity. Washington, DC : World Bank, 2013. 46. Oirere, Shem. Kenyan court quashes mandatory use of SGR for freight. Quartz Africa. [Online] 25 November 2020. [Cited: 12 July 2021.] https://www.railjournal.com/africa/kenyan-court-quashes-mandatoryuse-of-sgr-for-freight/. 47. Gallopin, G A, et al. Branch points: global scenarios and human choice. Stockholm : Stockholm Environment Institute, 1997. 48. CPCS. Detailed Scoping Study (DSS) for Vision 2063 Africa Integrated High Speed Railway Network and Masterplan. Ottawa : CPCS, 2019. 49. Bollore Logistics. Registration document . Paris : Bollore, 2018. 50. Arcelor Mittal. Railway – back on track. [Online] [Cited: 09 02 2021.] https://liberia.arcelormittal.com/what-we-do/rail.aspx. 51. MADARAIL. A propos de Madarail. [Online] [Cited: 09 02 2021.] http://www.madarail.mg/a_propos_activites.php. 52. Portos e Caminhos de Ferro de Mocambique. Annual statistical information 2019. Maputo : CFM, 2019. Birmingham Centre for Railway Research and Education University of Birmingham Edgbaston, Birmingham B15 2TT, United Kingdom Tel: +44(0) 121 414 2626 Email: m.blumenfeld@bham.ac.uk Web: www.birmingham.ac.uk/research/railway/index.aspx