
Overview
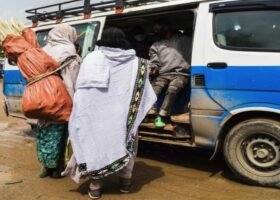
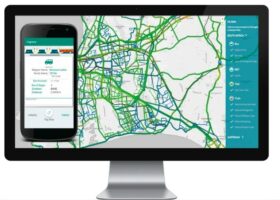
The key objective of the Africa Urban Mobility Observatory (AUMO) research project is to promote inclusive, lowcarbon mobility in African Low-Income Country (LIC) cities, by piloting Big Data applications to generate data, benchmark performance, and draw policy insights in six African cities. These insights will be used to develop Action Plans in two of these cities, and catalyse broader uptake via a Web Data Platform, workshops, and research.
Publications with the same themes

Publications with the same study countries

Related news & events

Podcast

Blog
PDF content (text-only)
Big Data to Enable Inclusive, Low-Carbon Mobility Africa Urban Mobility Observatory Role of Informal Paratransit Report October 2021 Africa Urban Mobility Observatory/40001 HVT042 - GoMetro This research was funded by UKAID through the UK Foreign, Commonwealth and Development Office under the High Volume Transport Applied Research Programme, managed by IMC Worldwide. The views expressed in this report do not necessarily reflect the UK government’s official policies. Reference No. HVT/042 Lead Organisation/ Consultant GoMetro (PTY) LTD Partner Organisation(s)/ Consultant(s) UN-Habitat, Wuppertal Institute, UEMI Title HVT Africa Urban Mobility Observatory – Role of Informal Paratransit Report Type of document Project Report Theme Climate change Sub-theme Urban Transport Author(s) Claudia Visagie; Philip Krause; Nigel Zhuwaki; Donna Schulenburg Lead contact Philip Krause Geographical Location(s) Malawi, Botswana, Rwanda, DR Congo, Nigeria, Lesotho Abstract The key objective of the Africa Urban Mobility Observatory (AUMO) research project is to promote inclusive, lowcarbon mobility in African Low-Income Country (LIC) cities, by piloting Big Data applications to generate data, benchmark performance, and draw policy insights in six African cities. These insights will be used to develop Action Plans in two of these cities, and catalyse broader uptake via a Web Data Platform, workshops, and research. Keywords Informal Paratransit; Minibus Taxi; Sedan Taxi; Motorcycle Taxi; Tricycle Taxi; Low Income Country; Inclusivity; Mobility; Big Data; Transport Policy Funding UKAid/ FCDO Acknowledgements Issue Status Author(s) Reviewed By Approved By Issue Date 1 Draft Claudia Visagie; Philip Krause Marius Pretorius, Justin Coetzee - 11th September 2021 2 Draft Claudia Visagie; Philip Krause Gail Jennings - 20th September 2021 3 Final Draft Claudia Visagie; Philip Krause Marius Pretorius Justin Coetzee 30th September 2021 4.1 Final Release Claudia Visagie; Philip Krause Marius Pretorius Justin Coetzee 25th October 2021 4.2 Final Release (Revised) Claudia Visagie; Philip Krause Marius Pretorius Justin Coetzee 3 rd November 2021 i AFRICA URBAN MOBILITY OBSERVATORY – ROLE OF INFORMAL PARATRANSIT REPORT CONTENTS Executive Summary xv 1. Introduction 1 1.1 Report objectives 1 1.2 Report structure 1 1.3 Research background and objectives 2 1.4 Project activity streams and deliverables overview 2 1.5 Project systems elements 3 2. Contextualisation 5 2.1 Informal paratransit 5 2.2 Transport emissions 6 3. Methodology 9 3.1 Desktop Research 9 3.2 Stakeholder engagements 9 3.3 Africa Urban Mobility Observatory Data 9 4. Blantyre findings 11 4.1 City overview 11 4.2 Urban transport services overview 12 4.3 Regulatory and lobbying environment 14 4.4 Informal paratransit services analysis 15 4.5 AUMO data analysis 18 5. Gaborone Findings 23 5.1 City Overview 23 5.2 Urban transport services overview 23 5.3 Regulatory and lobbying environment 26 5.4 Informal paratransit services analysis 27 5.5 AUMO data analysis 30 6. Kigali findings 35 6.1 City overview 35 6.2 Urban transport services overview 36 6.3 Regulatory and lobbying environment 39 6.4 Informal paratransit services analysis 40 6.5 AUMO data analysis 45 7. Kinshasa findings 50 7.1 City overview 50 7.2 Urban transport services overview 51 7.3 Regulatory and lobbying environment 53 7.4 Informal paratransit services analysis 54 7.5 AUMO data analysis 57 8. Lagos findings 62 8.1 City overview 62 8.2 Urban transport services overview 62 ii AFRICA URBAN MOBILITY OBSERVATORY – ROLE OF INFORMAL PARATRANSIT REPORT 8.3 Regulatory and lobbying environment 66 8.4 Informal paratransit services analysis 68 8.5 AUMO data analysis 72 9. Maseru findings 76 9.1 City overview 76 9.2 Urban transport services overview 76 9.3 Regulatory and lobbying environment 79 9.4 Informal paratransit services analysis 81 9.5 AUMO data analysis 84 10. Discussion 89 10.1 Strengths and weaknesses associated with informal paratransit 89 10.2 Factors affecting informal paratransit vehicle emissions 90 10.3 Approaches to informal paratransit reform 90 10.4 Informal paratransit reform case study cities 92 10.5 Informal paratransit reform opportunities 94 11. Conclusion 101 12. References 103 APPENDICES Appendix A: Stakeholder Questionnaire 112 Appendix B: Intercept Survey Questionnaire (Lagos) 113 TABLES Table 1: Informal paratransit assessment..............................................................................................................x Table 2: Project deliverables per activity stream.................................................................................................. 2 Table 3: AUMO data points................................................................................................................................... 9 Table 4: Passenger transport modes in Blantyre................................................................................................. 12 Table 5: Passenger Transport Modes in Gaborone ............................................................................................. 24 Table 6: Passenger transport modes in Kigali...................................................................................................... 36 Table 7: Passenger transport modes in Kinshasa ................................................................................................ 51 Table 8: passenger transport modes in Lagos..................................................................................................... 63 Table 9 – Passenger transport modes in Maseru................................................................................................ 77 FIGURES Figure 1: Report structure 1 Figure 2: Research activity flow 2 Figure 3: GoMetro Africa Urban Mobility Observatory technology stack 3 Figure 4: Typical informal paratransit bicycle (left) and motorcycle taxis (right) (39) (38) 5 iii AFRICA URBAN MOBILITY OBSERVATORY – ROLE OF INFORMAL PARATRANSIT REPORT Figure 5: Typical informal paratransit tricycle taxis (84) 5 Figure 6: Typical informal paratransit sedan taxis 5 Figure 7: Typical informal paratransit minibuses taxi 6 Figure 8: Global transport CO2 emissions by mode (82) 6 Figure 9: Fossil fuel subsidy reform (82) 7 Figure 10: Petrol passenger vehicle NOx emissions by mileage and age (87) 8 Figure 11: Diesel passenger vehicle NOx emissions by mileage and age (87) 8 Figure 12: Diesel and petrol passenger vehicle CO emissions by mileage (88) 8 Figure 13: Blantyre location (89) 11 Figure 14: Informal settlement in Blantyre (9) 12 Figure 15: Blantyre transport modal split (90) 12 Figure 16: Malawi CO2 emissions (tons) over 40 years (92) 13 Figure 17: Informal paratransit vehicles in Blantyre: minibus taxis, sedan taxis, bicycle taxis and motorcycle taxis 16 Figure 18: Makeshift rank in Blantyre (7) 16 Figure 19: Blantyre mode share by income level 18 Figure 20: Blantyre travel time by gender 19 Figure 21: Blantyre travel time by mode 19 Figure 22: Blantyre crime on public and informal paratransit (90) 20 Figure 23: Blantyre public and informal paratransit driver behaviour (90) 20 Figure 24: Blantyre public and informal paratransit comfort (90) 21 Figure 25: Blantyre public and informal paratransit reliability (90) 21 Figure 26: Blantyre public and informal paratransit sexual harassment (90) 22 Figure 27: Gaborone location (89) 23 Figure 28: Gaborone transport modal split (90) 24 Figure 29: Botswana CO2 emissions (tons) over 40 years (92) 25 Figure 30: Informal paratransit vehicles in Gaborone: minibus taxis (left) and sedan taxis (right) 27 Figure 31: Bus stops in Gaborone (79) 28 Figure 32: Minibus taxi network in Gaborone (29) 29 Figure 33: Sedan (4+1) taxi network in Gaborone (29) 30 Figure 34: Gaborone mode share by income level 31 Figure 35: Gaborone travel time by gender 31 Figure 36: Gaborone travel time by mode 31 Figure 37: Gaborone crime on public and informal paratransit (90) 32 Figure 38: Gaborone public and informal paratransit driver behaviour (90) 32 Figure 39: Gaborone public and informal paratransit comfort (90) 33 Figure 40: Gaborone public and informal paratransit reliability (90) 33 iv AFRICA URBAN MOBILITY OBSERVATORY – ROLE OF INFORMAL PARATRANSIT REPORT Figure 41: Gaborone public and informal paratransit sexual harassment (90) 34 Figure 42: Kigali location (89) 35 Figure 43: Kigali’s hilly terrain (38) 36 Figure 44: Kigali transport modal split (90) 36 Figure 45: Rwanda CO2 emissions (tons) over 40 years (92) 37 Figure 46: Informal paratransit modes in Kigali: bicycle and motorcycle taxis (39) and (38) 41 Figure 47: Kigali bus routes and terminals (42) 42 Figure 48: E-Ticketing system in Kigali (39) 42 Figure 49: Reformed bus services stakeholders (42) 43 Figure 50: KBS 10.5m bus in Kigali (38) 43 Figure 51: Royal Express midi-buses in Kigali (39) (38) 44 Figure 52: Jali Transport midi-buses in Kigali (102) 44 Figure 53: Bus lay-by in Kigali (102) 44 Figure 54: Kigali mode share by income level 46 Figure 55: Kigali travel time by gender 46 Figure 56: Kigali travel time by mode 46 Figure 57: Kigali crime on public and informal paratransit (90) 47 Figure 58: Kigali public and informal paratransit driver behaviour (90) 47 Figure 59: Kigali public and informal paratransit comfort (90) 48 Figure 60: Kigali public and informal paratransit reliability (90) 48 Figure 61: Kigali public and informal paratransit sexual harassment (90) 49 Figure 62: Kinshasa location (89) 50 Figure 63: Kinshasa transport modal split (90) 51 Figure 64: DRC CO2 emissions (tons) over 40 years (92) 52 Figure 65: Indicative road in Kinshasa (51) 55 Figure 66: Example bus stop in Kinshasa (51) 55 Figure 67: Minibus taxi (Esprit de Mort) in Kinshasa (120) 56 Figure 68: Sedan taxis (Juana) in Kinshasa (121) 57 Figure 69: Motorcycle taxi (Wewa) in Kinshasa (123) 57 Figure 70: Kinshasa mode share by income level 58 Figure 71: Kinshasa travel time by gender 58 Figure 72: Kinshasa travel time by mode 59 Figure 73: Kinshasa crime on public and informal paratransit (90) 59 Figure 74: Kinshasa public and informal paratransit driver behaviour (90) 60 Figure 75: Kinshasa public and informal paratransit comfort (90) 60 Figure 76: Kinshasa public and informal paratransit reliability (90) 61 Figure 77: Kinshasa public and informal paratransit sexual harassment (90) 61 v AFRICA URBAN MOBILITY OBSERVATORY – ROLE OF INFORMAL PARATRANSIT REPORT Figure 78: Lagos location (89) 62 Figure 79: Lagos transport modal split (90) 63 Figure 80: BRT in Lagos (59) 64 Figure 81: Nigeria CO2 emissions (tons) over 40 years (92) 64 Figure 82: Emissions per sector in Lagos, 2015 (60) 65 Figure 83: Transport emissions in Lagos by end user and fuel type, 2015 (60) 65 Figure 84: Informal paratransit modes in Lagos: midi and minibus taxis, sedan taxis, tricycle taxis and motorcycle taxis 69 Figure 85: Microbus taxis in Lagos (63) 69 Figure 86: Minibus taxis congest the main road in Lagos (59) 69 Figure 87: Informal paratransit facilities in Lagos (63) 70 Figure 88: Lagos mode share by income level 72 Figure 89: Lagos travel time by gender 72 Figure 90: Lagos travel time by mode 73 Figure 91: Lagos crime on public and informal paratransit (AUMO survey data – occurrence) 73 Figure 92: Lagos public and informal paratransit driver behaviour (AUMO survey data) 74 Figure 93: Lagos public and informal paratransit comfort (AUMO survey data) 74 Figure 94: Lagos public and informal paratransit reliability (AUMO survey data) 75 Figure 95: Lagos public and informal paratransit sexual harassment (AUMO survey data – occurrence) 75 Figure 96: Map of Lesotho (127) 76 Figure 97: Maseru transport modal split (90) 76 Figure 98: Lesotho CO2 emissions (tons) over 40 years (92) 78 Figure 99: Lesotho energy sector CO2 emissions (disaggregated by sector): 2011 – 2017 (71) 78 Figure 100: Lesotho road transport CO2 emissions (disaggregated by vehicle type): 2011 – 2017 (71) 78 Figure 101: Informal paratransit modes in Maseru: minibus and sedan taxis (29) 81 Figure 102: Example of long queues in Maseru (70) 81 Figure 103: Minibus taxi network in Maseru (29) 83 Figure 104: Sedan taxi (4+1) network in Maseru (29) 84 Figure 105: Maseru mode share by income level 84 Figure 106: Maseru travel time by gender 85 Figure 107: Maseru travel time by mode 85 Figure 108: Maseru crime on public and informal paratransit (90) 86 Figure 109: Maseru public and informal paratransit driver behaviour (90) 86 Figure 110: Maseru public and informal paratransit comfort (90) 87 Figure 111: Maseru public and informal paratransit reliability (90) 87 Figure 112: Maseru public and informal paratransit sexual harassment (90) 88 Figure 113: Lagos informal paratransit reform strategy (60) 93 i AFRICA URBAN MOBILITY OBSERVATORY – ROLE OF INFORMAL PARATRANSIT REPORT ACRONYMS ACCO Association of Public Transport Vehicles Owners (Association des Propriétaires de Véhicules Affectés au Transport en Commun) AFC Automated Fare Collection AFD French Development Agency (Agence Française de Développement) ANIPTMC National Association of Owners of Motorcycle Taxies of the Congo APVC Public Transport Vehicles Owners (Association des Chauffeurs du Congo) AUMO Africa Urban Mobility Observatory BBOAM Big Bus Owners Association of Malawi BOBOA Botswana Bus Operators Association BRI Bus Reform Initiative BRT Bus Rapid Transit CBD Central Business District CNPR National Commission for Road Safety (Commission Nationale de la Prévention Routière) CO Carbon Monoxide CO2e Carbon Dioxide Equivalent CoK City of Kigali COMESA Common Market for Eastern and Southern Africa CONADEP Commission Nationale de Délivrance des Permis de Conduire DGI Direction Générale des Impôts DR Department of Roads DRC Democratic Republic of the Congo DRTS Department of Road Transport and Safety (Botswana) DSCRP Growth and Poverty Reduction Strategy Paper (Document de la Stratégie de Croissance et de Réduction de la Pauvreté) DSRP Poverty Reduction Strategy Paper (Documents de Stratégie pour la Réduction de la Pauvreté) EVs Electric Vehicles ii AFRICA URBAN MOBILITY OBSERVATORY – ROLE OF INFORMAL PARATRANSIT REPORT FERMA Federal Roads Maintenance Agency FESART Federation of East and Southern African Road Transport Associations FLM First- and Last-Mile GCC Gaborone City Council GoB Government of Botswana GRDP Gross Regional Domestic Product HOV High Occupancy Vehicle HVT High Volume Transport ICE Internal Combustion Engine KBS Kigali Bus Service KCMP Kigali Conceptual Master Plan LAMATA Lagos Metropolitan Area Transport Authority LASTMA Lagos State Traffic Management Authority LBS Location Based Service LBSL Lagos Bus Services Limited LEMP Low-End Mobile Phone LIC Low-Income Country LMTS Lagos Mass Transit Study LNDC Lesotho National Development Corporation LNHDC Lesotho National Housing Development Corporation LRMT Lagos Rail Mass Transit LSG Lagos State Government LSPP Department of Lands, Surveys and Physical Planning (Lesotho) LSWA Lagos State Waterways Authority LULUCF Land Use, Land-Use Change and Forestry LUTP Lagos Urban Transport Project MCC Maseru City Council iii AFRICA URBAN MOBILITY OBSERVATORY – ROLE OF INFORMAL PARATRANSIT REPORT MDP Maseru Development Plan MFEP Ministry of Finance and Economic Planning (Botswana) MGDS Malawi Growth and Development Strategy MINALOC Ministry of Local Government MININFRA Ministry of Infrastructure MOAM Minibus Owners Association of Malawi MoPW&T Ministry of Public Works and Transport (Lesotho) MoTE Ministry of Tertiary Education, Research, Science and Technology of Botswana MoTPW Ministry of Transport and Public Works of Malawi MPV Multi-Purpose Vehicle MRTO Maseru Regional Taxi Association MT&C Ministry of Transport and Communications MUP&T Maseru Urban Planning and Transport Study NH3 Ammonia Compounds NMT Non-Motorised Transport NMVOC Non-Methane Volatile Organic Compounds NOx Oxides of Nitrogen NTMP National Transport Master Plan NURTW National Union of Road Transport Workers O-D Origin-Destination Pair ONATRA Office National of Transport OS Operating System PaaS Platform as a Service PAG Programme d'Appui à la Gouvernance PDNIT National Integrated Transport Master Plan (Le Plan Directeur National Intégré des Transports) PHEVs Plug-in Hybrid Electric Vehicles iv AFRICA URBAN MOBILITY OBSERVATORY – ROLE OF INFORMAL PARATRANSIT REPORT PM Particulate Matter PNSD National Strategic Development Plan (Plan National Stratégique de Développement) PRSP Poverty Reduction Strategy Paper QA Quality Assurance RA Roads Authority RALGA Rwandan Association of Local Government Authorities RCA Rwanda Cooperative Agency RDS Relational Database Service REMA Rwanda Environment Management Authority RFP Request for Proposal RFTC Rwanda Federation Transport Cooperatives RMF Road Maintenance Fund RSP Road Sector Programme RTDA Rwanda Transport Development Agency RTEAN Road Transport Employers Association of Nigeria RTOA Road Transport Operators Association RURA Rwanda Utilities Regulatory Authority SADC Southern African Development Community SCTP Commercial Society of Transport and Ports (Société Commerciale des Transports et des Ports) SDF Spatial Development Framework SDG Sustainable Development Goals SKD Semi-Knocked Down (Vehicle assembly kit) SMS Short Message Service SONAS Société Nationale d’Assurances SOSAK Strategic Orientation Scheme for the Kinshasa Metropolitan Area (Schéma d'Orientation Stratégique de l'Agglomération Kinoise) SOx Oxides of Sulphur v AFRICA URBAN MOBILITY OBSERVATORY – ROLE OF INFORMAL PARATRANSIT REPORT STMP Strategic Transport Master Plan STUC Société des Transports Urbain du Congo SuM4All Sustainable Mobility for All TAZ Traffic Analysis Zone TLS Transport Layer Security TMP Transport Master Plan TRANSCO Transport of Congo / Transport au Congo TSIP Transport Sector Investment Programme UEMI Urban Electric Mobility Initiative UITP International Association of Public Transport UMA User Movement Analytics UN United Nations UNDP United Nations Development Programme USSD Unstructured Supplementary Service Data UUID Universally Unique Identifier UX User Experience VKT Vehicle Kilometres Travelled VPC Virtual Private Cloud VPS Virtual Private Server 2G Second Generation Cellular Network 3G Third Generation Cellular Network 4G Fourth Generation Cellular Network 5G Fifth Generation Cellular Network vi AFRICA URBAN MOBILITY OBSERVATORY – ROLE OF INFORMAL PARATRANSIT REPORT Glossary of Terms/ Definitions Analysis City City under analysis, which represents the summarisation of the many defined zones during the sampling process. Area-Based Service An informal paratransit service which operates anywhere within a specific area (as opposed to a route-based service). Attribute Parameterisable characteristics that are used to disaggregate results, and able to be filtered by clusters of Users (based on their characteristics). Big Data Application The servers and services which host and enable management of the Observatory Platform. Bucket Clusters of Users that share the same combination of attributes. Indicators would be disaggregated by these attributes (income, gender, purpose, and geographical zone) and cross-tabulated with mode when appropriate. Candidate A User who is considered eligible by UMA for being tracked. To become a “Candidateâ€, a User must have granted permissions to the partner app and satisfy some required characteristics. Once a User becomes a “Candidateâ€, they may become a “Participantâ€, and be activated in the UMA SDK based on specified conditions. Commission Model Under the commission model, drivers’ remuneration is a percentage of the daily fare revenue. Fill-and-go A typical business model in which informal paratransit vehicles queue at a rank, and only depart once they have filled the vehicle to capacity with passengers. Fixed-Wage Model A less common informal paratransit business model, in which vehicle drivers are paid a fixed wage, regardless of revenue generated each day. All daily earnings are handed over to the vehicle owner/operator, who is typically responsible for the cost of fuel, and if applicable, conductors’ wages and terminal fees. Gender Attribute: Gender is disaggregated into three categories, “Maleâ€, “Femaleâ€, and “Non-Binaryâ€. GraphQL Programming Language HVT City City eligible for consideration under the HVT research programme. Income Range Attribute: Split into quintiles of income. Installation Act of installing a partner app and generating the associated UUIDs Informal Paratransit Privately operated commercial urban transport services. Location Initial User’s location gathered by the coarse/lightweight background location. vii AFRICA URBAN MOBILITY OBSERVATORY – ROLE OF INFORMAL PARATRANSIT REPORT Mobile Device Mobile device hardware. Observatory Platform The mobility data management and visualisation platform, comprising the Big Data Application, and the Web Data Platform. Paratransit In context of this report: privately operated commercial urban transport services, which often supplement fixed route public transport services (used interchangeably with Informal Transport). Participant User who has become eligible for being tracked based on their scoring, and whose data (once they have been tracked) is going to be used in the process of estimating the indicators. Partner App App with which we are partnering by integrating UMA SDK. Research City City in which the Africa Urban Mobility Observatory will be performing mobility data collection, for inclusion in the Observatory Platform. Respondent An individual who participates in any of the interactive surveys. Route-Based Service An informal paratransit service which is aligned with a pre-determined route (the service may deviate from the planned route, but typically returns to the planned route shortly after deviating). Semi-Knocked Down (Vehicle Assembly Kit) A kit of weldments, sub-assemblies, and components, typically imported to reduce shipping volume, which is used to assemble vehicles locally, sometimes in conjunction with locally sourced components. Target Model A common informal paratransit business model, in which vehicle drivers are assigned a daily revenue target by the operator, who then remunerate the drivers based on the difference between the set target and the actual earnings each day. Typically, drivers are responsible for the cost of fuel, and if applicable, conductors’ wages and terminal fees. Trip One-way movement from one place to another, to achieve a specific purpose. Each trip has an origin, a destination, and a single main purpose – which is the reason for making the trip. It represents the summarisation of legs or journey stages. Trip Leg Journey stages, defined as sub-divisions of an individual trip, reflecting the successive use of different vehicles or transport modes during a trip. User For the purposes of this research, we define Users as the subset of the database who have downloaded an updated partner application in which UMA has been integrated. User Movement Analytics A digital solution that allows passive observation of phone telemetry data, gathering trip diaries and matching those with digital survey responses. This solution is integrated with partner/host apps. Virtual Private Server Hosting on a shared server, which mimics that of a dedicated server environment. viii AFRICA URBAN MOBILITY OBSERVATORY – ROLE OF INFORMAL PARATRANSIT REPORT Web Data Platform The mobility data visualisation component of the Observatory Platform. Zone The smallest polygon within a city that we define in terms of clustering Users and represents a parameter on which tracking definitions and schedules are based. ix AFRICA URBAN MOBILITY OBSERVATORY – ROLE OF INFORMAL PARATRANSIT REPORT EXECUTIVE SUMMARY The primary objectives of this report are to identify and evaluate the informal paratransit services operating in the six research cities, to understand their operating models, to establish the roles these services play in supporting mobility, to reveal the experiences of travellers using these services, and to understand the contribution of passenger transport towards CO2 emissions. In addition, this report aims to identify possible informal paratransit reform strategies which could improve levels of service, reduce fuel consumption and CO2 emissions, and improve operational sustainability. Methodology To understand the cities specific contexts, and to develop knowledge baselines on the extent and nature of informal paratransit operations, the corresponding regulatory environments, and the environmental impact of passenger transport services in the six research cities, desktop research was conducted. Source materials reviewed included legislation, transport policies and improvement plans, census data, and various transport related reports published by NGOs and consulting firms across the region, including those of GoMetro. To close knowledge gaps remaining after the desktop research was concluded, a series of stakeholder engagements was conducted. A questionnaire informed by the gaps identified was produced, tailored for each city, and then sent to various stakeholders in the cities. Where possible, stakeholders were interviewed via virtual meetings, while others responded in writing. The questionnaire template can be found in Appendix A: . Data from the Africa Urban Mobility Observatory Web Data Platform (presented in Deliverable 3: Web Data Platform, submitted on 26 February 2021), was used to draw insights into mobility patterns and passenger experiences of respondents to the AUMO intercept surveys. It is important to note that at the time of compilation of this report, only Face-to-Face intercept survey data was available, and as a result, the sample size and distribution is insufficient to draw approximations applicable to mobility patterns and experiences of the entire population across each city. Summary of informal paratransit operations findings For a summary of findings of the various informal paratransit modes operating in the six cities, refer to Table 1. x AFRICA URBAN MOBILITY OBSERVATORY – ROLE OF INFORMAL PARATRANSIT REPORT Table 1: Informal paratransit assessment Category Blantyre Gaborone Kigali Kinshasa Lagos Maseru Minibus Taxi Mode Share Official mode share: unknown. Official mode share: 96%. Oversupply results in poor fleet utilisation. Estimated fleet size of 2,200. N/A Official mode share: 33%. Estimated fleet size of 1,200. Official mode share: 60%. Estimated fleet size of 75,000 (including diminishing midi-bus taxis). Official mode share: 74% (2011). Supply Operate within a 150 km radius of city centre. However, limited reach in wider urban area and certain residential areas. Licence regime fails to balance supply with demand. Operate fixed routes mostly within 10 km radius of city centre. Average trip length is 8 km. Unscheduled service. Specialise in shortdistance trips. Unscheduled service. Specialise in longer distance trips on highways and outlying areas. However, taxi associations can restrict access to routes. Fixed routes. Mostly operate in town centres and surrounding villages. Facilities Travel between informal paratransit ranks, most of which are makeshift. Travel between formal bus terminals (ranks) and bus stops. Travel between formal public transport terminals and bus stops. Travel between formal public transport terminals and bus stops. Travel between informal paratransit ranks (peak) and neighbouring suburbs (off-peak). Model Typically target-based business model. Typically target-based business model. Typically target-based business model. Typically target-based business model. Commission and target-based business models. Ticket Cash only, with no tickets or receipts. Cash only, with no tickets or receipts. Cash only, with no tickets or receipts. Cash only, with no tickets or receipts. Cash only, with no tickets or receipts. Fare Predominantly distance-based fare, unregulated. Flat fare irrespective of trip length, regulated by DRTS. Distance or demand-based fare, regulated. Variable fare, influenced by distance, demand, route, and weather. Unregulated. Distance-based fare which is slightly higher in value than those of sedan taxis. Regulated. Vehicle Mostly used imported vehicles from Far East. Popular brands: Toyota, Nissan and Mazda. Mostly used imported vehicles from Far East and South Africa: Toyota HiAce. Mostly used imported vehicles: Toyota HiAce, VW Transporter and LT and Mercedes TN. Mostly unrestricted, used imported vehicles from Europe and Far East: VW microbus, VW LT and Toyota HiAce (distinctly painted yellow). Mostly used imported vehicles from South Africa and Japan: Toyota HiAce. Age Mostly over 10 years old. Mostly 15 years old. Mostly 15 to 20 years old. Mostly over 15 years old. Mostly 18 years old. Sedan Taxi Mode Share Official mode share: unknown Official mode share: unknown. Official mode share: 15%. Official mode share: less than 5%. Official mode share: 6% (2011). However, dramatic increase observed in on-the-ground evaluation (2020). Supply Flexible routes. However, limited service in outlying areas due to poor road condition. Route changes throughout the journey as new passengers’ board. More specific routes than minibus taxis. Restricted to specific areas. Area based licence. Operate within 10 km of licensed zone, but mostly in town centres and surrounding villages. Facilities Typically operate from the same makeshift ranks as the minibus taxis. Travel between formal bus terminals (ranks) and bus stops. Travel between major taxi terminals. Travel between formal public transport terminals and bus stops. Travel between informal paratransit ranks and even provide door-to-door services. Model Typically target-based business model. Typically target-based business model. Typically target-based business model. Typically target-based business model. Commission and target-based business models. Ticket Cash only, with no tickets or receipts. Cash only, with no tickets or receipts. Cash only, with no tickets or receipts. Cash only, with no tickets or receipts. Cash only, with no tickets or receipts. Fare Predominantly distance-based fare, around 15% more than minibus taxis Negotiated fare between driver and passengers (depending on OD pair). Variable fare, influenced by distance, demand, and route. Additional fee for "express service". Variable fare, influenced by distance, demand, and route. Unregulated. Variable fare, influenced by the travel distance and direction. Regulated. Vehicle Mostly used imported vehicles from Far East: Toyota Sienta, Honda Freed and Nissan Wingroad. Mostly used imported vehicles from Far East: Honda Fit and Toyota Corolla. Mostly used imported vehicles from Far East: Toyota Corolla and Toyota Vitz (distinctly painted yellow). Common vehicle: unknown. Mostly used imported vehicles from Far East: Toyota Corolla; Honda Fit. Age Age: unknown. However, fleets are generally old, although slightly newer than minibus taxis Mostly around 21 years old. Age: unknown. Age: unknown. Mostly 20 years old. Motorcycle Taxi Mode Share Official mode share: unknown. Motorcycle taxis are not officially recognised by MoTPW. N/A Official mode share: unknown. Estimated fleet size of 31,050. However, many operate without licences. Official mode share: 23%. However, many riders operate unlicenced motorcycles. Official mode share: unknown. Many motorcycle taxis are unregistered. N/A Supply Prohibited from operating in the city centre. Permitted to operate in specific areas. Popular in rural areas with untarred and steep roads Popular in rural areas - replace journeys that were previously made on foot or by bicycle. Not permitted to operate after 8pm. Operate in both the interior and exterior. Specialise in both short and longer distance trips. xi AFRICA URBAN MOBILITY OBSERVATORY – ROLE OF INFORMAL PARATRANSIT REPORT Category Blantyre Gaborone Kigali Kinshasa Lagos Maseru Model Typically target-based business model. Business model: unknown. Typically, riders either own or lease their motorcycles, although lease-to-own models are becoming more common. Business model: unknown. Ticket Cash only, with no tickets or receipt. Accept cash, mobile money, and credit card via smartphone apps. Cash only, with no tickets or receipt. Cash only, with no tickets or receipt. Fare Predominantly distance-based fare. Loosely regulated distance-based fare. Distance or demand-based fare. Additional fare charged for “complicated transportâ€. Variable fare, influenced by distance, demand, route, and weather. Unregulated. Vehicle Common vehicle: unknown. Common vehicle: unknown. However, mostly petrol although steadily being replaced by electric models. Common vehicle: unknown. However, mostly imported from China and Rwanda, where they are assembled. Common vehicle: unknown. However, engine capacity of 200 cc prohibited on major highways. Bicycle Taxi Mode Share Mode share: unknown. However, not very dominant. N/A Mode share: unknown. However, over 5,000 operators in Kigali and secondary cities. N/A N/A N/A Supply Prohibited from operating in central parts of the city. Restricted to main roads. Mostly provide a ‘last-mile’ service. Model Mostly owner riders. Business model: unknown. However, mostly owner riders. Ticket Cash only, with no tickets or receipt. Cash and payment using mobile money. Fare Distance-based fare. Typically flat fare, unregulated. However, daily membership fee for riders. Vehicle Bicycle taxis are not officially recognised by MoTPW. No licence required to operate bicycle taxis. Tricycle Taxi Mode Share N/A N/A N/A N/A Mode share: unknown. Many tricycle taxis are unregistered. N/A Supply Mostly operate shorter inner-city routes. Model Business model: unknown. Ticket Cash only, with no tickets or receipt. Fare Variable fare, influenced by distance, demand, route, and weather. Vehicle Common vehicle: unknown. However, engine capacity of 200 cc prohibited on major highways. xii AFRICA URBAN MOBILITY OBSERVATORY – ROLE OF INFORMAL PARATRANSIT REPORT General Findings BLANTYRE Environmental impact At a national level, per 2018 World Bank records, 1,570 kilotons of CO2 emissions were produced by Malawi, which translates to 0.087 metric tons per Capita; a relatively low value compared with the other six countries evaluated (1). Malawi ranks among the top 20 countries globally on the ambient air pollution index, at 67.38 ug/m3 (2). Malawi imposes no restrictions on used vehicle imports, with the average age of imported used petrol and diesel vehicles being nine years and 18 years respectively in 2015 (3). There are currently no vehicle emissions standards in Malawi (3). Diesel fuel available currently has a sulphur content maximum of 50 ppm (parts per million), which would support Euro 4 compliance, should this be legislated in future (4). E-mobility initiatives and electricity generation MicroMek, a Malawian hardware manufacturer, produces low-cost electric aerial drones to carry essential medical supplies to remote communities across Malawi and across the rest of Africa (5). At present, there are no known passenger e-mobility initiatives in Malawi. Ninety-four percent of electricity in Malawi is generated through hydropower (6), and therefore a transition to e-mobility would dramatically reduce transport related emissions. Regulatory and lobbying environment Transport planning and regulation falls under the mandate of the Ministry of Transport and Public Works (MoTPW) (7). The Directorate of Road Traffic, the regulatory arm of the MoTPW, is responsible for all road transport-related matters (8). Blantyre City Council is mandated by the Local Government Act of 1998 to provide and manage social infrastructure and basic urban services, which includes roads provision and maintenance (9). Blantyre City Council is supported by the Ministry of Lands and Housing, Ministry of Works, Roads Authority, Malawi Police Service, and the Ministry of Local Government and Rural Development (10). Malawi has put in place a series of legislative sectoral frameworks and strategies to integrate environment and climate change management in socio-economic development activities (11). At a national level, the Ministry of Natural Resources and Environmental Affairs is responsible for environmental protection, with the National Environment Policy of 2004 (12) promoting the reduction of transport sector emissions to improve air quality and mitigate climate change. The Environmental Management Act (2017) (13) makes provision for a coordinated and comprehensive future legal framework for environmental protection and management as well as the conservation and sustainable use of natural resources. Malawi has a National Adaptation Plan Framework; however the reduction of transport related emissions is not dealt with in this document (14). There have been several transport sector improvement plans over the past two decades, including the Road Sector Programme (RSP) 2010 to 2020, the Transport Sector Investment Programme (TSIP) of 2012, the Roads Authority’s (RA) Five Year Strategic and Business Plan 2011 to 2016, the Strategic Plan for the Ministry of Transport and Public Works (MoTPW), the Malawi National Transport Policy of 2015, the Malawi National Transport Master Plan (NTMP) 2017 to 2037, the Blantyre Urban Structure Plan 2000 to 2014, the Malawi Growth and Development Strategy (MGDS) 2011 to 2016, and the MGDS III of 2017 (15) (7). Plans are underway for the construction of a new Blantyre bus terminal (9) to support the re-introduction of city buses (16). Passenger rail services are also being investigated (16). A road rehabilitation programme is underway, which includes the upgrading of several key roads linking Blantyre to neighbouring towns and villages (8). Informal paratransit association membership is voluntary in Blantyre (7). Minibus taxis mostly belong to the Minibus Owners Association of Malawi (MOAM), a members’ funded association, which helps to manage routes to avoid over-saturation of service, coordinate strike action among members, and government lobbying (17). In addition, MOAM coordinates fares among members, however this is in breach of the Competition and Fair Trade Commission regulations, and in 2012 was ordered to cease what was described as anti-competitive business practices (18). Sedan taxis and motorcycle taxis are not officially recognised by xiii AFRICA URBAN MOBILITY OBSERVATORY – ROLE OF INFORMAL PARATRANSIT REPORT MoTPW, and therefore lack legal authorisation to operate. Consequently, at present there are no official sedan taxi or motorcycle taxi associations (16). There are no known transport specific NGOs or lobby groups in Blantyre. The Young Feminist Network Malawi (YFN) did however participate in an HVT sister project, HVT EMPOWER. Under this programme, a decision support tool is being developed to aid with decision making by various stakeholders in the transport sector, to help curb sexual harassment while traveling in sub-Saharan African cities (19). YFN Malawi participated in several rounds of stakeholder engagement and data collection. GABORONE Environmental impact At a national level, per 2018 World Bank records, 8,210 kilotons of CO2 emissions were produced by Botswana, which translates to 3.642 metric tons per Capita – the highest value of all six countries evaluated, by a considerable margin (1). 2015 figures suggest that transport was responsible for producing 2,430 kilotons of CO2 (20). Despite this, Botswana ranks among the top 20 countries globally on the ambient air pollution index, at 63.45 ug/m3 (2). Botswana imposes no restrictions on used vehicle imports, and the average age of imported used vehicles is unknown. Diesel fuel available currently has a sulphur content maximum of 50 ppm (parts per million), which would support Euro 4 compliance, should this be legislated in future (4). E-mobility initiatives and electricity generation In March 2021, The Ministry of Tertiary Education, Research, Science and Technology (MoTE) of Botswana, released an RFP (request for proposal) through UNDP (United Nations Development Programme), for assistance with the development of a National Electric Mobility Promotion Strategy for Botswana, aligned with Botswana President Mokgweetsi Masisi desire for Botswana to play an integral role in the global electric mobility transition (21). Giyani Metals, a mining company based in Botswana, supplies manganese to electric vehicle battery manufacturers globally (22). In March 2021, Baylee Enterprises, a private bus bodybuilder headquartered in Gaborone, announced its plan to manufacture an electric vehicle in Botswana from August 2021 (23). It is understood that the vehicle was undergoing compliance certification at the time of this announcement (24). While at present, just 2% of Botswana’s electricity is generated from renewable sources of energy, the 2020 – 2040 Integrated Resource Plan aims to increase this to 15% by 2030 (25). Regulatory and lobbying environment The Ministry of Transport and Communications (MT&C), with the support of the Department of Road Transport and Safety (DRTS), and the Botswana Police Service Traffic Department, is responsible for transportrelated matters in the city. This includes the provision of roads and infrastructure, supported by Gaborone City Council (GCC). The Motor Vehicle Accident Fund falls under the jurisdiction of the Ministry of Finance and Economic Planning (MFEP). At a national level, the Ministry of Environment, Natural Resources Conservation and Tourism is responsible for environmental protection (26). Air quality management is largely regulated through the Atmospheric Pollution Prevention Act of 1971, which is supplemented by the Environmental Impact Assessment Acts of 2005 and 2010, and the Ambient Air Quality - Limits for Common Pollutants of 2012 (26). Botswana has a National Adaptation Plan Framework; however the reduction of transport related emissions is not dealt with in this document (27). Although there are no transport improvement plans currently active, plans with a two-to-three-year horizon are currently being drafted, and are expected to be approved by the end of 2021 (28). These plans include the Greater Gaborone transport master plan, as well as a feasibility study for new scheduled bus service for Greater Gaborone, and a pedestrian facility improvement plan. At present there are no plans or policies handling the transition to electric mobility, although it is understood that this policy gap should be closed by 2022 (28). xiv AFRICA URBAN MOBILITY OBSERVATORY – ROLE OF INFORMAL PARATRANSIT REPORT There is only a single taxi association in the city of Gaborone, the Gaborone Taxi Association; membership by minibus and sedan taxi operators is voluntary (29). Formal bus operators belong to the Botswana Bus Operators Association (BOBOA). The Botswana Council of Non-Governmental Organizations (BOCONGO) is the national umbrella body for nongovernmental organisations in Botswana (30). The Society Of Road Safety Ambassador (SORSA) is an NGO which aims to curb road accidents, especially those involving Botswana’s youth (30). Recent campaigns and events include fatigue management training, African Network for Walking and Cycling Forum webinar, Safe Systems Approach and Speed Management Training, and Scholar Patrol Training. KIGALI Environmental impact At a national level, per 2018 World Bank records, 1,080 kilotons of CO2 emissions were produced by Rwanda, which translates to 0.088 metric tons per Capita – a relatively low value compared with the other six countries evaluated (1). Rwanda ranks among the bottom 20 on the continent on the ambient air pollution index, at 125.42 ug/m3 (2). Rwanda imposes no restrictions on used vehicle imports. In 2017, Rwanda had a total of 191,015 registered motor vehicles (including motorcycles and three wheelers). New vehicles accounted for just 15% of these vehicles, with the balance being used imported vehicles. 95.2% of Rwanda’s total vehicle fleet are older than 15 years (registered before 2005) (31). Regarding fuel, diesel fuel available currently has a sulphur content maximum of 50 ppm (parts per million), which would support Euro 4 compliance, should this be legislated in future (2). E-mobility initiatives and electricity generation In April 2021, Cabinet formally approved an e-mobility adoption strategy, with the following incentives (32): • The electricity tariff for charging stations shall be capped at the industrial tariff level (large industry category); • Electric vehicles will benefit from a reduced tariff during the off-peak time; • Electric vehicles, spare parts, batteries, and charging station equipment shall be treated as VAT zero-rated products; • Exemption of import and excise duties on electric vehicles, spare parts, batteries and charging station equipment; • There will be an exemption of Withholding Tax of 5% at customs; • There will be rent free land for charging stations (for land owned by government); • There will be provisions of electric vehicle charging stations in the building code and City planning rules; • There will be free licence and authorisation for commercial electric vehicles; • Companies manufacturing and assembling electric vehicles (battery electric vehicles, plug-in hybrid electric vehicles and hybrid electric vehicles) in Rwanda are given other incentives in the investment code such as 15% Corporate Income Tax (CIT) and tax holiday; • Electric vehicles will receive preference for Government hired vehicles. In 2019, President Paul Kagame announced a desire to replace all internal combustion engine motorcycle taxis with electric motorcycles (33). Ampersand is a Rwandan electric motorcycle taxi manufacturer, with its own battery charging and swap network in Kigali (34). Currently the motorcycles are imported as SKD (semi knocked down) kits (see glossary of terms for further details), and assembled in Kigali, although there are plans in place to increasingly source components locally (34). Several motorcycle taxi operators have begun converting their internal combustion engine (ICE) powered motorcycle fleets to electric. YegoMoto, with a fleet of 5,000 motorcycle taxis operating in Kigali, has collaborated with Ampersand, and expects to completely phase out its ICE motorcycles by 2025 (35). SafriRide, a new entrant in the motorcycle taxi sector, has a fleet of 45 electric motorcycles and scooters, with a further 75 to come online during 2021 (36). SafiRide is also in the process of setting up a delivery service with two electric vans. In order to help accelerate the xv AFRICA URBAN MOBILITY OBSERVATORY – ROLE OF INFORMAL PARATRANSIT REPORT transition to electric motorcycles, SafiRide is developing a new financing model, to help motorcycle taxi driver raise the capital necessary to upgrade to electric motorcycles. Presently, 54% of electricity in Rwanda is generated through renewable sources) (37). Regulatory and lobbying environment Transport planning falls under the jurisdiction of the National Ministry of Infrastructure (MININFRA) (38). The Rwanda Transport Development Agency (RTDA), which was created in 2010 (in accordance with Law No. 02/2010 of 2010, modified by Law No. 29/2014 of 2014), and which reports to MININFRA, is responsible for all national and regional road infrastructure. The key functions of RTDA are to develop, coordinate, and monitor transport development projects; coordinate and monitor maintenance projects; safeguard environment protection while implementing transport; development activities; and research in transport development (39). The City of Kigali (CoK) is responsible for district and feeder road infrastructure in the city (38). Roads are classified in accordance with Law No 55/2011 of 2011, which also defines criteria for road maintenance and management (38). At a national level, the Ministry of Environment is responsible for environmental protection (40). The Constitution of the Republic of Rwanda guarantees every person the right to a clean and healthy environment. From this, the State has a duty to ensure the environment is protected and thereby need to undertake various measures (including the establishment of laws that outline the modalities) for protecting, conserving, and promoting the environment (31). In 2006 Rwanda published its National Adaptation Programme of Action to Climate Change report (41). In this report, the impact of climate change on transport, and the need for mitigation measures to reduce reliance of transport on fossil fuels, which contribute towards climate change, are discussed. All bicycle taxi and motorcycle taxis must register with the Rwanda Cooperative Agency (RCA) (38). There are two operating organisations: Rwanda Federation of Taxi-Moto Drivers (FERWACOTAMO); and the Syndicate of Taxi-Motos of Rwanda (SYSTRAMORWA) (42). FERWACOTAMO is the larger of the two entities, with approximately 78,000 members across 240 motorcycle taxi cooperations. RURA has indicated that it wishes to establish an online platform to register all motorcycle taxis in Rwanda (38). The International Growth Centre (IGC), and NGO which aims to promote sustainable growth in developing countries, has an office in Kigali (43). Recent IGC publications include a policy brief on the impact of scaling up electric motorbikes in Rwanda, and a policy paper on car-free days and pollution free cities. The Global Green Growth Institute (GGGI), a treaty-based inter-governmental organisation dedicated to supporting inclusive and sustainable economic growth in developing countries, also has a programme in Rwanda, focusing on green growth and climate resilience (44). KINSHASA Environmental impact At a national level, per 2018 World Bank records, 2,200 kilotons of CO2 emissions were produced by DRC, which translates to 0.026 metric tons per Capita, a relatively low value compared with the other six countries evaluated (1). Despite this, DRC ranks among the bottom 20 on the continent on the ambient air pollution index, at 112.78 ug/m3 (2). DRC imposes a maximum age limit on used vehicle imports of 9 years; the average age of imported used vehicles is unknown (2). Diesel fuel available currently has a sulphur content maximum of 500 ppm (parts per million), which would support only Euro 2 compliance, should this be legislated in future (2). E-mobility initiatives and electricity generation In March 2021, Mopepe Solutions launched an electric vehicle rental service in Kinshasa, with a fleet of Nissan Leaf EVs and 12 charging stations (45). Much of the world’s cobalt supply (a critical element in electric vehicle batteries) is mined in the DRC (46). Despite this, there are no known electric vehicle initiatives in the country to encourage their uptake. xvi AFRICA URBAN MOBILITY OBSERVATORY – ROLE OF INFORMAL PARATRANSIT REPORT Hydroelectric power accounts for 96% of DRC’s electricity generation (47), meaning a transition to e-mobility would have a substantial impact on reducing emissions. Regulatory and lobbying environment Kinshasa has no independent transport authority (48). The National Road Safety Commission (Commission Nationale de Prévention Routière) is a branch of the Ministry of Transport, established to regulate road transport. The national government, through the Ministry of Economy, and the Kinshasa city government, set formal public transport fares and determine routes, with input from operators. The Ministry of Public Works and Infrastructure is responsible for construction and maintenance of higher order arterial roads (48). The Kinshasa city government is responsible for maintaining lower order city roads. Planning falls under the responsibility of the Ministry of Planning, although the Ministry of Transport is responsible for transport planning through a transport study group, the Groupe d’Etudes de Transport. At a national level, the Ministère de l'Environnement et du Développement Durable is responsible for environmental protection (49). Article 53 of the Constitution of the DRC (adopted by Government in 2006) states that every person has a right to a healthy environment, and which is favourable to his / her full development; the environment must be protected; the State must look after the protection of the environment and the health of the people. Article 123 of the Constitution further makes provision for laws to be made concerning, inter alia, the protection of the environment and tourism. Article 203 then also allows for co-operative governance by central government and the Provincial administrations to protect “the environment, natural sites and landscapes, and the conservation of such sites (p. 58)†(50). The National Strategic Development Plan (PNSD) (Plan National Stratégique de Développement) funded by the United Nations Development Programme (UNDP) for 2017 to 2021 – the national vision for economic development by 2030, is currently being finalised (51). The PNSD is informed by the Poverty Reduction Strategy Paper (DSRP) (Documents de Stratégie pour la Réduction de la Pauvreté) for 2002 to 2005 – Stabilisation, transition and reconstruction; Growth and Poverty Reduction Strategy Paper (DSCRP) (Document de la Stratégie de Croissance et de Réduction de la Pauvreté) for 2006 to 2010 - Governance and the revival of pro-poor growth; and Governance Support Programme (DSCRP-2 and the PAG - Programme d'Appui à la Gouvernance) for 2011 to 2016 - Growth, employment creation and climate change impact. A National Integrated Transport Master Plan (PDNIT) (Le Plan Directeur National Intégré des Transports) is currently being prepared, which covers the entire country, with regional and urban scales of intervention (51). In terms of the urban transport system in Kinshasa, several programs have been proposed, such as development and maintenance of urban roads, improvement and management of intersections, multi-modal transport hubs (Les pôles d’échanges), and public transport network development, including buses and BRT (51). The Strategic Orientation Scheme for the Kinshasa Metropolitan Area (SOSAK) (Schéma d'Orientation Stratégique de l'Agglomération Kinoise) was produced and approved by the provincial congress in 2015, to promote planned urban development, with support of the French Development Agency (AFD) (Agence Française de Développement), which highlights the importance of having an Urban Transport Master Plan in parallel with urban development (51). Substantial investment is required in electricity generation and distribution in Kinshasa (52); electricity blackouts for up to 15 hours a day are not uncommon. The Association of Public Transport Vehicles Owners (APVCO) (Association des Chauffeurs du Congo) is the association for Esprit de Vie operators, who operate formal midi-bus bus services alongside state-run buses in the city (51). The Association of Public Transport Vehicles Owners (ACCO) (Association des Propriétaires de Véhicules Affectés au Transport en Commun) caters for operators of privately owned sedan taxis. The National Association of Owners of Motorcycle Taxies of the Congo (ANIPTMC) supports motorcycle taxi operators (51). The Association des Chauffeurs du Congo supports informal paratransit minibus operators (48). There are no known transport sector NGOs or lobby groups operating in Kinshasa. xvii AFRICA URBAN MOBILITY OBSERVATORY – ROLE OF INFORMAL PARATRANSIT REPORT LAGOS Environmental impact At a national level, per 2018 World Bank records, 130,670 kilotons of CO2 emissions were produced by Nigeria, which translates to 0.667 metric tons per Capita, a moderate value compared with the other six countries evaluated (1). Nigeria ranks among the bottom 20 on the continent on the ambient air pollution index, at 151.52 ug/m3 (2) – the highest value of the six countries evaluated. Nigeria imposes a maximum age limit on used vehicle imports of nine years (2) – the average age of imported used vehicles is unknown. Diesel fuel available currently has a sulphur content maximum of 3000 ppm (parts per million), which is unable to support even Euro 2 compliance (2). E-mobility initiatives and electricity generation In anticipation of the transition towards electric vehicles globally and motivated by a desire to reduce harmful emissions in Nigerian cities, in July 2021 Nigeria’s Federal Government announced its intention to incorporate electric vehicles into the National Automotive Industry Development Plan (NAIDP) (53). It is expected that the NAIDP will be passed into law by the end of 2021 (53). In November 2020, Stallion Motors, a Nigerian vehicle assembly company based in Abuja, unveiled the first electric passenger vehicle to be produced in Nigeria, the Hyundai Kona Electric (54); this is a major milestone not just for the country, but the entire region. It is anticipated the Volkswagen will also assemble electric vehicles in Nigeria, having signed a memorandum of understanding with the Nigerian government in 2018 (55). In 2020, Nigeria’s National Automotive Design and Development Agency (NADDC) launched it Electric Vehicle Technology Transfer pilot programme, which includes the construction of three solar electric vehicle charging stations at various university campuses across Nigeria, to encourage research and development into electric vehicle technologies in Nigeria (56). The first of these opened at the University of Lagos in 2021. Renewable energy sources account for 12.7% of electricity generation capacity in Nigeria (57). According to the 2011 Renewable Energy Masterplan of Nigeria, this is intended to increase to 23% by 2025, and to 36% by 2030 (58). Regulatory and lobbying environment There are almost 100 agencies at the federal, state, and local levels responsible for the organisation and regulation of urban transport in Nigeria (48). The main transport regulatory instruments include the Central Licensing Authority Law of 1980, the National Road Traffic Regulations of 1997 (adopted under the Federal Road Safety Commission Decree of 1988), and the Lagos State Road Traffic Law and subsidiary legislation dating from 1949 (48). In order to enable Lagos City to have greater control over transport matters in the city, LAMATA (Lagos Metropolitan Area Transport Authority) was founded in 2002, as an independent transport authority and the entity responsible for formulating, coordinating, and implementing urban transport policies and programs in the metropolitan area (48). LAMATA has the authority to levy and collect user charges relating to its services, and to collect other tariffs, fees, and road taxes (48), and is responsible for local traffic management schemes, parking control, and management of public transport terminals (59). At a national level, the Ministry of Environment is responsible for environmental protection (60). National policies and plans include, among others, the National Environmental Policy of 1989, the National Climate Change Policy and Response Strategy of 2013, and the National Adaptation Strategy and Plan of Action of 2011 (for Climate Change) (60) (61). In 2013, the Lagos State Government (LSG) developed the Logos State Development Plan (2012-2025), with the key aims being to provide direction for growth and development in the state, and to provide direction to all sectors of the economy to help achieve improved quality of life for people living in the state (62). Another key initiative was the three-year Bus Reform Initiative (BRI) (2017-2019), which aimed to improve capacity and customer experience by replacing all minibus taxis with High Occupancy Vehicles (HOVs), along with increased digitalisation of the network, improved transport infrastructure, and driver training (59). An xviii AFRICA URBAN MOBILITY OBSERVATORY – ROLE OF INFORMAL PARATRANSIT REPORT example of an outcome associated with this initiative was the launch of 500 seven-seater microbuses in 2021 as a first and last mile (FLM) service (63). In 2018, on behalf of the LSG, LAMATA initiated the development of a Non-Motorised Transport (NMT) Policy, to guide the implementation of transport systems that prioritise the needs of pedestrians and cyclists (64). In addition, LSG is currently working on a policy for the use of electric vehicles and plans to conduct a pilot using CNG buses imminently, with an electric bus pilot to follow in future (63). Informal paratransit minibus and midi-bus taxi operators are affiliated with one of several associations (65); the two largest being the National Union of Road Transport Workers (NURTW), and the Lagos State Urban Bus Owners Association. The latter association claims membership of 3,000 owners, however only 1,270 are reported to be licenced (48). There are two BRT operators: a private sector entity called PRIMERO Transport Services; and a Lagos State government owned entity, Lagos Bus Services Limited (LBSL) (64). LBSL was created in 2016 as part of the BRI, and currently runs more than 500 buses across 40 routes. Membership to the Motorcycle Operators Association of Nigeria, for motorcycle taxis, and the Tricycle Owners Association of Nigeria, for tricycle taxis, is voluntary (63). Arrive Alive Road Safety Initiative (AARSI) is a Nigerian NGO aiming to improve road safety awareness, and ultimately prevent traffic fatalities (66). Recent campaigns have focused on pedestrian safety, truck safety, child safety, motorcycle safety, as well as driving under the influence of alcohol, and driver distractions (such as use of a cell phone while driving) (66). MASERU Environmental impact At a national level, per 2018 World Bank records, 2,570 kilotons of CO2 emissions were produced by Lesotho, which translates to 1.2 tonnes per Capita, the second highest compared with the other six countries evaluated (1). Lesotho imposes a maximum age limit on used vehicle imports of five years (2); the average age of imported used vehicles is unknown. Diesel fuel available currently has a sulphur content maximum of 50 ppm (parts per million), which would support Euro 4 compliance if this were to be legislated (2). E-mobility initiatives and electricity generation The Lesotho draft Renewable Energy Policy of 2013 recommends the introduction of a range of incentives to encourage the transition to electric vehicles, including the following (67): reduce VAT (value added tax) on EVs (electric vehicles) and PHEVS (plug-in hybrid electric vehicles), reduced road tax on EVs and PHEVs, Reduced electricity tariffs for off-peak EV and PHEV charging, Incentives to encourage fleet operators to switch to electric trucks, buses and taxis. It is unclear why this policy, eight years after the draft was released, has still not been ratified. Over 50% of electricity consumed in Lesotho is imported from neighbouring countries (68). Local generation capacity is 99.7% hydroelectric, with plans underway to expand local generating capacity further using renewable energy sources (69). Regulatory and lobbying environment The Ministry of Public Works and Transport (MoPWandT) is the primary authority responsible for overseeing transport related matters in the city (70). The Department of Traffic and Transport, led by the Traffic Commissioner, who reports to the MoPWandT, is responsible for vehicle registration, vehicle licensing roadworthiness testing, driver testing and licensing, as well as issuing and enforcement of transport permits, and compliance with road regulations. The Ministry of Local Government and Chieftainship (MCC), which is responsible for land allocation in coordination with traditional chiefs, is also responsible for construction and maintenance of all local roads. The Roads Fund (Ministry of Finance) is a separate body with dedicated resources (fuel levy, licensing fees, border toll-gate fees, etc.), financing and auditing of road maintenance of major roads (70). xix AFRICA URBAN MOBILITY OBSERVATORY – ROLE OF INFORMAL PARATRANSIT REPORT At a national level, the Ministry of Energy and Meteorology is responsible for environmental protection (71). Lesotho’s first national greenhouse gas inventory was compiled in 2000 for 1994, while the second was undertaken for 2000 and was published in 2013. The first two inventories were based on the revised 1996 Intergovernmental Panel on Climate Change (IPCC) guidelines. Lesotho’s third national greenhouse gas inventory was published in 2018, covering the years 2005 to 2010, with the fourth published in 2019 covering the years 2011 to 2017. The last two inventories have been compiled using the 2006 IPCC guidelines (71). Emissions are regulated through the Lesotho Environment Act 10 of 2008 and are monitored by the Lesotho Meteorological Services (LMS). LMS is the national inventory agency with the overall responsibility for compiling the national greenhouse gas inventories, including the emissions from the energy sector which encompasses road transport (71). Lesotho is in the process of developing a National Adaptation Plan with the support of the United Nations Framework Convention on Climate Change Kampala Regional Collaboration Centre (72). The current proposed table of contents makes no reference to the impact of transport on climate change. Established in 1990, the Lesotho Council of Non-Governmental Organisations (LCN) is an umbrella organisation which supports NGOs by facilitating networking, capacity building and coordination (73). There are no known NGOs dedicated to transport related matters, however in 2016, LCN coordinated a road safety campaign with the support of the Puma Energy Foundation, and an NGO called AMEND (73). Paratransit reform approaches There is increasing acceptance that replacement of informal paratransit services with formalised public transport is simply not viable in many sub-Saharan African cities (74). There is thus, subsequently, a need to identify ways in which existing services can be incrementally improved. In this sub-section, possible reform strategies, corroborated through stakeholder engagement (74), are discussed. It should be noted that there has, however, been limited research on informal paratransit reform strategies, largely because there is little data, and attitudes towards informal paratransit have been less than favourable, resulting in most efforts investing how to replace these services entirely. The following reform strategies are not intended to be prescriptive, but rather indications of possible reform measures, from which inferences can be drawn. • Regulatory environment reform: While informal paratransit operations frequently operate outside of formal regulations, resulting in continual conflict between informal paratransit operators and law enforcement, a reformed regulatory environment is necessary to help overcome this challenge. It is important that the needs of operators are considered more carefully to ensure an environment that is conducive to their services, and thereby making compliance less of a burden. A well-designed regulatory environment has the potential to improve safety standards and driver behaviour, as well as to match supply with demand, thereby improving levels of service and profitability. • Infrastructure improvements: Better infrastructure and facilities are essential for optimisation of informal paratransit operations. This includes roads and pathways for motorised and NMT traffic and dedicated public and informal paratransit lanes as well as queue jump lanes at intersections to help prioritise mass transit services over private vehicular traffic. Initiatives like these would aid in reducing the impact of traffic congestion on mass transit services by reducing journey duration and allowing increased frequency. Upgrading of public and informal paratransit ranks, terminals and stops ensures a better experience for users as well as optimises flow of traffic. In addition, to support the transition towards e-mobility, in the context of fragmented privately owned and operated informal paratransit services, public investment in charging infrastructure and equipment is required. • Capital subsidies: In the context of limited funding, subsidisation of informal paratransit services is usually not viable. However, where there are adequate resources available, capital subsidies towards fleet renewal can have a major positive impact on the safety and levels of service offered by informal paratransit operators. Such a programme could also be leveraged to encourage business model reforms, and introduction of monitoring systems (such as vehicle tracking devices) to foster road regulation adherence. xx AFRICA URBAN MOBILITY OBSERVATORY – ROLE OF INFORMAL PARATRANSIT REPORT • Business model reform: The ideal business model, which would support the optimisation of informal paratransit services, would allow operators to work towards providing an integrated service based on a centralised operational plan. Since informal paratransit operations are highly fragmented, this is unfortunately a major challenge. The primary changes required to achieve this include: forming a centralised company in which existing operators become shareholders, and drivers become salaried employees, the centralised company develops operational and maintenance plans to which drivers adhere, thereby shifting away from vehicle level target models; and revenue is pooled, through the support of an electronic fare collection system thereby ensuring that success is not linked to the performance of individual vehicles in isolation, but rather the collective success of the fleet. • Urban transport technology reform: In the absence of data, it is difficult to identify opportunities for optimisation. Route mapping and live vehicle tracking are cost-effective ways to generate data and can be used to monitor vehicle driver behaviour (speed, acceleration), as well as monitor vehicle emissions, to ensure compliance with operational requirements and regulations. In addition, integrated cashless automatic fare collection systems can enable more seamless transfers between vehicles and modes, while enhancing revenue visibility. Telemetry and AFC systems typically cost between GBP 10 and GBP 20 per vehicle per month (depending on features and services chosen). • Vehicle emissions reduction: To reduce vehicle emissions, national and local authorities can consider the following interventions: ï‚š Support route and operation optimisation through licence controls; ï‚š Collect live vehicle telemetry data to identify opportunities for network optimisation and identify vehicles producing excessive emissions; ï‚š Ensure availability of cleaner fuels (maximum sulphur content 50 parts per million); ï‚š Encourage a transition to electric vehicles through incentive schemes (reduced tax on EVs, reduced electricity tariffs for EVs during off-peak periods, vehicle recapitalisation programmes) and investment in charging infrastructure and local automotive industry; ï‚š Place restrictions on the maximum age of used imported vehicles; ï‚š Enforce emissions compliance standards applicable to new and imported used vehicles; ï‚š Introduce emissions testing criteria for vehicle licence renewal; ï‚š Improve the road network and conditions through regular preventative maintenance; ï‚š Improve road traffic management by (traffic signal coordination to reduce delays). Informal paratransit reform case study cities In this sub-section, informal paratransit and regulatory environment reform strategies introduced in Kigali and Lagos are presented. It is important to note that these reform strategies are not without their flaws and must be carefully scrutinised before any consideration is made to transplant these approaches to other cities, where contextual conditions vary considerably. Kigali • Business model reform: Between 2006 and 2013, the RURA embarked on a process of formalising paratransit bus operations in Kigali. Four five-year contracts were awarded to three bus companies, replacing previous paratransit operations. The city was divided into four public transport zones. These companies receive no state operating subsidy, but they are protected from competition, since RURA only permits a single operator per zone. RURA encourages increased use of high occupancy vehicles and sets levels of service targets. Other improvements made by RURA and CoK include public transport infrastructure upgrades (bus terminals, NMT facilities, and roads); increased public transport supply; cashless fare collection system on all buses; free Wi-Fi internet on all buses; public transport vehicles speed management; and regulation of motorcycle taxis. • Urban transport technology reform: Through a combination of private sector innovation and regulatory environment reform, several technological advances have been achieved in Kigali. All buses are legally required to be equipped with a centralised AFC system, which includes live vehicle location tracking and xxi AFRICA URBAN MOBILITY OBSERVATORY – ROLE OF INFORMAL PARATRANSIT REPORT speed monitoring. The data generated is monitored by RURA, allowing optimisation of service, and enables greater visibility of compliance with levels of service targets and regulations. Bus fares are distance-based and managed using a smartcard system developed by AC Group, called Tap and Go. Tap and Go travel credits can be loaded via a smartphone app, a USSD-based mobile-money service, or with cash, at kiosks located across the city. Many buses are also equipped with LTE-based Wi-Fi internet for passengers to use free of charge (75). Motorcycle taxis are also increasingly embracing new technologies, with several motorcycle taxi e-hailing services emerging in Kigali, and which are expanding into neighbouring countries. CanGo (formerly SafeMotos), is one such platform, and aims to increase transport safety by monitoring driver behaviour, and ensuring a minimum threshold is met in order to remain on the platform (76). Other e-hailing platforms include SafiRide, Pascal-Moto, and YegoMoto (77) (78). • Vehicle emissions reduction: President Paul Kagame’s announced desire in 2019 to replace all internal combustion engine motorcycle taxis with electric motorcycles has encourage rapid uptake of electric motorcycles in Kigali (33). Ampersand, the Rwandan electric motorcycle taxi manufacturer, with its own battery charging and swap network in Kigali (34), is supplying to several motorcycle operators, including YegoMoto (35) and SafiRide (36). Lagos • Regulatory environment and business model reform: Major regulatory environment reforms were initiated in 1999 by the Governor Asiwaju Bola Ahmed Tinubu. Reform initiatives included the creation of new agencies such as the LASTMA in 2000 and the LAMATA in 2002. LAMATA’s mandate is to reverse the decades of neglect of Lagos’ transport network, and to coordinate the activities of multiple agencies responsible for making and implementing transport policy. LAMATA is a corporate body, with an independent board, responsible for formulating, coordinating, and implementing urban transport policies and programs in the metropolitan area. In 2008, Lagos was the first city in Africa to launch a BRT service (63). Two operators run the service: a private sector entity called PRIMERO Transport Services, and a Lagos State government owned entity, LBSL. The network comprises over 500 buses, operating 40 routes. Fares are around 30% to 50% less than the minibus taxi services it replaced, with journeys costing from as little as GBP 0.35. This project is estimated to have reduced travel time by one third, which is equivalent to benefits in time saved of approximately USD$240M (60). In 2021, LAMATA launched 500 seven-seater microbuses, providing an on-demand feeder service to the BRT network (63). These micro-buses are intended to eventually replace tricycle taxis and motorcycle taxis. • Urban transport technology reform: The BRT service supports electronic payment via an NFC travel card (The Cowry Travel Card), which applies a distance and zone-based fare using location-tracking technologies (63). Likewise, the seven-seater feeder service micro-buses have the same AFC system integrated, which allows not only easier transfer between the modes, but collection of more complete travel pattern data (63). Informal paratransit reform opportunities Blantyre • Regulatory environment reform: The MoTPW is responsible for transport planning in Blantyre, while Blantyre City Council is responsible for managing basic urban services, which includes roads provision and maintenance. Blantyre City Council is supported by the Ministry of Lands and Housing, Ministry of Works, Roads Authority, Malawi Police Service, and the Ministry of Local Government and Rural Development. It is thus proposed that the establishment of a metropolitan area transport authority, mandated to plan, coordinate, and manage all urban transport matters, would support the provision of a coordinated regulatory and planning environment (including the introduction of an informal paratransit licencing regime) capable of balancing supply and demand, and thereby improving levels of service and profit margins for, especially, the various paratransit operators. • Infrastructure improvements: Over two thirds of Blantyre’s road network is untarred, and in poor condition, resulting in higher capacity informal paratransit services avoiding many poorer communities altogether. To address this, it is proposed that a tarred road network expansion plan in conjunction with an informal paratransit road network development and maintenance plan be advocated to enable the xxii AFRICA URBAN MOBILITY OBSERVATORY – ROLE OF INFORMAL PARATRANSIT REPORT various paratransit services to access these areas more easily and efficiently. The existing roads (gravel and tar) which are in poor condition, but which are to be included in an informal paratransit route network, should be prioritised for maintenance and/or upgrade. In addition, plans should be developed for a publicly funded EV charging network to support the future transition of informal paratransit vehicles towards e-mobility. • Capital subsidies: None of the informal paratransit services receive any form of subsidy. While funding to support any form of subsidy is very limited, it is proposed that should funds become available, focus be placed on a minibus taxi recapitalisation programme, in conjunction with a new centrally managed licenced informal paratransit route network. This would ensure that minibus taxis, which are more efficient than sedan taxis in terms of energy consumption and road space, are more affordable to operators. • Business model reform: In the absence of a metropolitan area transport authority to coordinate and support informal paratransit operators to reform their business models, it is proposed that this be considered as a longer-term opportunity in future. • Urban transport technology reform: Currently, none of the informal paratransit services make use of transport technologies, such as vehicle telemetry or AFC (Automatic Fare Collection). To enable the development of a minibus taxi route network, it is thus proposed that all informal paratransit vehicles be equipped with telemetry systems (as a prerequisite to receive an operating license). This will enable MoTPW to continually optimise and balance informal paratransit services through a data driven licensing regime, as well as monitoring of driver behaviour and emissions. In addition, operators will have a better understanding of their operational costs, which will allow them to focus on delivering an efficient and effective service. Training and capacity building would be required to administer such a system effectively. • Vehicle emissions reduction: Most paratransit operators choose used imported vehicles due to their affordability. Since there are no restrictions on the age of used import vehicles in Malawi, the average age of used petrol and diesel vehicles imported is nine and 18 years, respectively (3). There are also currently no vehicle emissions standards. In order to reduce informal paratransit vehicle emissions, as is typical in other cities, a maximum age limit of between three and five years for used imported vehicles should be introduced (this will result in an increase in the cost of purchasing an informal paratransit vehicle – this should be investigated thoroughly before implementing any such reforms). In addition, since the fuel available is already able to support Euro 4 emissions standards, Euro 4 emissions compliance should be the minimum permitted for all new and used imported vehicles. To support the transition to e-mobility, it is also proposed that the MoTPW help facilitate the conducting a pilot with an electric minibus and/or electric sedan, to understand how EV technology impacts on operations, as well as to calibrate total cost of ownership models. Gaborone • Regulatory environment reform: The MT&C, with the support of the DRTS, and the Botswana Police Service Traffic Department, is responsible for transport-related matters in the city. DRTS is responsible for issuing and monitoring public transport permits, as well as managing vehicle registration and licensing, vehicle roadworthy examinations, driver training, examination and licensing, transport permits, registration and inspection of driving schools, and control of public passenger and freight transport vehicles (29). Law enforcement, including public transport inspection, is supported by the Botswana Police Traffic Department. It is thus proposed that the establishment of a metropolitan area transport authority, mandated to plan, coordinate, and manage all urban transport matters, would support the provision of a coordinated regulatory and planning environment (including the introduction of an informal paratransit licencing regime) capable of balancing supply and demand, and thereby improving levels of service and profit margins for, especially, the paratransit operators. • Infrastructure improvements: Approximately 90% of roads used by informal paratransit vehicles in Gaborone are tarred, with the balance being mostly gravel roads that are typically not adequately maintained (28). In addition, infrastructure is under-developed in many parts of the city causing operators xxiii AFRICA URBAN MOBILITY OBSERVATORY – ROLE OF INFORMAL PARATRANSIT REPORT to avoid many areas, particularly those with low population densities. To address this, it is proposed that an informal paratransit route network expansion plan in conjunction with a road network infrastructure maintenance plan be advocated. The existing roads (gravel and tar) which are in poor condition, but which are to be included in an informal paratransit route network, should be prioritised for maintenance and/or upgrade. In addition, plans should be developed for a publicly funded EV charging network to support the future transition of informal paratransit vehicles towards e-mobility. • Capital subsidies: None of the informal paratransit services receive any form of subsidy. It is proposed that emphasis be placed on introducing a minibus taxi recapitalisation programme (since they supply more than 90% of public transport trips within the CBD (79)), in conjunction with a new centrally managed licenced informal paratransit route network. This would ensure that minibus taxis, which are more efficient than sedan taxis in terms of energy consumption and road space, are more affordable to operators. • Business model reform: In the absence of a metropolitan area transport authority to coordinate and support informal paratransit operators to reform their business models, it is proposed that this be considered as a longer-term opportunity in future. • Urban transport technology reform: Currently, none of the informal paratransit services make use of transport technologies, such as vehicle telemetry or AFC (Automatic Fare Collection). To enable the development of a minibus taxi route network, it is thus proposed that all informal paratransit vehicles be equipped with telemetry systems (as a prerequisite to receive an operating license). This will enable DRTS to continually optimise and balance informal paratransit services through a data driven licensing regime, as well as monitoring of driver behaviour and emissions. In addition, operators will have a better understanding of their operational costs, which will allow them to focus on delivering an efficient and effective service. Training and capacity building would be required to administer such a system effectively. • Vehicle emissions reduction: Most paratransit operators choose used imported vehicles due to their affordability. There are no restrictions on the age of used import vehicles in Botswana, and the average age of these vehicles is unknown (it is recommended that this be established through engagement with a licencing officer at a Gaborone Department of Road Transport and Safety Office). There are also currently no vehicle emissions standards. In order to reduce informal paratransit vehicle emissions, as is typical in other cities, a maximum age limit of between three and five years for used imported vehicles should be introduced (this will result in an increase in the cost of purchasing an informal paratransit vehicle – this should be investigated thoroughly before implementing any such reforms). In addition, since the fuel available is already able to support Euro 4 emissions standards, EURO 4 emissions compliance should be the minimum permitted for all new and used imported vehicles. Giyani Metals currently supplies manganese to electric vehicle battery manufacturers (22) and Baylee Enterprises plans to manufacture an electric vehicle in Botswana from August 2021 (23). To support the transition to e-mobility, it is also proposed that MT&C (with the help of the DRTS) promote initiatives like these by, for example, advocating a pilot programme with an electric minibus and/or electric sedan to understand how EV technology impacts on operations, as well as to calibrate total cost of ownership models. Kigali • Regulatory environment reform: Although MININFRA, RTDA, CoK, RURA and REMA seem to work effectively together, it may still be advantageous to introduce a single metropolitan area transport authority, mandated to plan, coordinate, and manage all urban transport matters. The aim would be for this authority to support the provision of a coordinated regulatory and planning environment among the formalised bus and paratransit operators which caters for all services through balancing demand and supply, and considering their accessibility, levels of service and profit margins. • Infrastructure improvements: More than 80% of Kigali’s roads are not tarred and become water-logged during the wet season and dusty during the dry season. This causes discomfort to passengers, damage to vehicles, and increased travel time (39). To address this, it is proposed that a tarred road network expansion in conjunction with an informal paratransit road network development and maintenance plan xxiv AFRICA URBAN MOBILITY OBSERVATORY – ROLE OF INFORMAL PARATRANSIT REPORT be advocated, to enable bicycle and motorcycle taxi services to access these areas more effortlessly. The existing roads (gravel and tar) which are in poor condition, but which are to be included in an informal paratransit route network, should be prioritised for maintenance and/or upgrade. In addition, plans should be developed for a publicly funded EV charging network to support the future transition of formalised bus services towards e-mobility. • Capital subsidies: Motorcycle taxis do not receive any form of subsidy. However, since President Paul Kagame’s is advocating that all internal combustion engine motorcycle taxis be replaced with electric motorcycles, it is recommended that a motorcycle recapitalisation programme be considered. In the absence of any form of capital or operating subsidy for the formal bus services, their operators will likely struggle to renew their fleet once they reach the end of their service life. It is therefore recommended that either a subsidy or bus recapitalisation programme be considered to ensure the fleet remains safe and reliable. • Urban transport technology reform: While Kigali has achieved several technological advances including, among others, AFC, live vehicle location tracking, and speed monitoring on formalised buses and licenced motorcycle taxis, the data being generated is not being leveraged to aid with the optimisation of these services. Therefore, it is recommended that RURA invest in capacity to take advantage of this rich data source. In addition, it is proposed that the data collected be extended to vehicle emissions monitoring. • Vehicle emissions reduction: There are currently no vehicle emissions standards, nor any restrictions on the age of used vehicle imports. To reduce passenger transport vehicle emissions, a maximum age limit of between three and five years for used imported vehicles should be introduced (this will result in an increase in the cost of purchasing an informal paratransit vehicle – this should be investigated thoroughly before implementing any such reforms). In addition, since fuel currently supplied is able to support Euro 4 emissions standards, Euro 4 emissions compliance should be the minimum permitted for all new and used imported vehicles. To further advocate e-mobility, it is also proposed that MININFRA, through the emobility strategy approved in April 2021, actively remind motorcycle taxi operators of the incentives of this strategy and the benefits they could reap from transitioning to electric motorcycles. Kinshasa • Regulatory environment reform: Kinshasa has no independent transport authority, with multiple government agencies being responsible for various aspect of transport related governance and enforcement (48). It is thus proposed that the establishment of a metropolitan area transport authority, mandated to plan, coordinate, and manage all urban transport matters, would support the provision of a coordinated regulatory and planning environment (including the introduction of an informal paratransit licencing regime) capable of balancing supply and demand, and thereby improving levels of service and profit margins for, especially, the various paratransit operators. • Infrastructure improvements: Informal paratransit services travel on Kinshasa’s under-developed road network, of which just 10% is tarred, and in poor condition (51). To address this, it is proposed that a tarred road network expansion plan in conjunction with an informal paratransit road network development and maintenance plan be developed. The existing roads (gravel and tar) which are in poor condition and known to become flooded, but which are to be included in an informal paratransit route network, should be prioritised for maintenance and/or upgrade. In addition, plans should be developed for a publicly funded EV charging network to support the future transition of informal paratransit vehicles towards e-mobility. • Capital subsidies: None of the informal paratransit services receive any form of subsidy. While funding to support any form of subsidy is very limited, it is proposed that should funds become available, focus be placed on a minibus taxi recapitalisation programme. This is supported by the fact that more than a third of motorised journeys are made by this (notoriously unsafe) paratransit mode (51), known as Esprit de Mort/ Spirit of Death which are mostly well over 15 years old. In addition, due to rising popularity of motorcycle taxis, accounting for more than a fifth of motorised journeys (51), a subsequent focus could be to support motorcycle taxi operators convert their fleets to electric motorcycles. xxv AFRICA URBAN MOBILITY OBSERVATORY – ROLE OF INFORMAL PARATRANSIT REPORT • Business model reform: In the absence of a metropolitan area transport authority to coordinate and support informal paratransit operators to reform their business models, it is proposed that this be considered as a longer-term opportunity in future. • Urban transport technology reform: Currently, none of the informal paratransit services make use of transport technologies, such as vehicle telemetry or AFC (Automatic Fare Collection). To enable the development of a minibus taxi route network, it is thus proposed that all informal paratransit vehicles be equipped with telemetry systems (as a prerequisite to receive an operating license). This will enable the continued optimisation and balancing of service offering once a route network is introduced, as well as monitoring of driver behaviour and emissions. In addition, with the realisation of such a formalised monitoring system, operators will have a better understanding of their operational costs, which will allow them to focus on delivering an efficient and effective service. • Vehicle emissions reduction: Most informal paratransit operators choose used imported vehicles due to their affordability. DRC imposes a maximum age limit on used vehicle imports of nine years (2). There are currently no vehicle emissions standards. To reduce informal paratransit vehicle emissions, as is typical in other cities, a lower maximum age limit of between three and five years for used imported vehicles should be considered (this will result in an increase in the cost of purchasing an informal paratransit vehicle – this should be investigated thoroughly before implementing any such reforms). In addition, since the current fuel only supports a Euro 2 emissions standards, emissions compliance should be, at minimum, Euro 2. However, legislations for a more preferred compliance level (such as Euro 4) should be advocated for all new and used imported vehicles. Lastly, given the fact that much of the world’s cobalt supply, a critical element in electric vehicle batteries, is mined in the DRC (46), the Ministry of Transport through the Ministry of Public Works and Infrastructure should put forth initiatives to encourage their uptake and to support the transition to e-mobility. Lagos • Infrastructure improvements: Informal paratransit services make use of Lagos’ extensive road network and highways (80). Approximately 50% of the city’s urban roads are tarred (63), although the infrastructure is aged and poorly maintained (81). However, there is a major roadway improvement programme currently underway (63). It is proposed that, in addition to the roadway improvement programme, an informal paratransit route network expansion and infrastructure development and maintenance plan be developed. The existing roads (gravel and tar) which are in poor condition, but which are to be included in an informal paratransit route network, should be prioritised for maintenance and/or upgrade. • Capital subsidies: None of the informal paratransit services receive any form of subsidy. Should funds be available, focus be placed on a minibus taxi recapitalisation programme, in conjunction with a new centrally managed licenced informal paratransit route network. This is supported by the fact that more than a half of motorised journeys are made by minibus taxis (63), which are mostly over 15 years old and in poor condition. In addition, plans should be developed for a publicly funded EV charging network to support the future transition of both formal public transport services and informal paratransit vehicles towards e-mobility. • Business model reform: With the creation LASTMA in 2000 and LAMATA in 2002, Lagos has made significant strides in reforming its public transport environment. Lagos is not only the only city from the six cities evaluated that has a BRT system but, in 2021, through their BRI, they have also introduced microbuses to replace the less safe paratransit modes. From the aforementioned, it is evident that strong political will exists to deliver a safe and convenient public transport service. Regardless, this political will could be further extended to better integrating minibus taxi services with the newly introduced modes, by developing a transport masterplan which incorporates minibus taxi routes. • Urban transport technology reform: Lagos has achieved several technological advances including, among others, electronic payment (via The Cowry Travel Card) which applies a distance and zone-based fare using location-tracking technologies on the BRT buses. Likewise, the seven-seater feeder service microbuses have the same AFC system integrated. It is proposed that this technology be leveraged further to xxvi AFRICA URBAN MOBILITY OBSERVATORY – ROLE OF INFORMAL PARATRANSIT REPORT monitor driver behaviour (speed and acceleration), as well as emissions. To improve levels of service, it is proposed that these technologies also be introduced on informal paratransit operations as a prerequisite for license renewal. This would enable monitoring of driver behaviour, emissions, and support network optimisation. • Vehicle emissions reduction: Most paratransit operators choose used imported vehicles due to their affordability. Nigeria imposes a maximum age limit on used vehicle imports of nine years (2). There are also currently no vehicle emissions standards. To reduce informal paratransit vehicle emissions, a lower maximum age limit of between three and five years for used imported vehicles should be considered (this will result in an increase in the cost of purchasing an informal paratransit vehicle – this should be investigated thoroughly before implementing any such reforms). In addition, since the current fuel only supports a Euro 2 emissions standards, emissions compliance should be, at minimum, Euro 2. However, legislations for a more preferred compliance level (such as Euro 4) should be advocated for all new and used imported vehicles. Lastly, since the reformed fossil fuel subsidy regime yielded an annual saving to the government of approximately US$ 2 billion (82), the Ministry of Transport through LAMATA should continue to put forth initiatives (like the national automotive industry development plan) to encourage the transition to e-mobility. It is recommended that pilot studies be conducted with electric buses and microbuses, to collect data and understand the impact of EV technology on operations, in preparation for a future transition to a fully electric public transport environment. Maseru • Regulatory environment reform: There are several entities responsible for transport related matters, including MoPW&T, The Department of Traffic and Transport, and the MCC (70). It is proposed that the establishment of a metropolitan area transport authority, mandated to plan, coordinate, and manage all urban transport matters, would support the provision of a coordinated regulatory and planning environment (including the introduction of an informal paratransit licencing regime) capable of balancing supply and demand, and thereby improving levels of service and profit margins for, especially, the various paratransit operators. • Infrastructure improvements: Maseru’s roads are mostly in poor condition, with just a few being tarred (70). This has a significant impact on operating costs, since high rates of wear and tear are experienced. In addition, some outlying areas are not served by informal paratransit, leaving many communities without access to motorised transport. To address this, it is proposed that a tarred road network expansion plan be developed in conjunction with an informal paratransit route network, to enable paratransit services to access these areas more easily and efficiently. The existing roads (gravel and tar) which are in poor condition, but which are to be included in an informal paratransit route network, should be prioritised for maintenance and/or upgrade. In addition, plans should be developed for a publicly funded EV charging network to support the future transition of informal paratransit vehicles towards e-mobility. • Capital subsidies: None of the informal paratransit services receive any form of subsidy. While funding to support any form of subsidy is limited, it is proposed that should funds become available, focus should be placed on a minibus taxi recapitalisation programme, in conjunction with a new centrally managed licenced informal paratransit route network. With the dramatic increase in sedan taxis observed in a 2021 on-the-ground evaluation, this recommendation could help to alleviate their market presence as minibus taxis are more efficient in terms of energy consumption and road space. • Business model reform: In the absence of a metropolitan area transport authority to coordinate and support informal paratransit operators to reform their business models, it is proposed that this be considered as a longer-term opportunity in future. • Urban transport technology reform: Currently, none of the informal paratransit services make use of transport technologies, such as vehicle telemetry or AFC (Automatic Fare Collection). To enable the development of a minibus taxi route network, it is thus proposed that all informal paratransit vehicles be equipped with telemetry systems (as a prerequisite to receive an operating license). This will enable MoPW&T to continually optimise and balance informal paratransit services through a data driven licensing regime, as well as monitoring of driver behaviour and emissions. In addition, operators will have xxvii AFRICA URBAN MOBILITY OBSERVATORY – ROLE OF INFORMAL PARATRANSIT REPORT a better understanding of their operational costs, which will allow them to focus on delivering an efficient and effective service. Training and capacity building would be required to administer such a system effectively. • Vehicle emissions reduction: Most paratransit operators choose used imported vehicles due to their affordability. Lesotho imposes a maximum age limit on used vehicle imports of five years (2). There are currently no vehicle emissions standards. In addition, since the fuel available is already able to support Euro 4 emissions standards, Euro 4 emissions compliance should be the minimum permitted for all new and used imported vehicles. To support the transition to e-mobility, it is also proposed that MoPW&T revisits the Lesotho draft Renewable Energy Policy of 2013 and that they investigate the possibility of conducting a pilot with an electric minibus to understand how EV technology impacts on operations, as well as to calibrate total cost of ownership models. Conclusion In all six cities, informal paratransit operations perform a critical function, supporting the majority of daily trips across the evaluated cities. Generally, informal paratransit users are captive, rather than choice users, and are among some of the most vulnerable population groups in the region. In addition, operators of informal paratransit services work on incredibly slim profit margins, and levels of competition are often so high that many operations unfortunately fail after just a few years in service. High levels of inefficiency also result in higher levels of CO2 than the levels of service can justify. The fragmented nature of informal paratransit services, a lack of funding for subsidies, uncoordinated service management and delivery, and fragmented, weak regulatory and enforcement environments are all examples of contributing factors. With regard to the general condition and age of the informal paratransit vehicles across the cities, there is evidently an urgent need for reform, to help protect the safety of travellers, and to improve levels of service, and to reduce harmful emissions. Additional aspects of informal paratransit ecosystems requiring attention include road and NMT infrastructure. It should not be assumed that the solution to these challenges is to replace informal paratransit services with formal public transport services. While this may be feasible in some cities, it is highly questionable whether this would indeed be a sustainable approach, and the lack of funding to subsidise such services makes this almost impossible in most of the cities evaluated. Informal paratransit services have inherent resilience which should be recognised as a foundation upon which to build, rather than destroy. Increased support for the sector, through more active involvement from regulatory authorities, to help balance supply and demand, and thus protect the operators’ profit margins, would allow recapitalisation of fleets, and ensure more reliable levels of service. While Kigali and Lagos offer examples of how informal paratransit reform programmes could possibly be executed, it remains to be seen whether these relatively bold approaches are sustainable in the longer term. It is also questionable to what degree these approaches can be transplanted into the very different contexts found in the other cities evaluated. The importance of informal paratransit services in sub-Saharan Africa should not be underestimated. While they lack formality, with levels of service often being far from ideal, and high levels of harmful emissions, they provide an essential service, and provide an important foundation upon which to build more resilient, seamless and cleaner transport systems moving forward. 1 AFRICA URBAN MOBILITY OBSERVATORY – ROLE OF INFORMAL PARATRANSIT REPORT 1. Introduction 1.1 Report objectives This report falls under Activity Stream 2 of the HVT Africa Urban Mobility Observatory (AUMO) project. The primary objectives are to identify and evaluate the informal paratransit services operating in the six research cities (Blantyre, Gaborone, Kigali, Kinshasa, Lagos, and Maseru), to understand their operating models, to establish the roles these services play in supporting mobility, to reveal the experiences of travellers using these services, and to understand the contribution of passenger transport towards CO2 emissions. To better understand the contextual conditions in which these services operate, the regulatory environments pertaining to transport will also be reviewed. Through this study, this report aims to identify possible informal paratransit reform strategies which could improve levels of service, reduce fuel consumption and CO2 emissions, and improve operational sustainability, through enhanced management of competition and integration of services. 1.2 Report structure The report structure is visually represented in Figure 1. Section 1 continues with further background on the Africa Urban Mobility Observatory research project. Section 2 contextualises informal paratransit services and transport-related emissions, while Section 3 presents the methodology applied in gathering and evaluating information during the compilation of this report. Sections 4 to 8 each present findings from the six cities evaluated. Section 10 contains a discussion, in which the strengths and weaknesses associated with informal paratransit services across the six cities are summarised, along with factors impacting on informal paratransit emissions. Broad informal paratransit reform strategies are discussed, along with an overview of the application of such strategies in Kigali and Lagos. The section concludes with a comparison of informal paratransit services across the cities, and identification of possible reform opportunities. Finally, Section 11 concludes this report. Figure 1: Report structure 2 AFRICA URBAN MOBILITY OBSERVATORY – ROLE OF INFORMAL PARATRANSIT REPORT 1.3 Research background and objectives The Africa Urban Mobility Observatory (AUMO) research project is a component of the second phase of the United Kingdom’s Foreign, Commonwealth and Development Office (FCDO) High Volume Transport (HVT) Applied Research Programme. More specifically, in the context of the impact that urban transport planning has on climate change and inclusion in LIC (Low Income Countries) in Africa, this research intends to address the following three research questions: 1. Big Data Technology: What are the opportunities and risks of big data applications in HVT cities? 2. Informal Paratransit: What is the role of informal transport in the global South and how to enable transition towards a clean, affordable and efficient solution for HVT? 3. Policy Levers: What are the main levers for mode share and what is the role of data? 1.4 Project activity streams and deliverables overview This project comprises four interlinked Activity Streams (see Figure 2). Activity Streams 1, 2 and 3 are led by GoMetro, UN-Habitat, and Wuppertal/UEMI, respectively. Activity Stream 4 is led collaboratively. These Activity Streams run in parallel, and the outputs generated under one Activity Stream are used as inputs to the others. This report, Deliverable 4, falls under Activity Stream 2. Per the inception report (Deliverable 0), the terms of reference of this report are as follows: Figure 2: Research activity flow A total of 10 deliverables are associated with the four Activity Streams (see Table 2 for targeted submission dates, and descriptions of these deliverables). Table 2: Project deliverables per activity stream Deliverable Description Activity Stream Submission Date Deliverable 0 Inception Report (submitted) 0 31 August 2020 Deliverable 1 Brief Scoping Report (submitted) 1 30 October 2020 Deliverable 2 Launch of Big Data Application (submitted) 1 18 December 2020 3 AFRICA URBAN MOBILITY OBSERVATORY – ROLE OF INFORMAL PARATRANSIT REPORT Deliverable Description Activity Stream Submission Date Deliverable 3 Web Data Platform (submitted) 4 26 February 2021 Deliverable 4 Role of Informal Paratransit – Report (this report) 2 30 September 2021 Deliverable 5 Policy and Planning Insights – Report 2 31 December 2021 Deliverable 6a Workshop and Webinars (Introductory) 4 29 October 2021 Deliverable 6b Workshop and Webinars (Post Data Collection) 4 29 April 2022 Deliverable 7 Big Data and Technology Research Report 3 24 June 2022 Deliverable 8 Action Plans 4 26 August 2022 Deliverable 9 Peer Reviewed Journal Article 4 25 November 2022 1.5 Project systems elements The four elements of the Africa Urban Mobility Observatory technology stack are Measure, Model, Manage, Move (see Figure 3). The Big Data Application (presented in the previously submitted Launch of Big Data Application Report – Deliverable 2) supports the Measure, Model, and Manage elements, while the Web Data Platform (presented in the previously submitted Web Data Platform Report – Deliverable 3) supports the Move elements of this project; an example of which is this report (The Role of Informal Paratransit – Deliverable 4). Figure 3: GoMetro Africa Urban Mobility Observatory technology stack Measure The Measure element refers to data collection. A range of data collection technologies are being employed through the various phases of the project. These technologies include the integration of the UMA (User Movement Analytics) SDK (Software Development Kit) into third party applications, web surveys, USSD (Unstructured Supplementary Service Data) surveys, WhatsApp surveys, publicly accessible historic data, desktop research, and stakeholder interviews. 4 AFRICA URBAN MOBILITY OBSERVATORY – ROLE OF INFORMAL PARATRANSIT REPORT Model The Africa Urban Mobility Observatory interacts with large datasets and requires automated processes to analyse and process the data. The Model element hosts services for this purpose. Data from each city populate a model that targets and evaluates the importance, accuracy, completeness, and correctness of responses. Location data points are modelled to build trips, trip-chains, patterns of usage, and clusters of usage, to develop zonal data on travel time ranges and averages and origin-destination (O-D) pairs per zone. Manage The Manage element is responsible for housing services that enable project managers and data analysts to monitor both incoming and previously collected data, from a range of sources. This element allows the project team to accurately measure sampling progress per city, and per geographical area. Survey questions are defined and managed inside of this element. Move Move comprises the public facing elements of the project. Through the campaign website and the Web Data Platform, visitors are able to engage with the materials and data produced. 5 AFRICA URBAN MOBILITY OBSERVATORY – ROLE OF INFORMAL PARATRANSIT REPORT 2. Contextualisation 2.1 Informal paratransit As a result of mass migration of rural dwellers in search of opportunities, sub-Saharan Africa is experiencing rapid urbanisation (83). In the absence of formal public transport services, privately owned and operated informal paratransit services have proliferated (83). Informal paratransit services are typically “…demanddriven, unscheduled public transport provided by small operators…sometimes called ‘informal’, but operators are not always informal businesses, and they are not necessarily unregulated (p. 5)†(83). Typical informal paratransit vehicles include pedal bicycles, motorcycles, tricycles, hatchbacks, sedans, minivans, minibuses, and midi-buses (see Figure 4 to Figure 7). Figure 4: Typical informal paratransit bicycle (left) and motorcycle taxis (right) (39) (38) Figure 5: Typical informal paratransit tricycle taxis (84) Figure 6: Typical informal paratransit sedan taxis 6 AFRICA URBAN MOBILITY OBSERVATORY – ROLE OF INFORMAL PARATRANSIT REPORT Figure 7: Typical informal paratransit minibuses taxi In much of sub-Saharan Africa, informal paratransit functions as the backbone of urban passenger transport services. While attempts have been made in some more affluent cities to transition towards formal public transport services, such as Bus Rapid Transit (BRT) (e.g.: Johannesburg, Cape Town, Lagos, Addis Ababa, and Nairobi), the sheer cost of developing and operating these services means that most sub-Saharan African cities simply cannot afford to adopt this approach. In addition, many of these cities are characterised by sprawl, with informal settlements located on the urban periphery. Running sustainable, reliable, and comprehensive public transport services in these resource constrained environments is an enormous challenge. In this report, the various informal paratransit modes available in each of the six cities, their operating models, operating environments, levels of service, market share, and coverage, will be explored in detail. 2.2 Transport emissions 2.2.1 Context Globally, transport is the fastest-growing source of CO2 emissions, contributing 24% of emissions from fossil fuel combustion (2). Road vehicles account for three-quarters of transport emissions, with the balance being emitted by ships and aeroplanes – see Figure 8 (2). Aside from CO2 emissions, combusted fossil fuels produce many other harmful compounds, including SOx (oxides of sulphur), NOx (oxides of nitrogen), NMVOC (nonmethane volatile organic compounds), carbon monoxide (CO), NH3 (ammonia compounds), and particulate matter (PM). Figure 8: Global transport CO2 emissions by mode (82) In 2019, Africa had the lowest transport CO2 levels among all world regions (0.25 tonnes per capita), contributing 5% towards total global transport CO2 emissions (82). This is largely due to the region’s 7 AFRICA URBAN MOBILITY OBSERVATORY – ROLE OF INFORMAL PARATRANSIT REPORT substantial rural population, and relatively low level of private vehicle ownership (85). With rapid urbanisation, transport demand and private vehicle ownership is steadily rising, resulting in increasing emissions in the region (82). To encourage reduced fossil fuel consumption, between 2015 and 2018, 50 countries reformed their fossil fuel subsidy regimes – See Figure 9 (82). Despite this, global fossil fuel subsidies increased in 2017 (82). Of the six countries evaluated in this study, only Nigeria reformed its fossil fuel subsidy regime (82), yielding an annual saving to the government of approximately US$ 2 billion. To reduce emissions, given the heavy reliance on fossil fuels for transport, modal shift, and reduced motorised vehicle activity, remain critical. Figure 9: Fossil fuel subsidy reform (82) 2.2.2 Factors impacting on vehicle emissions Vehicle level factors which have an impact on emissions include size and weight of a loaded vehicle, frontal area and drag coefficient, fuel standards compliance, engine lubricants, vehicle age, vehicle mileage, powertrain wear, auxiliary systems (e.g.: power steering and air-conditioning), tyre condition/type, and pressure (86). External factors include driver behaviour, weather, traffic, speed, road surface, terrain, and altitude (86). As a vehicle ages and its cumulative mileage increases, powertrain components wear, resulting in decreased efficiency, due to increased fuel consumption and incomplete combustion, which in turn results in increased and more harmful emissions being produced (86). The impact of age and mileage on the NOx emissions of petrol and diesel passenger vehicles is illustrated in Figure 10 and Figure 11 respectively. It is noted that once a petrol vehicle reached around 12 years of age and 150,000 km, the NOx emissions begin to increase substantially (87). For diesel passenger vehicles, the age of the vehicle has a greater impact than the mileage, with dramatic increases occurring within the first two years, and then again after around 12 years of age (87). Similarly, CO emissions increase with increased vehicle mileage (see Figure 12). 8 AFRICA URBAN MOBILITY OBSERVATORY – ROLE OF INFORMAL PARATRANSIT REPORT Figure 10: Petrol passenger vehicle NOx emissions by mileage and age (87) Figure 11: Diesel passenger vehicle NOx emissions by mileage and age (87) Figure 12: Diesel and petrol passenger vehicle CO emissions by mileage (88) 9 AFRICA URBAN MOBILITY OBSERVATORY – ROLE OF INFORMAL PARATRANSIT REPORT 3. Methodology In this section the three-step methodology for understanding informal paratransit in the six cities is described. 3.1 Desktop Research To understand the cities specific contexts, and to develop knowledge baselines on the extent and nature of informal paratransit operations, the corresponding regulatory environments, and the environmental impact of passenger transport services in the six research cities, desktop research was conducted. Source materials reviewed included legislation, transport policies and improvement plans, census data, and various transport related reports published by NGOs and consulting firms across the region, including those of GoMetro. Findings have been divided into the following four categories: • City overview: Location, population size and density, employment statistics, GDP per capita, and other points of interest; • Urban transport services overview: Summary of all public and informal paratransit modes available; • Regulatory environment: Governance and enforcement models, transport improvement plans and policies, and informal paratransit memberships and associations; • Informal paratransit services analysis: Informal paratransit services overview and detailed analyses, evaluating supply and demand, fares and business models, network characteristics, fleet characteristics, and facilities. 3.2 Stakeholder engagements To close knowledge gaps remaining after the desktop research was concluded, a series of stakeholder engagements was conducted. A questionnaire informed by the gaps identified was produced, tailored for each city, and then sent to various stakeholders in the cities. Where possible stakeholders were interviewed via virtual meetings, while others responded in writing. The questionnaire template can be found in Appendix A: . 3.3 Africa Urban Mobility Observatory Data Data from the Africa Urban Mobility Observatory Web Data Platform (presented in Deliverable 3: Web Data Platform, submitted on 26 February 2021), was used to draw insights into mobility patterns and passenger experiences of respondents to the AUMO intercept surveys. The number of data points currently in the Web Data Platform per city is specified in Table 3. Table 3: AUMO data points City Number of Respondents Data Collection Period Blantyre 605 Phase 1 (August 2021) Gaborone 657 Phase 1 (August 2021) Kigali 559 Phase 1 (August 2021) Kinshasa 762 Phase 1 (August 2021) Lagos 562 Phase 1 (August 2021) Maseru 567 Phase 1 (August 2021) The Africa Urban Mobility Observatory supports a wide range of data collection tools informing modal split. These include: 10 AFRICA URBAN MOBILITY OBSERVATORY – ROLE OF INFORMAL PARATRANSIT REPORT • User Movement Analytics (UMA): smartphone app integration, which is able to infer mode of travel through analysis of telemetry data received from app users who have chosen to participate in the campaign; • Digital Surveys: surveys conducted via Unstructured Supplementary Service Data (USSD), WhatsApp and web, which explicitly ask respondents to confirm their main mode of travel (the mode which they usually use to cover the most distance for frequent trips); • Face-to-Face Intercept Surveys: digital surveys administered by enumerators at multiple key transport interchanges and activity centres across the cities. Passenger experience data is collected via digital Face-to-Face intercept surveys, supporting the following indicators: • Crime while travelling on public and informal paratransit; • Public and informal paratransit driver behaviour; • Levels of comfort of public and informal paratransit services; • Reliability of public and informal paratransit services; • Experienced and/or witnessed sexual harassment while traveling on public or informal paratransit. While informal paratransit services typically do not adhere to a schedule, passengers do however have a perception on the degree to which such services are reliable, in terms of their ability to predict departure times within a reasonable margin of error (which reduces the need to include excessive waiting time buffers in their travel itineraries to accommodate variability in operations). It is important to note however that at the time of compilation of this report, only Face-to-Face intercept survey data was available, and as a result, the sample size and distribution is insufficient to draw approximations applicable to mobility patterns and experiences of the entire population across each city. The questionnaire used to collect mobility and user experience data can be found in Appendix A: . 11 AFRICA URBAN MOBILITY OBSERVATORY – ROLE OF INFORMAL PARATRANSIT REPORT 4. Blantyre findings 4.1 City overview Blantyre, situated in the southern region of Malawi, is the second largest city in the country, with a recorded population size of 800,264 in 2018 – see Figure 13 (7). While not the capital city, it is the commercial and industrial hub of the country (7). Sixteen percent of the land use is occupied by commercial development, with the remainder being residential. Over 70% of the population lives in informal settlements, which lack social infrastructure and basic services (7) – see Figure 14. Forty-two percent of Blantyre residents are employed by the private sector, while 36% are self-employed (7). Figure 13: Blantyre location (89) 12 AFRICA URBAN MOBILITY OBSERVATORY – ROLE OF INFORMAL PARATRANSIT REPORT Figure 14: Informal settlement in Blantyre (9) 4.2 Urban transport services overview 4.2.1 Modal split In August 2021, 605 respondents across Blantyre participated in an intercept survey, in which enumerators asked questions about their travel behaviour and experiences while travelling in the city. The survey was conducted over a period of three days and was administered at major transport interchanges and informal paratransit ranks. Modal split was calculated from this data, and the results are presented in Figure 15. A comprehensive list of transport services available in the city is presented in Table 4. Figure 15: Blantyre transport modal split (90) Table 4: Passenger transport modes in Blantyre Mode Present Description NMT Yes Despite NMT modes being dominant, there is a general lack of NMT facilities in Blantyre, resulting in unsafe mixing of pedestrians and motorised traffic (15). Metered Taxi Yes Taxicabs operate in Blantyre, catering mostly to business professionals and tourists (91). They do not, however, have physical meters installed, and instead 14.88% 2.48% 7.44% 71.40% 3.80% Blantyre Transport Modal Split (AUMO Survey Data - Main Mode of Transport) Walking Cycling Private Transport (Private Car/Metered Taxi) Minibus Taxi (Informal Paratransit) Sedan Taxi (Informal Paratransit) 13 AFRICA URBAN MOBILITY OBSERVATORY – ROLE OF INFORMAL PARATRANSIT REPORT Mode Present Description rely on the vehicle odometer to monitor distance travelled; the basis on which fares are then negotiated (16). There are no e-hailing services currently available (16). Passenger Rail Yes Malawi’s rail network is primarily used for freight movement (7). Passenger rail is limited to inter-city services, with limited coverage and poor reliability. Bus Yes At present, buses operate long-distance inter-city services only (7). BRT No There is no BRT service currently operating in Blantyre. Ferries/Boats No There is no ferry/boat service currently operating in Blantyre. Informal Paratransit Yes Informal paratransit services operating in Blantyre include minibus taxis, sedan taxis, motorcycle taxis, and bicycle taxis (16). Note that at the time the surveys were conducted, it was not known that motorcycle and bicycle taxis operate in the city. This will be addressed during future data collection rounds. 4.2.2 Environmental impact Worldometer CO2 emissions trends (disaggregated by sector) observed over a 40-year period, from 1970 to 2010, for Malawi can be seen in Figure 16. According to Worldometer, the sources of this data are as follows: Emission Database for Global Atmospheric Research (EDGAR); CO2 Emissions from Fuel Combustion - IEA; World Population Prospects: The 2019 Revision - United Nations Population Division (92). Figure 16: Malawi CO2 emissions (tons) over 40 years (92) At a national level, per 2018 World Bank records, 1,570 kilotons of CO2 emissions were produced by Malawi, which translates to 0.087 metric tons per Capita; a relatively low value compared with the other six countries evaluated (1). Malawi ranks among the top 20 countries globally on the ambient air pollution index, at 67.38 ug/m3 (2). Malawi is Africa’s second country to adopt carbon tax, after the continent’s highest emitter, South Africa. The tax acts as a carbon pricing mechanism to raise funds to drive climate change mitigation and adaptation actions at both the national and community level. Introduced in 2019, the levy targets motorists only, excluding other activities that also use fossil fuel, such as burning of coal for electricity, and even deforestation, per United Nations guidelines (93). It is unclear what impact this levy is having, since the most recent CO2 data which could be found was World Bank’s 2018 data (1). 14 AFRICA URBAN MOBILITY OBSERVATORY – ROLE OF INFORMAL PARATRANSIT REPORT Malawi imposes no restrictions on used vehicle imports, with the average age of imported used petrol and diesel vehicles being nine years and 18 years respectively in 2015 (3). There are currently no vehicle emissions standards in Malawi (3). Diesel fuel available currently has a sulphur content maximum of 50 ppm (parts per million), which would support Euro 4 compliance, should this be legislated in future (4). 4.2.3 E-mobility initiatives and electricity generation MicroMek, a Malawian hardware manufacturer, produces low-cost electric aerial drones to carry essential medical supplies to remote communities across Malawi and across the rest of Africa (5). At present, there are no known passenger e-mobility initiatives in Malawi. Ninety-four percent of electricity in Malawi is generated through hydropower (6), and therefore a transition to e-mobility would dramatically reduce transport related emissions. 4.3 Regulatory and lobbying environment 4.3.1 Governance and enforcement Transport planning and regulation falls under the mandate of the Ministry of Transport and Public Works (MoTPW) (7). The Directorate of Road Traffic, the regulatory arm of the MoTPW, is responsible for all road transport-related matters (8). Blantyre City Council is mandated by the Local Government Act of 1998 to provide and manage social infrastructure and basic urban services, which includes roads provision and maintenance (9). Blantyre City Council is supported by the Ministry of Lands and Housing, Ministry of Works, Roads Authority, Malawi Police Service, and the Ministry of Local Government and Rural Development (10). The main transport regulatory instruments include the Local Government Act of 1998, the Town and Country Planning Act of 1988, the Cross-Border Road Transport Act No 4 of 1998, the Public Roads Act of 1962, the Urban (Public and Private Streets) Act of 1956, the Road Traffic Act of 1997, the Road Traffic Regulations of 1997, the National Roads Authority Act of 1997, and the Malawi Road Transporters Authority Act of 1970 (8). These instruments are supplemented by the Blantyre City Council Bylaws (16). The Road Traffic Act of 1997 covers road traffic management and safety, including registration and licensing of vehicles, issuing of driver’s licences, road regulations and signals, speed limits, parking fees, and compulsory third-party insurance requirements (8). Minibus taxis must comply with rules administered by the Directorate of Road Traffic, relating to licensing and registration, as well as conduct (94). Enforcement of traffic rules and regulations is reportedly poor, with evasion of legal and financial penalties commonplace (15) (16). 4.3.2 Environmental protection Malawi has put in place a series of legislative sectoral frameworks and strategies to integrate environment and climate change management in socio-economic development activities (11). At a national level, the Ministry of Natural Resources and Environmental Affairs is responsible for environmental protection (12). An overview of the most prominent legal instruments concerning environmental protection follows. The country’s first significant policy document on environmental issues was the National Environmental Action Plan published in 1994 (revised in 2004) (13). Subsequently, a framework environmental law, the Environmental Management Act was enacted in 1996. A second Environmental Management Act was approved by the President in 2017. This Act provides for a coordinated and comprehensive future legal framework for environmental protection and management as well as the conservation and sustainable use of natural resources (13). The mandate for the National Environmental Policy and the National Climate Change Management Policy is derived from the Constitution of Malawi, 1995 (12) (11). The Government of Malawi adopted the National Environmental Policy in 1996 to provide guidance and to set standards for development of sector policies in environment and natural resources. This includes, among others, the promotion of transport and infrastructure that is environmentally friendly (12). The National Climate Change Management Policy is a key instrument used in managing climate change with the main goal of promoting climate change adaptation, mitigation, technology transfer and capacity building for sustainable livelihoods through Green Economy 15 AFRICA URBAN MOBILITY OBSERVATORY – ROLE OF INFORMAL PARATRANSIT REPORT measures. One of the outcomes of this policy is to, in general, reduce greenhouse gas emissions (11). While Malawi does have a National Adaptation Plan Framework, the reduction of transport related emissions is not dealt with in this document (14). 4.3.3 Improvement plans and policies There have been several transport sector improvement plans over the past two decades, including the Road Sector Programme (RSP) 2010 to 2020, the Transport Sector Investment Programme (TSIP) of 2012, the Roads Authority’s (RA) Five Year Strategic and Business Plan 2011 to 2016, the Strategic Plan for the Ministry of Transport and Public Works (MoTPW), the Malawi National Transport Policy of 2015, the Malawi National Transport Master Plan (NTMP) 2017 to 2037, the Blantyre Urban Structure Plan 2000 to 2014, the Malawi Growth and Development Strategy (MGDS) 2011 to 2016, and the MGDS III of 2017 (15) (7). For the MGDS 2011 to 2016, poverty reduction remains the main objective. This is to be achieved through sustainable, private-sector driven economic growth and infrastructure development (8). For the NTMP 2017 to 2037, the main objective is to reduce transport costs and ensure that transport does not constrain the economy (7). Plans are underway for the construction of a new Blantyre bus terminal (9) to support the re-introduction of city buses (16). Passenger rail services are also being investigated (16). A road rehabilitation programme is underway, which includes the upgrading of several key roads linking Blantyre to neighbouring towns and villages (8). The NTMP estimates that by 2025 50% of new vehicles manufactured globally will be electric vehicles (7). Therefore, although a high proportion of vehicles entering the country are imported used, resulting in a slight technology lag, the NTMP highlights that Malawi will need to prepare for this transition. Electricity in Blantyre is expensive and unreliable, with frequent power outages (9). 4.3.4 Memberships and associations Informal paratransit association membership is voluntary in Blantyre (7). Minibus taxis mostly belong to the Minibus Owners Association of Malawi (MOAM), a members’ funded association, which helps to manage routes to avoid over-saturation of service, coordinate strike action among members, and government lobbying (17). In addition, MOAM coordinates fares among members, however this is in breach of the Competition and Fair Trade Commission regulations, and in 2012 was ordered to cease what was described as anti-competitive business practices (18). Sedan taxis and motorcycle taxis are not officially recognised by MoTPW, and therefore lack legal authorisation to operate. Consequently, at present there are no official sedan taxi or motorcycle taxi associations (16). 4.3.5 NGOs and lobby groups There are no known transport specific NGOs or lobby groups in Blantyre (16). The Young Feminist Network Malawi (YFN) did however participate in an HVT sister project, HVT EMPOWER. Under this programme, a decision support tool is being developed to aid with decision making by various stakeholders in the transport sector, to help curb sexual harassment while traveling in sub-Saharan African cities (19). YFN Malawi participated in several rounds of stakeholder engagement and data collection. 4.4 Informal paratransit services analysis 4.4.1 Overview Passenger demand, supply, accessibility and LOS Over the next 20 years, it is estimated that private transport demand in Malawi will grow by 3.5% per annum, while informal paratransit demand is expected to grow by 3.2% per annum (7). Key drivers of this anticipated increase are projected population and economic growth, and increased levels of employment (7). Road infrastructure in Blantyre, especially on the urban periphery in low-income areas, is poor (15). Minibus taxis are the dominant informal paratransit service operating in Blantyre (7), although, as also seen in other sub-Saharan African cities, sedan taxis are becoming increasingly common (95). Motorcycle taxis (known as 16 AFRICA URBAN MOBILITY OBSERVATORY – ROLE OF INFORMAL PARATRANSIT REPORT kabaza) and bicycle taxis are not permitted to operate in the city centre (16). They do, however, operate on the periphery of the city, providing an essential supplementary feeder service to the main informal paratransit modes (16). See Figure 17 for examples of these informal paratransit services. During peak periods, minibus and sedan taxis load passengers at informal paratransit ranks, and typically run on a fill-and-go basis (7). Traffic congestion during peak periods is severe, with typical average speeds as low as 19 km/h (7). Figure 17: Informal paratransit vehicles in Blantyre: minibus taxis, sedan taxis, bicycle taxis and motorcycle taxis Network Characteristics Of the 15,415 km national road network, 4,405 km (around 29%) is tarred (94). Although there are more tarred roads in urban areas, they are generally in poor condition (94). Untarred roads are in especially poor condition (94), with dusty, uneven surfaces, and potholes, to the extent that minibus and sedan taxis mostly avoid untarred roads altogether (16). As a result, poorer communities residing on the urban periphery are reliant on motorcycle and bicycle taxis. During the rainy season, accessibility issues are increased. Tarred roads are not adequately maintained, due to insufficient funding (7). Facilities There are few dedicated informal paratransit facilities in Blantyre (most of which are located in the CBD and Limbe); minibus and sedan taxis therefore mostly use open spaces as makeshift ranks (see Figure 18) (16). The few facilities that do exist are in poor condition, and lack pedestrian infrastructure, shelter, or seating (16). Figure 18: Makeshift rank in Blantyre (7) 4.4.2 Minibus Taxis Minibus taxis run between several ranks across the city, most of which are makeshift (96). Upon arriving at these facilities, they join queues, and typically operate on a fill-and-go model. Queue marshals (known as call boys), have significant influence over which vehicles receive loading priority. In addition, in the absence of 17 AFRICA URBAN MOBILITY OBSERVATORY – ROLE OF INFORMAL PARATRANSIT REPORT regulation of fares, queue marshals often have the power to dictate fares drivers may charge, resulting in tension between operators and queue marshals. Fares tend to vary throughout the day, depending on the period of travel (peak or off-peak), as well as the cost of fuel, however they do remain relatively stable due to the influence of queue marshals (96). Most minibus taxis in Blantyre are not driven by owners, and typically operate on a target-based business model (16) – see glossary of terms for further details on this business model. Fares are not regulated, resulting in a demand-driven variable fare regime (7). Fares are predominantly distance-based, although some operators run with a route-based fare instead (16). All fares are cash-based, and no tickets or receipts are provided to passengers (16). According to the 2016 National Transport Masterplan of Malawi (7), minibus taxi fares are far higher than in neighbouring countries, with many users spending up to 40% of their gross income on transport. To operate a minibus taxi in Blantyre, vehicles must be registered with the city council, and licences must be renewed on an annual basis (96). Minibus taxis are not permitted to operate more than 150 km from the city centre (96). They therefore support mostly shorter trips across the city. The lack of service on the periphery of the city is compounded by poor road conditions, which limits the ability of minibuses to access many residential areas (96). Where minibuses do serve areas with poor road conditions, they tend to charge premium fares (96). Minibus taxi routes are not regulated, making it difficult to match supply with demand (7). In the absence of balanced supply and demand, profit margins are slim, and therefore fleets are generally old (16). Minibuses are typically imported used from the Far East, with popular vehicle brands include Toyota, Nissan, and Mazda. Formally trained vehicle mechanics are scarce, and tyres and spare parts are very costly, resulting in vehicles being poorly maintained (16). Aside from being unreliable, as result, many minibus taxis are unroadworthy, and fines are regularly issued by traffic police (16). These fines, typically ranging between GBP 5 to GBP 10, are settled by the drivers, rather than the operators. It is understood that law enforcement does have sufficient capacity to curb these violations, however bribery is allegedly commonplace, and as a result, it is more lucrative for officers to continue issuing fines and accepting bribes to reduce these fines, than to enforce the full value of the fine (16). In addition, while operators are technically responsible for maintaining the vehicle, since it is the drivers who pay the fines/bribes, they are not directly impacted by their failure to ensure their vehicles are roadworthy (16). As a result of these systemic failures, older unroadworthy and heavily polluting informal paratransit vehicles continue to be abundant (16). 4.4.3 Sedan taxis Sedan taxis have emerged in Blantyre only over the past decade, although they are not officially recognised by MoTPW, and therefore operate illegally (16). Since they are able to blend in with private vehicles, much of the time traffic police are unable to verify whether they are indeed sedan taxis, and therefore are able to continue operating illegally (16). In the past, traffic police would monitor their activities more closely, and issue fines if caught dropping off and picking up passengers in quick succession. More recently, greater leniency has been witnessed, as it is becoming increasingly accepted that they are performing a critical role in providing transport in the city (16). Most sedan taxis in Blantyre are not driven by owners, and typically operate on a target-based business model (16) – see glossary of terms for further details on this business model. Fares are not regulated, resulting in a demand-driven variable fare regime (7). Sedan taxi fares are predominantly distance-based, and are cashbased, with no tickets or receipts being provided to passengers (16). Sedan taxis operate a shared-taxi service, and during peak periods typically operate from the same makeshift ranks as the minibus taxis. They do not follow fixed routes, and roam for passengers during off-peak periods (16). Sedan taxis fares are around 15% more than those of minibus taxis but are generally preferred by passengers due to shorter loading times, and better comfort (16). As with minibus taxis, in the absence of balanced supply and demand, sedan taxi operators’ profit margins are slim, and therefore fleets are generally old (16). Used imported hatchbacks and seven-seater minivans from the Far East, such as the Toyota Sienta, Honda Freed, and Nissan Wingroad are most common (16). The lack of 18 AFRICA URBAN MOBILITY OBSERVATORY – ROLE OF INFORMAL PARATRANSIT REPORT formally trained vehicle mechanics, and high cost of spares results in poor maintenance of sedan taxis, although they do tend to be newer, more reliable, and more comfortable than minibus taxis (16). 4.4.4 Motorcycle and bicycle taxis Motorcycle taxis (kabaza) and bicycle taxis are not officially recognised by MoTPW and are prohibited from entering the city centre (16). Many motorcycle taxis however still do enter the city, and thus frequently clash with law enforcement (16). Most motorcycle taxis operate on the periphery of the city, providing an essential supplementary feeder service to the main informal paratransit modes (16). Motorcycle associations typically levy charges to the motorcycle taxi drivers, in exchange for occasional training, basic safety equipment (such as reflective jackets and reflectors), and transport to hospital in the event of a collision (7). The extent to which these benefits are realised are said to be limited however, with many operators demanding more value from associations (7). 4.5 AUMO data analysis 4.5.1 Mobility data The insights drawn from the AUMO Mobility Survey Data (considering mode share and travel time, disaggregated by income level and gender, on public and informal paratransit services) in Blantyre are reviewed in this sub-section. It should be noted that since the desired sample size was not reached in Blantyre (as only intercept data was available – see Section 3.3 for further details), these results should not be interpreted to be reflective of the entire population of the city. Among the top two income brackets (see Figure 19, below), close to 50% of survey respondents use minibus taxi, indicating that there are informal paratransit users in Blantyre who are in fact ‘choice users’ rather than ‘captive users’. This is an encouraging finding since minibus taxis are far more efficient than private motorised modes of transport. Figure 19: Blantyre mode share by income level It is apparent that women who responded to the survey spend on average around two minutes more per day travelling than men (see Figure 20). Note that there were no non-binary respondents. 0% 20% 40% 60% 80% 100% 0 - 99 USD 100 - 249 USD 250 - 499 USD 500 - 999 USD 1000 - 1999 USD 2000 plus USD Blantyre Mode Share by Income Level Walking Cycling Private Transport Minibus Taxi Sedan / MPV Taxi 19 AFRICA URBAN MOBILITY OBSERVATORY – ROLE OF INFORMAL PARATRANSIT REPORT Figure 20: Blantyre travel time by gender It is interesting to note that private transport respondents spend slightly more time travelling than those who reported using minibus taxis (see Figure 21). Even more surprising, sedan taxi respondents spend substantially more time travelling than minibus taxi respondents, despite sedan taxis typically being more flexible in terms of route profile than minibus taxis. This could be a result of the meandering nature of shared sedan taxi trips, in comparison to the more direct nature of minibus taxi operations. Figure 21: Blantyre travel time by mode 4.5.2 User experience data The insights drawn from the AUMO Survey Data (considering crime, driver behaviour, comfort, and sexual harassment on public and informal paratransit services) in Blantyre are reviewed in this sub-section. As illustrated in Figure 22, 55% of respondents in Blantyre stated that they have never experienced or witnessed crime while travelling, 29% of respondents however reported experiencing or witnessing crime while travelling more than once. 0 20 40 60 80 100 Male Female Average Travel Time (minutes) Blantyre Travel Time by Gender 0 20 40 60 80 100 Walking Minibus Taxi Sedan / MPV Taxi Private Transport Cycling Average Travel Time (minutes) Blantyre Travel Time by Mode 20 AFRICA URBAN MOBILITY OBSERVATORY – ROLE OF INFORMAL PARATRANSIT REPORT Figure 22: Blantyre crime on public and informal paratransit (90) As illustrated in Figure 23, while the majority of respondents feel that driver behaviour is acceptable, a significant proportion (41%) stated that driver behaviour is poor. Figure 23: Blantyre public and informal paratransit driver behaviour (90) As illustrated in Figure 24, while the majority of respondents feel that comfort levels are acceptable, many (37%) stated that comfort is poor. 55.04% 8.76% 28.93% 7.27% Blantyre Crime on Public and Informal Paratransit - Occurrence Never Once More Than Once Often 55.70% 40.50% 3.80% Blantyre Public and Informal Paratransit Driver Behaviour Poor Acceptable Excellent 21 AFRICA URBAN MOBILITY OBSERVATORY – ROLE OF INFORMAL PARATRANSIT REPORT Figure 24: Blantyre public and informal paratransit comfort (90) As illustrated in Figure 25, for a large majority (63%) of respondents, services usually run late. Conversely, 27% of respondents stated services usually run on time, indicating an unusually divergent travel experience among respondents. Figure 25: Blantyre public and informal paratransit reliability (90) As illustrated in Figure 26, while 58% of respondents stated that they had never seen or experienced sexual harassment while travelling, 42% reported that they had, indicating that sexual harassment is relatively prevalent on public and informal paratransit services in the city. In addition, since the definition of what people classify as sexual harassment varies considerably, it is possible that those that claimed to have never seen or experienced sexual harassment, may actually have seen or experienced sexual harassment, but perhaps only consider sexual harassment to refer to the more violent forms. 36.92% 59.34% 3.74% Blantyre Public and Informal Paratransit Comfort Poor Acceptable Excellent 9.92% 62.98% 27.11% Blantyre Public and Informal Paratransit Reliability Usually Late Usually On Time Always On Time 22 AFRICA URBAN MOBILITY OBSERVATORY – ROLE OF INFORMAL PARATRANSIT REPORT Figure 26: Blantyre public and informal paratransit sexual harassment (90) 58.35% 10.74% 25.79% 5.12% Blantyre Public and Informal Paratransit Sexual Harassment - Occurrence Never Once More Than Once Often 23 AFRICA URBAN MOBILITY OBSERVATORY – ROLE OF INFORMAL PARATRANSIT REPORT 5. Gaborone Findings 5.1 City Overview Gaborone, the economic and legislative capital of Botswana, is situated in the southeast of the country, 15 km from the South African border (97) – see Figure 27. According to the national population census conducted in 2011, Botswana has a population of 2.3 million, of which 231,592 reside in Gaborone; this is projected to grow to 292,656 by 2023 (98). The national unemployment rate recorded in 2015-2016 was estimated at 17.7% (99). Figure 27: Gaborone location (89) 5.2 Urban transport services overview 5.2.1 Modal split In August 2021, 657 respondents across Gaborone participated in an intercept survey, in which enumerators asked questions about their travel behaviour and experiences while travelling in the city. The survey was conducted over a period of three days and was administered at major transport interchanges and informal paratransit ranks. Modal split was calculated from this data, and the results are presented in Figure 28. A comprehensive list of transport services available in the city is presented in Table 5. 24 AFRICA URBAN MOBILITY OBSERVATORY – ROLE OF INFORMAL PARATRANSIT REPORT Figure 28: Gaborone transport modal split (90) Table 5: Passenger Transport Modes in Gaborone Mode Present Description NMT Yes Segregated sidewalks can typically be found along primary roads, although there are no cycling facilities. There are limited NMT facilities in residential areas. Way-finding signage for pedestrians does not exist, and traffic lights typically do not have pedestrian signals (79). Metered Taxi Yes Metered taxis operate in the city and can be summoned by calling the corresponding driver via their mobile phone (79). Passenger Rail Yes The passenger train is operated by Botswana Railways and is known as the “BR Express". It functioned primarily as an intercity service but was put on hold shortly after the COVID-19 pandemic spread to Botswana (i.e. in March 2020) (28). Bus Yes There are a wide range of bus sizes and operations in the city, ranging from 25-seater midi-buses, to larger 12m buses 60 or more seats (79). They are privately operated, and mostly provide intercity services (28). BRT No There is no BRT service currently operating in Gaborone. Ferries/Boats No There is no ferry/boat service currently operating in Gaborone. Informal Paratransit Yes Informal paratransit services consist of minibus taxis and sedan taxis (28). 5.2.2 Environmental impact Worldometer CO2 emissions trends (disaggregated by sector) observed over a 40-year period, from 1970 to 2010, for Botswana can be seen in Figure 29. According to Worldometer, the sources of this data are as follows: Emission Database for Global Atmospheric Research (EDGAR); CO2 Emissions from Fuel Combustion - IEA; World Population Prospects: The 2019 Revision - United Nations Population Division (92). 4.72%0.00% 7.31% 0.00% 86.61% 1.37% Gaborone Transport Modal Split (AUMO Survey Data - Main Mode of Transport) Walking Cycling Private Transport (Private Car/Metered Taxi) City Bus Minibus Taxi (Informal Paratransit) Sedan Taxi (Informal Paratransit) 25 AFRICA URBAN MOBILITY OBSERVATORY – ROLE OF INFORMAL PARATRANSIT REPORT Figure 29: Botswana CO2 emissions (tons) over 40 years (92) At a national level, per 2018 World Bank records, 8,210 kilotons of CO2 emissions were produced by Botswana, which translates to 3.642 metric tons per Capita – the highest value of all six countries evaluated, by a considerable margin (1). 2015 figures suggest that transport was responsible for producing 2,430 kilotons of CO2 (20). Despite this, Botswana ranks among the top 20 countries globally on the ambient air pollution index, at 63.45 ug/m3 (2). Botswana imposes no restrictions on used vehicle imports, and the average age of imported used vehicles is unknown. Diesel fuel available currently has a sulphur content maximum of 50 ppm (parts per million), which would support Euro 4 compliance, should this be legislated in future (4). 5.2.3 E-mobility initiatives and electricity generation National electric mobility promotion strategy for Botswana In March 2021, The Ministry of Tertiary Education, Research, Science and Technology (MoTE) of Botswana, released an RFP (request for proposal) through UNDP (United Nations Development Programme), for assistance with the development of a National Electric Mobility Promotion Strategy for Botswana (21). Aligned with Botswana President Mokgweetsi Masisi desire for Botswana to play an integral role in the global electric mobility transition (21), the RFP indicates that the e-mobility strategy must promote the following core objectives: • Strengthen institutional framework to support electric mobility in Botswana; • Development and manufacturing of e-mobility products in Botswana; • Develop institutional capacity through rapid skills development programmes during the development and deployment of the e-mobility in Botswana; • Attract investment and private sector participation in e-mobility deployment in Botswana. Manganese mining Giyani Metals, a mining company based in Botswana, supplies manganese to electric vehicle battery manufacturers globally (22). Locally manufactured electric vehicle In March 2021, Baylee Enterprises, a private bus bodybuilder headquartered in Gaborone, announced its plan to manufacture an electric vehicle in Botswana from August 2021 (23). It is understood that the vehicle was undergoing compliance certification at the time of this announcement (24). 26 AFRICA URBAN MOBILITY OBSERVATORY – ROLE OF INFORMAL PARATRANSIT REPORT Electricity generation At present just 2% of Botswana’s electricity is generated from renewable sources of energy, however per the 2020 – 2040 Integrated Resource Plan, Botswana’s national government aims to increase this to 15% by 2030 (25). 5.3 Regulatory and lobbying environment 5.3.1 Governance and enforcement The Ministry of Transport and Communications (MT&C), with the support of the Department of Road Transport and Safety (DRTS), and the Botswana Police Service Traffic Department, is responsible for transportrelated matters in the city. This includes the provision of roads and infrastructure, supported by Gaborone City Council (GCC). The Motor Vehicle Accident Fund falls under the jurisdiction of the Ministry of Finance and Economic Planning (MFEP). MT&C described the existing institutional and regulatory environment for public passenger transport inefficient and lacking in coordination (79). The Government of Botswana (GoB) experiences difficulty in enforcing good operating practices. Other than limited management of public transport infrastructure, such as stops and terminals, GCC has little influence over transport operations within its jurisdiction. The main transport regulatory instruments include the Road Traffic Act of 1975, Road Transport (Permits) Act of 1973, Road Transport (Permits) (Amendment) Regulations of 2004 and Motor Vehicle Accident Fund Act of 1998 (79). Under the Road Transport Act, approximately 436 routes are designated ‘permitted routes’, of which 156 (35%) are ‘scheduled routes’ operated by the formal bus sector, and 280 routes (65%) are ‘local routes’, operated by the informal minibus taxi sector. Ninety-five of the 156 ‘scheduled routes’ are designated ‘commuter routes’, with further permits allocated to informal minibus taxi operators (who are not required to operate on a schedule). DRTS is responsible for issuing and monitoring public transport permits, as well as managing vehicle registration and licensing, vehicle roadworthy examinations, driver training, examination and licensing, transport permits, registration and inspection of driving schools, and control of public passenger and freight transport vehicles (29). Law enforcement, including public transport inspection, is supported by the Botswana Police Traffic Department. Permit infringements are reportedly common since there is a lack of capacity and coordination to enforce adherence (29). 5.3.2 Environmental protection At a national level, the Ministry of Environment, Natural Resources Conservation and Tourism is responsible for environmental protection (26). Air quality management is largely regulated through the Atmospheric Pollution Prevention Act of 1971, which is supplemented by the Environmental Impact Assessment Acts of 2005 and 2010, and the Ambient Air Quality - Limits for Common Pollutants of 2012 (26). The Atmospheric Pollution Prevention Act of 1971 was proclaimed to prevent the pollution of the atmosphere through emissions from industrial processes. The Act empowers the Air Pollution Control Officer, appointed by the Minister, to sanction any unauthorised person who carries out an industrial process capable of causing or involving the emission, into the atmosphere, of objectionable matter within a controlled area. Those found in contravention could be fined or imprisoned for a period of six to 12 months, or both, depending on whether it is a first or second conviction (26). The Environmental Impact Assessment Acts of 2005 and 2010 define the Department of Environment and Conservation (renamed as Department of Environmental Affairs) as the competent authority responsible for administering and controlling activities in the country. The Act provides for the assessment of the potential effects of planned developmental activities (including post realisation monitoring and evaluation) with a view to determine and provide mitigation measures for any significant adverse effects on the environment (26). The Ambient Air Quality specifies the limits for common air pollutants to ensure that the negative effects of such pollutants on human health and the environment are prevented or reduced. Emissions may not exceed levels specified in the Botswana Bureau of Standard’s Limits for Common Pollutants of 2012 (26). 27 AFRICA URBAN MOBILITY OBSERVATORY – ROLE OF INFORMAL PARATRANSIT REPORT Botswana has a National Adaptation Plan Framework; however the reduction of transport related emissions is not dealt with in this document (27). 5.3.3 Improvement plans and policies Although there are no transport improvement plans currently active, plans with a two-to-three-year horizon are currently being drafted, and are expected to be approved by the end of 2021 (28). These plans include the Greater Gaborone transport master plan, as well as a feasibility study for new scheduled bus service for Greater Gaborone, and a pedestrian facility improvement plan. At present there are no plans or policies handling the transition to electric mobility, although it is understood that this policy gap should be closed by 2022 (28). 5.3.4 Memberships and associations There is only a single taxi association in the city of Gaborone, the Gaborone Taxi Association; membership by minibus and sedan taxi operators is voluntary (29). Formal bus operators belong to the Botswana Bus Operators Association (BOBOA). 5.3.5 NGOs and lobby groups The Botswana Council of Non-Governmental Organizations (BOCONGO) is the national umbrella body for nongovernmental organisations in Botswana (30). The Society of Road Safety Ambassador (SORSA) is an NGO which aims to curb road accidents, especially those involving Botswana’s youth (30). Recent campaigns and events include fatigue management training, African Network for Walking and Cycling Forum webinar, Safe Systems Approach and Speed Management Training, and Scholar Patrol Training. 5.4 Informal paratransit services analysis 5.4.1 Overview Passenger demand, supply, accessibility and LOS There are close to 182,000 daily trips across Gaborone, of which 97% are local movements within the city; the remainder are between Gaborone and satellite villages and nearby towns (inclusive of Molepolole, the thirdlargest settlement in Botswana) and the Kweneng District (79). According to the Fare Review Consultancy Study (79), Gaborone has the highest mobility rate of all the towns and cities in Botswana. There are two modes of informal paratransit in the city of Gaborone, minibus taxis and sedan taxis (see Figure 30). Figure 30: Informal paratransit vehicles in Gaborone: minibus taxis (left) and sedan taxis (right) Fifty-six percent of operating permits issued across the transport sector are allocated to minibus taxi operations, while sedan taxis receive 37%, and large buses, 7% (79). This is inclusive of permits issued for school buses, staff transport vehicles, and chauffeur services. Since there is no coordinated planning guiding the approval of permit applications by DRTS, the market is over-saturated; levels of competition are so severe between operators (and across paratransit modes) that the financial sustainability of these operations is under threat. Levels of service are highly inconsistent and 28 AFRICA URBAN MOBILITY OBSERVATORY – ROLE OF INFORMAL PARATRANSIT REPORT unpredictable across the city. Infrastructure is under-developed in many parts of the city, resulting in operators avoiding many areas altogether, particularly in areas with low population densities. In this financially constrained environment, paratransit fleets are characterised by aging vehicles, with poor levels of reliability and comfort, and are typically poorly maintained, resulting in increased levels of air pollution (29). Although Fifth Schedule regulations states that timetables and lists of fares should be on display in every informal paratransit vehicle, it has been found that only long-distance services comply with this requirement (29). Most informal paratransit services instead operate on a fill-and-go system, where they only depart once they reach their maximum passenger capacity. This results in long waiting times, especially during off-peak periods. Consequently, informal paratransit users in Gaborone are predominantly captive, rather than choice users, who aspire to afford private vehicles. Network characteristics The informal paratransit services typically follow radial routes, converging in the city centre (28). The road network in Gaborone comprises 445 km of tarred roads, 153 km of gravel roads, 41 km of dirt roads, and 7 km of interlocking brick roads (100). Approximately 90% of roads used by informal paratransit vehicles are tarred, with the balance being mostly gravel (28). Gravel roads are typically not adequately maintenance. Facilities Informal paratransit services make use of public transport facilities intended for long-distance bus operations, including terminals (ranks) and bus stops. The central bus terminal accommodates minibus passengers, longdistance bus passengers, and parking facilities for buses and private vehicles. There is also an informal retail sector within the facility, including vegetable markets, cooked food and beverage outlets (79). There are five further terminals, accommodating both short distance and intercity services. Most bus stops are in poor condition, although there are some exceptions – see Figure 31 (79). These stops are used by intercity buses and informal paratransit vehicles. Informal paratransit vehicles tend to stop anywhere they need to in order to pick up and drop off passengers along their routes. Figure 31: Bus stops in Gaborone (79) 5.4.2 Minibus taxis There are approximately 2,200 minibus taxis operating in the Greater Gaborone Area (79). 96% of public transport trips within a 10 km, and 93% within a 22 km radius of the city centre, are supported by minibus taxis (79). Beyond 22 km, only 1% of trips are served by minibus taxis. They mostly operate within a 22 km radius of a defined central point, and typically run routes of approximately 8 km, with buses plying the interurban routes. They typically operate on a fill-and-go model from ranks, resulting in extended idle time during off-peak periods when there is reduced demand (29). Minibus Taxis are operated by a mix of owner drivers, and small-scale operators typically with no more than two vehicles; 61% of all permits are issued to minibus taxi operators who have no more than two permits (79). Non-owner driver operations are typically target model-based (29) – see glossary of terms for further details on this operating model. In Gaborone, it was found that this model results in higher operational costs, 29 AFRICA URBAN MOBILITY OBSERVATORY – ROLE OF INFORMAL PARATRANSIT REPORT due to the higher rates of wear and tear associated with the hard driving styles and competitive behaviour this encourages (29). Some non-owner driver operations are fixed-wage-based – see glossary of terms for further details on this operating model. Minibus Taxi services operate on a cash-upfront basis, with fares being regulated by DRTS. The fares are fixed, regardless of trip length. Despite regulations stipulating that passengers must receive paper tickets; this is not adhered to (29). Consequently, understatement of revenue is allegedly rife (29). In the absence of formalised monitoring systems, operators have a limited understanding of their operational costs, making it difficult to improve efficiencies (29). Because minibus taxis generally generate more profit per kilometre than sedan taxis, it could be argued that reducing the number of sedan taxis would help ensure informal paratransit operations are more efficient, and therefore more financially viable. Not only would vehicle utilisation be improved, but traffic congestion and pollution would be reduced, and levels of service would likely improve. While minibus taxis operate informally, they do adhere to planned routes more closely than sedan taxis (29). There is however no formalised route database showing all the route origin destinations available from the key terminals. To support a World Bank study on informal paratransit in Gaborone, finalised in 2021, several minibus taxis were mapped using GoMetro Pro. The map generated is shown in Figure 32. Given the slim profit margins associated with minibus taxi operations, new vehicles are usually unaffordable, thus the minibus taxi fleet comprises mostly used imported 12 to 16-seater minibuses from the Far East and South Africa. The most common model is the Toyota HiAce (spanning several generations) (28). Most of these vehicles are over 15 years old (79) and in poor condition, and therefore are unreliable. Figure 32: Minibus taxi network in Gaborone (29) 5.4.3 Sedan taxis Most sedan taxi operators own a maximum of two vehicles, typically operating one of the vehicles themselves, while family members or friends operate the other(s) (79). Sedan taxis usually begin their operations at taxi ranks, where they join queues correlating to the corresponding destination rank of that vehicle. The vehicle then departs once there are enough passengers who wish to travel in designated direction. The passengers are then dropped off along the journey, with the vehicle often making detours, so that the passengers can be dropped at their chosen destination. Along this journey, new passengers are picked up. The route followed depends on the requirements of the passengers on board, which changes throughout the journey, resulting in sedan taxis having a meandering route profile, before eventually terminating at the destination rank (79). Sedan Taxis are operated by a mix of owner drivers, and small-scale operators (79). Non-owner driver operations are typically target model-based (29) – see glossary of terms for further details on this operating 30 AFRICA URBAN MOBILITY OBSERVATORY – ROLE OF INFORMAL PARATRANSIT REPORT model. Some non-owner driver operations are fixed-wage-based – see glossary of terms for further details on this operating model. Sedan Taxi services operate on a cash-upfront basis, with fares being regulated by DRTS. The fares are fixed, regardless of trip length. As with minibus taxis, despite regulations stipulating that passengers must receive paper tickets, this is not adhered to (29). Currently, in the city of Gaborone, there is no route database showing all the route origin destinations available from the key terminals. The operations of the sedan taxis are, however, more fluid, while minibus taxis more closely adhere to fixed routes (29). To support a World Bank study on informal paratransit in Gaborone, finalised in 2021, several sedan taxis were mapped using GoMetro Pro. The map generated is shown in Figure 33. Like in many countries in the region, there are no regulations prohibiting the import of used passenger vehicles – consequently, there is an abundance of affordable used imported vehicles from the Far East, including Japan and Singapore. Sedan taxi operators are therefore able to enter the market with limited capital. The average age of the sedan taxi fleet is 21 years. The most common vehicle models are the Honda Fit and Toyota Corolla. Figure 33: Sedan (4+1) taxi network in Gaborone (29) 5.5 AUMO data analysis 5.5.1 Mobility data The insights drawn from the AUMO Mobility Survey Data (considering mode share and travel time, disaggregated by income level and gender, on public and informal paratransit services) in Gaborone are reviewed in this sub-section. It should be noted that since the desired sample size was not reached in Gaborone (as only intercept data was available – see Section 3.3 for further details), these results should not be interpreted to be reflective of the entire population of the city. Across all income groups, minibus taxis have by far the largest share of all modes among respondents in Gaborone, suggesting that there are ‘choice users’ of informal paratransit in the city (see Figure 34). While the 1,000 – 1,999 USD income bracket seems to deviate substantially from all other income groups, it should be noted that there were just four respondents in this bracket. 31 AFRICA URBAN MOBILITY OBSERVATORY – ROLE OF INFORMAL PARATRANSIT REPORT Figure 34: Gaborone mode share by income level Both men and women survey responses reported spending on average 78 minutes travelling each day (see Figure 35). Note that there were no non-binary respondents to the AUMO survey in Gaborone. Figure 35: Gaborone travel time by gender In Gaborone, respondents who predominantly use minibus taxis spend the most time travelling (see Figure 36). This is followed by sedan taxis, and then private transport. Figure 36: Gaborone travel time by mode 5.5.2 User experience data The insights drawn from the AUMO Survey Data (considering crime, driver behaviour, comfort, and sexual harassment on public and informal paratransit services) in Gaborone are reviewed in this sub-section. 0% 20% 40% 60% 80% 100% 0 - 99 USD 100 - 249 USD 250 - 499 USD 500 - 999 USD 1000 - 1999 USD 2000 plus USD Gaborone Mode Share by Income Level Walking Cycling Private Transport Bus Minibus Taxi Sedan / MPV Taxi 0 10 20 30 40 50 60 70 80 90 Male Female Average Travel Time (minutes) Gaborone Travel Time by Gender 0 10 20 30 40 50 60 70 80 90 Walking Minibus Taxi Sedan / MPV Taxi Private Transport Average Travel Time (minutes) Gaborone Travel Time by Mode 32 AFRICA URBAN MOBILITY OBSERVATORY – ROLE OF INFORMAL PARATRANSIT REPORT As illustrated in Figure 37, 58% respondents in Gaborone stated that they have never experienced or witnessed crime while travelling, while the remainder has experienced or witnessed crime while travelling at least once in the city. Figure 37: Gaborone crime on public and informal paratransit (90) As illustrated in Figure 38, the vast majority (83%) of respondents felt that driver behaviour is acceptable. Figure 38: Gaborone public and informal paratransit driver behaviour (90) As illustrated in Figure 39, the vast majority (90%) of respondents feel that comfort levels are acceptable. 26.33% 57.53% 15.98% 0.15% Gaborone Transport Crime of Public and Informal Paratransit - Occurrence Never Once More Than Once Often 15.38% 83.42% 1.20% Gaborone Public and Informal Paratransit Driver Behaviour Poor Acceptable Excellent 33 AFRICA URBAN MOBILITY OBSERVATORY – ROLE OF INFORMAL PARATRANSIT REPORT Figure 39: Gaborone public and informal paratransit comfort (90) As illustrated in Figure 40, for the vast majority (75%) of respondents, services are usually reliable. Figure 40: Gaborone public and informal paratransit reliability (90) As illustrated in Figure 41, 87% of respondents stated that they had never seen or experienced sexual harassment while travelling. While only 13% reported otherwise, it is possible that those that claimed to have never seen or experienced sexual harassment, may have seen or experienced sexual harassment, but perhaps only consider sexual harassment to refer to the more violent forms. 1.39% 90.28% 8.33% Gaborone Public and Informal Paratransit Comfort Poor Acceptable Excellent 12.94% 74.89% 12.18% Gaborone Public and Informal Paratransit Reliability Usually Late Usually On Time Always On Time 34 AFRICA URBAN MOBILITY OBSERVATORY – ROLE OF INFORMAL PARATRANSIT REPORT Figure 41: Gaborone public and informal paratransit sexual harassment (90) 87.06% 8.68% 4.26% 0.00% Gaborone Public and Informal Paratransit Sexual Harassment Never Once More Than Once Often 35 AFRICA URBAN MOBILITY OBSERVATORY – ROLE OF INFORMAL PARATRANSIT REPORT 6. Kigali findings 6.1 City overview Kigali, the administrative and economic capital city of Rwanda, is situated in the centre of the country (see Figure 42). It has a high annual population growth rate of 4% and is home to 1.26 million inhabitants (representing 10% of the country’s total population) (38). Kigali is one of the most densely populated cities in Africa, with approximately 1,060 inhabitants per km2 (38). The city is situated high in a mountainous region, with an altitude ranging from 1,335 m to 2,050 m above sea level (38) – see Figure 43. Over the past decade, Kigali has undergone (and continues to undergo) rapid development. This has been achieved through a range of rejuvenation projects in commercial areas, including the construction of new office blocks, infrastructure improvements, and general improvement of urban service delivery (101). Despite this, unemployment remains high, at 31.4% (39). The Central Business District (CBD) is at the heart of a radial network of tarred roads, which connect Kigali to neighbouring territories and extend to the country border, connecting the city with the Democratic Republic of Congo (DRC), Burundi, Tanzania, and Uganda (39). Figure 42: Kigali location (89) 36 AFRICA URBAN MOBILITY OBSERVATORY – ROLE OF INFORMAL PARATRANSIT REPORT Figure 43: Kigali’s hilly terrain (38) 6.2 Urban transport services overview 6.2.1 Modal split In August 2021, 559 respondents across Kigali participated in an intercept survey, in which enumerators asked questions about their travel behaviour and experiences while travelling in the city. The survey was conducted over a period of three days and was administered at major transport interchanges and paratransit ranks. Modal split was calculated from this data, and the results are presented in Figure 44. A comprehensive list of transport services available in the city is presented in Table 6. Figure 44: Kigali transport modal split (90) Table 6: Passenger transport modes in Kigali Mode Present Description NMT Yes NMT infrastructure is under-developed in the city, especially in more remote parts (38); road cross-sections are not standardised, and many roads do not have sidewalks. In addition, there are no cycling paths. 2.33% 14.31% 19.68% 61.54% 2.15% Kigali Transport Modal Split (AUMO Survey Data - Main Mode of Transport) Walking Cycling Private Transport (Private Car/Metered Taxi) City Bus Motorcycle Taxi (Informal Paratransit) 37 AFRICA URBAN MOBILITY OBSERVATORY – ROLE OF INFORMAL PARATRANSIT REPORT Mode Present Description Metered Taxi Yes In 2017, there were 55 licenced taxicab companies, operating 1,257 vehicles. Of these, 370 are registered metered taxis, while the balance operate on a less formal basis (38). Passenger Rail No There is no passenger rail service currently operating in Kigali. Bus Yes There are three formalised bus operators in Kigali: Kigali Bus Service; Royal Express; and Jali Transport. Their fleets consist of Toyota minibuses (14-seaters), Toyota Coasters (30-seater) and standard 10.5 m buses (60-seater) (38). BRT No At present there are no BRT services in Kigali, although there are plans to introduce two BRT lines from 2025 (102). Ferries/Boats No There is no ferry/boat service currently operating in Kigali. Informal Paratransit Yes 200,000 daily trips are supported by privately operated motorcycle taxis, which typically function as a feeder service to major bus routes (38). Given the hilly nature of the terrain, motorcycle taxis are better suited to accessing parts of the city without tarred roads. In 2019, there were 31,050 registered motorcycle taxis in Kigali (39). Privately owned bicycle taxis also operate in the city. From 2015, there has also been a motorcycle taxi service using SafeMotos (a smartphone application) (39). In 2019, SafeMotos was rebranded to CanGo (103). With CanGo, users can get picked up from any location and can easily pay their fare from their e-wallet which could be mobile money, cash, or a credit card (39). 6.2.2 Environmental impact Worldometer CO2 emissions trends (disaggregated by sector) observed over a 40-year period, from 1970 to 2010, for Rwanda can be seen in Figure 45. According to Worldometer, the sources of this data are as follows: Emission Database for Global Atmospheric Research (EDGAR); CO2 Emissions from Fuel Combustion - IEA; World Population Prospects: The 2019 Revision - United Nations Population Division (92). Figure 45: Rwanda CO2 emissions (tons) over 40 years (92) At a national level, per 2018 World Bank records, 1,080 kilotons of CO2 emissions were produced by Rwanda, which translates to 0.088 metric tons per Capita – a relatively low value compared with the other six countries evaluated (1). Rwanda ranks among the bottom 20 on the continent on the ambient air pollution index, at 125.42 ug/m3 (2). 38 AFRICA URBAN MOBILITY OBSERVATORY – ROLE OF INFORMAL PARATRANSIT REPORT The transport sector remains a major source of urban air pollution in Kigali. According to the United Nations Environment, vehicles account for up to 80% of urban air pollution in most developing country cities (31). The main pollutants of concern from motor vehicles in Kigali are NO2 and PM2.5 (31). Rwanda imposes no restrictions on used vehicle imports. In 2017, Rwanda had a total of 191,015 registered motor vehicles (including motorcycles and three wheelers). New vehicles accounted for just 15% of these vehicles, with the balance being used imported vehicles. 95.2% of Rwanda’s total vehicle fleet are older than 15 years (registered before 2005) (31). Regarding fuel, diesel fuel available currently has a sulphur content maximum of 50 ppm (parts per million), which would support Euro 4 compliance, should this be legislated in future (2). 6.2.3 E-mobility initiatives and electricity generation Electric vehicle adoption incentives In April 2021, Cabinet formally approved an e-mobility adoption strategy, with the following incentives (32): • The electricity tariff for charging stations shall be capped at the industrial tariff level (large industry category); • Electric vehicles will benefit from a reduced tariff during the off-peak time; • Electric vehicles, spare parts, batteries, and charging station equipment shall be treated as VAT zero-rated products; • Exemption of import and excise duties on electric vehicles, spare parts, batteries and charging station equipment; • There will be an exemption of Withholding Tax of 5% at customs; • There will be rent free land for charging stations (for land owned by government); • There will be provisions of electric vehicle charging stations in the building code and City planning rules; • There will be free licence and authorisation for commercial electric vehicles; • Companies manufacturing and assembling electric vehicles (battery electric vehicles, plug-in hybrid electric vehicles and hybrid electric vehicles) in Rwanda are given other incentives in the investment code such as 15% Corporate Income Tax (CIT) and tax holiday; • Electric vehicles will receive preference for Government hired vehicles. Electric motorcycle taxis In 2019, President Paul Kagame announced a desire to replace all internal combustion engine motorcycle taxis with electric motorcycles (33). Ampersand is a Rwandan electric motorcycle taxi manufacturer, with its own battery charging and swap network in Kigali (34). Currently the motorcycles are imported as SKD (semi knocked down) kits (see glossary of terms for further details), and assembled in Kigali, although there are plans in place to increasingly source components locally (34). Several motorcycle taxi operators have begun converting their internal combustion engine (ICE) powered motorcycle fleets to electric. YegoMoto, with a fleet of 5,000 motorcycle taxis operating in Kigali, has collaborated with Ampersand, and expects to completely phase out its ICE motorcycles by 2025 (35). SafriRide, a new entrant in the motorcycle taxi sector, has a fleet of 45 electric motorcycles and scooters, with a further 75 to come online during 2021 (36). SafiRide is also in the process of setting up a delivery service with two electric vans. In order to help accelerate the transition to electric motorcycles, SafiRide is developing a new financing model, to help motorcycle taxi driver raise the capital necessary to upgrade to electric motorcycles. Electric Volkswagen Golf pilot In 2019 Volkswagen Rwanda launched a pilot project in partnership with Siemens, to test the feasibility of electric mobility in Rwanda using electric Golfs (104). 20 of these vehicles are being used for e-hailing services, via the VW Move app, developed by a local IT start-up, Awesomity Lab. Electricity generation 39 AFRICA URBAN MOBILITY OBSERVATORY – ROLE OF INFORMAL PARATRANSIT REPORT Presently, 54% of electricity in Rwanda is generated through renewable sources (37). 6.3 Regulatory and lobbying environment 6.3.1 Governance and enforcement Transport planning falls under the jurisdiction of the National Ministry of Infrastructure (MININFRA) (38). The Rwanda Transport Development Agency (RTDA), which was created in 2010 (in accordance with Law No. 02/2010 of 2010, modified by Law No. 29/2014 of 2014), and which reports to MININFRA, is responsible for all national and regional road infrastructure. The key functions of RTDA are to develop, coordinate, and monitor transport development projects; coordinate and monitor maintenance projects; safeguard environment protection while implementing transport; development activities; and research in transport development (39). The City of Kigali (CoK) is responsible for district and feeder road infrastructure in the city (38). Roads are classified in accordance with Law No 55/2011 of 2011, which also defines criteria for road maintenance and management (38). The Rwanda Urban Regulatory Authority (RURA) is responsible for regulating road and inland waterway transport services, in compliance with Law No. 09/13 of 2013 (39), through the Passenger Road Transport Regulations no. 007/TRANS/RT/RURA/2015. In addition, RURA is responsible for bus operator contracting (38). The Traffic and Road Safety Department of the Rwanda National Police is responsible for ensuring road traffic and road safety regulation as well as implementing measures including enhanced sensitisation of drivers, closer collaboration with driving schools, and more acquisition of modern road security policing equipment (39). Under supervision of the Ministry of Natural Resources, Rwanda Environment Management Authority (REMA) holds the legal mandate for national environmental protection, conservation, promotion, and overall management, including advisory to the government on all matters pertinent to the environment and climate change (39). 6.3.2 Environmental protection At a national level, the Ministry of Environment is responsible for environmental protection (40). The Constitution of the Republic of Rwanda guarantees every person the right to a clean and healthy environment. From this, the State has a duty to ensure the environment is protected and thereby need to undertake various measures (including the establishment of laws that outline the modalities) for protecting, conserving, and promoting the environment (31). The main air quality regulations include: the Organic Law Determining the Modalities of Protection of 2005 - Conservation and Promotion of Environment in Rwanda; the Law Determining the Mission, Organisation and Functioning of REMA of 2013; and the Law Governing the Preservation of Air Quality and Prevention of Air Pollution in Rwanda 0f 2016. The latter mentioned law requires all persons engaged in different activities (such as transport) to comply with the relevant air quality standards as set by the Rwanda Standards Board (31). These include standards concerning the ambient air quality, occupational air quality, and quality standards that regulate emissions of air pollutants from different sources such as industries and vehicles. Some prominent policies include: the Rwanda Vision of 2020 and Second Economic Development and Poverty Reduction Strategy (EDPRS 2) 2013 to 2018; Rwanda Environmental Policy (recognising transport as a key source of air pollution) of 2003; Rwanda National Energy Policy and Strategy of 2011 (recognising transport as one of the energy demand categories); and Rwanda National Industrial Policy of 2008 (31). In 2006 Rwanda published its National Adaptation Programmes of Action to Climate Change report (41). In this report, the impact of climate change on transport, and the need for mitigation measures to reduce reliance of transport on fossil fuels, which contribute towards climate change, are discussed. 6.3.3 Improvement plans and policies There are several key policy and planning strategy documents pertaining to urban mobility (38): 40 AFRICA URBAN MOBILITY OBSERVATORY – ROLE OF INFORMAL PARATRANSIT REPORT • National Feeder Road Policy and Strategy (MININFRA – 2017) aims to enable and stimulate rural socioeconomic development, providing an institutional framework in feeder roads operations as well as an efficient use of means and resources; • Fleet Policy of Government of Rwanda (National Government – 2014) aims to reduce capital cost, maintenance and running costs as well as minimise waste and abuse of public facilities; • Public Transport Policy and Strategy for Rwanda (MININFRA – 2012) aims to assess public transport challenges, culminating in reports outlining potential policy remedial measures on short, medium and long-term bases; • National Transport Policy – Vision 2020 (MININFRA – 2018) aims to strengthen institutional and legal framework to support the creation of a favourable environment for transport sector development; • Kigali Transport Master Plan 2013 – 2020 (National Government and Surbana International Consultants) provides a framework for the long-term development and expansion of existing transport systems that will support the City of Kigali in a smart and a sustainable manner; • Kigali Conceptual Master Plan (National Government – 2013) aims to develop a conceptual transport master plan, infrastructure and land use planning and environmental management strategy for the entire city. In addition to mobility and road infrastructure improvements, in order to reduce traffic congestion, National Government has expressed a desire to phase out the use of private vehicles in Kigali, and to prioritise public transport (38). In the interim, to discourage the use of private vehicles, plans are in place to restrict street parking as far as possible. In the longer term, the city is investigating the designation of five corridors, covering approximately 92 km, which will be fully dedicated to bus transport, by 2026 (38). In 2016, to reduce transport emissions, RURA introduced anti-dumping legislation discouraging used vehicle importing (38). In April 2021, Cabinet formally approved an e-mobility adoption strategy – for further details, refer to Section 6.2.3. 6.3.4 Memberships and associations All bicycle taxi and motorcycle taxis must register with the Rwanda Cooperative Agency (RCA) (38). There are two operating organisations: Rwanda Federation of Taxi-Moto Drivers (FERWACOTAMO); and the Syndicate of Taxi-Motos of Rwanda (SYSTRAMORWA) (42). FERWACOTAMO is the larger of the two entities, with approximately 78,000 members across 240 motorcycle taxi cooperations. RURA has indicated that it wishes to establish an online platform to register all motorcycle taxis in Rwanda (38). 6.3.5 NGOs and lobby groups The International Growth Centre (IGC), and NGO which aims to promote sustainable growth in developing countries, has an office in Kigali (43). Recent IGC publications include a policy brief on the impact of scaling up electric motorbikes in Rwanda, and a policy paper on car-free days and pollution free cities. The Global Green Growth Institute (GGGI), a treaty-based inter-governmental organisation dedicated to supporting inclusive and sustainable economic growth in developing countries, also has a programme in Rwanda, focusing on green growth and climate resilience (44). 6.4 Informal paratransit services analysis While city buses fall outside of the definition of informal paratransit, RURA embarked on a major process of reform of the informal paratransit sector between 2006 and 2013, formalising informal paratransit bus operations in Kigali, and culminating in the establishing of formalised bus services (102). With this context in mind, this report explores in more detail the bus operations established through this process. Given the hilly topography, spatial layout, and street network structure, many parts of the city are less suited to larger vehicles. Therefore, informal paratransit in the form of motorcycle and bicycle taxis, which are far smaller and agile, remain popular – see Figure 46 (102). These modes are explored in more detail below. 41 AFRICA URBAN MOBILITY OBSERVATORY – ROLE OF INFORMAL PARATRANSIT REPORT Figure 46: Informal paratransit modes in Kigali: bicycle and motorcycle taxis (39) and (38) 6.4.1 Reformed bus services Passenger demand, supply, accessibility and LOS Three bus operators serve the four transport zones of Kigali, covering a total of 865.5 km across 63 fixed routes, between five bus terminals (105). Zone one is operated by Kigali Bus Service (KBS), zone two is operated by Royal Express, and zones three and four by Jali Transport (see Figure 47). To support these routes, collectively they operate over 450 vehicles (39). According to 2018 Automated Fare Collection (AFC) data collected by AC Group (the ITS service provider for all bus services in Kigali), 250,000 passenger trips are typically recorded daily (38). While the capacity of the bus network has dramatically increased since the bus reforms of 2013, a lack of adequate balancing of services results in insufficient supply during peak periods on some routes, and over supply on others (38). Consequently, long queues are typical on some routes, while on others, there are long dwell times due to a lack of passengers. The three bus operators use a combination of single carriageway (40 km/h speed limit) and dual carriageway arterial (60 km/h speed limit) routes (102). There are no dedicated bus lanes. Traffic signals are not integrated, but do have variable cycle lengths and phases, albeit according to pre-programmed schedules, rather than real-time data. Kigali’s rapid population growth, along with increased private vehicles ownership, has contributed to increased traffic volumes and congestion, and deterioration of road infrastructure (38). This impacts on the efficiency and reliability of the bus services. Despite the rich data generated by the integrated ITS systems, insufficient attention has been allocated to analysing this data, in order to optimise operations. As a result, long passenger queues are typical at bus terminals and during peak hours. A poor perception of public transport services by public transport users (both among the captive and choice markets) prevails. In addition, despite the necessary ITS systems being in place, there are currently no real-time passenger information displays or apps to aid journey planning. 42 AFRICA URBAN MOBILITY OBSERVATORY – ROLE OF INFORMAL PARATRANSIT REPORT Figure 47: Kigali bus routes and terminals (42) Fares and business model Buses are required by law to have an approved ITS system installed (developed by AC Group), which supports AFC, and communicates real-time vehicle speed and location monitoring to RURA (to ensure route and speed limit adherence) (39). Fares are distance based and are paid through a rechargeable pre-paid ‘Tap and Go’ smartcard (so named, since upon entering and exiting the vehicle, passengers must tap their smartcards against the terminal, to log the start and journey end, allowing the back-end to deduct credits based on the journey profile. The cards can be purchased at major bus terminals and can be topped up with credits via a smartphone app, a USSD-based mobile-money service, or with cash, at kiosks across the city. AC Group earns a 5% commission of the gross revenue collection per vehicle (39). Many buses are also equipped with LTEbased Wi-Fi internet for passengers to use free of charge (75). Figure 48: E-Ticketing system in Kigali (39) 43 AFRICA URBAN MOBILITY OBSERVATORY – ROLE OF INFORMAL PARATRANSIT REPORT Figure 49: Reformed bus services stakeholders (42) Network characteristics More than 80% of Kigali’s roads are not tarred and become water-logged during the wet season and dusty during the dry season. This causes discomfort to passengers, damage to vehicles, and increased travel time (39). The arterial road network, consisting of four national radial roads, is tarred and well maintained (39). Fleet characteristics The KBS fleet consists of 108 buses, of which 96 are 10.5 m (see Figure 50), and 12 are midi-buses. The average age of the KBS fleet is eight years (106). The Royal Express fleet consists of 141 buses, of which most are midi-buses (see Figure 51), and some are 10.5 m buses (107). The average age of the Royal Express fleet is 11 years. The Jali Transport fleet consists of 198 buses, of which 143 are midi-buses (see Figure 52), and 55 are 10.5 m buses (108). The average age of the Jali Transport fleet is five years. Since these fleets are privately owned and operated, without the benefit of any state subsidy, they are solely reliant on fare box recovery. As a result, while the vehicles are currently mostly in acceptable condition, it may prove challenging for operators to replace these vehicles when they reach the end of their service life. Figure 50: KBS 10.5m bus in Kigali (38) 44 AFRICA URBAN MOBILITY OBSERVATORY – ROLE OF INFORMAL PARATRANSIT REPORT Figure 51: Royal Express midi-buses in Kigali (39) (38) Figure 52: Jali Transport midi-buses in Kigali (102) Facilities While the five bus terminals are well located, they are not able to adequately accommodate the passenger volumes, nor do they manage vehicular flows satisfactorily (38). This contributes towards overall inefficiency of the bus network. There is also inadequate shelter for waiting passengers (38). There are many bus stops and lay-bys throughout the city (see Figure 53). Figure 53: Bus lay-by in Kigali (102) 6.4.2 Motorcycle taxi Motorcycle taxis function predominantly as a complementary feeder mode to the major bus routes (38). Their key advantages are their ability to access even the steepest untarred roads in the city, as well as their ability to weave through traffic, which has become increasingly congested due to rapid urbanisation (38). Rwanda 45 AFRICA URBAN MOBILITY OBSERVATORY – ROLE OF INFORMAL PARATRANSIT REPORT National Police estimated that there were 80,000 motorcycle taxis across the country in 2017 (38) (a substantial increase from previous estimates of 58,000 in 2012, 38,500 in 2010, and 6,700 in 2004). There are 147 authorised motorcycle cooperatives operating in Rwanda, with around 31,050 motorcycle taxis in Kigali (39), supporting around 200,000 trips per day in the city (38). Only motorcycle taxis officially registered through RURA are legally permitted to operate in the city. Motorcycle taxi drivers must wear reflective vests that indicate their permitted zone of operation, along with a unique identification number. In addition, they must wear helmets, and have extra helmets for passengers. Operating illegally can result in arrest and fines, although it is alleged that many motorcycle taxis continue to operate illegally (42). Some 60% of all road accidents in the city involve motorcycle taxis (39). In 2019, President Paul Kagame announced the intention to replace all ICE motorcycle taxis with electric motorcycles (33). See Section 6.2.3 for further details. Trips within the city typically cost between GBP 0.70 and GBP 1.40, depending on the distance and route. Motorcycle taxis can be found parked near bus stops and terminals and can also be hailed from the side of the road. There are also several operators supporting motorcycle taxi e-hailing (such as SafeMotos (rebranded to CanGo in 2019), SafiRide, and YegoMoto), where passengers are able to hail and pay motorcycle taxis through smartphone apps (109) (110) (111). These apps have helped to standardise fares, by allowing automated calculation of fares based on trip length, which in turn has improved riders’ revenues. 6.4.3 Bicycle taxis Bicycle taxis provide a ‘last-mile’ service from bus terminal and interchanges to residential areas. In 2011, intending to reduce traffic accidents and fatalities, the Rwanda National Police temporarily banned bicycle taxis from all roads across the country (38). This was soon scaled back to only apply to certain key arterial routes in urban centres. Kigali, like many urban centres in the country, has seen a rapid increase in bicycles taxis, with over 5,000 operating in Kigali and its surrounds (38). There are, however, no NMT facilities designed to accommodate bicycle taxis, forcing shared use of roads with motorised traffic, making then unsafe (38). While bicycle taxis are not regulated, they are organised into independent cooperatives, which charge riders a daily membership fee of GBP 0.50 (39). Bicycle taxi fares are typically around GBP 0.07 per ride; therefore riders typically do not earn much more than GBP 2.15 per day. Operators accept cash and payment using mobile money (112). 6.5 AUMO data analysis 6.5.1 Mobility data The insights drawn from the AUMO Mobility Survey Data (considering mode share and travel time, disaggregated by income level and gender, on public and informal paratransit services) in Kigali are reviewed in this sub-section. It should be noted that since the desired sample size was not reached in Kigali (as only intercept data was available – see Section 3.3 for further details), these results should not be interpreted to be reflective of the entire population of the city. Across most income groups, the bus has by far the largest share of all modes among survey respondents in Kigali, suggesting that many public transport users in city are in fact ‘choice users’ rather than ‘captive users’ (see Figure 54). While the 2,000 plus USD income bracket has 100% assigned to cycling, it must be noted that there was only a single respondent in this income bracket. There were also very few respondents in the 500 – 999 USD and 1,000 – 1,999 USD income brackets (8 and 15 respondents respectively). The vast majority of respondents fell into the lower three income brackets. 46 AFRICA URBAN MOBILITY OBSERVATORY – ROLE OF INFORMAL PARATRANSIT REPORT Figure 54: Kigali mode share by income level It is apparent that men who responded to the survey spend on average more time travelling each day in Kigali (see Figure 55). It should be noted that there were four non-binary respondents. Figure 55: Kigali travel time by gender In Kigali, at 194 minutes per day for a round trip, respondents who use buses spend by far the most time travelling (see Figure 56). This is followed by 111 minutes on average by respondents who use private transport. Figure 56: Kigali travel time by mode 0% 20% 40% 60% 80% 100% 0 - 99 USD 100 - 249 USD 250 - 499 USD 500 - 999 USD 1000 - 1999 USD 2000 plus USD Kigali Mode Share by Income Level Walking Cycling Private Transport Bus Motorbike / Tricycle Taxi 0 20 40 60 80 100 120 140 160 Male Female Non-binary Average Travel Time (minutes) Kigali Travel Time by Gender 0 50 100 150 200 250 Walking Bus Private Transport Cycling Motorbike / Tricycle Taxi Average Travel Time (minutes) Kigali Travel Time by Mode 47 AFRICA URBAN MOBILITY OBSERVATORY – ROLE OF INFORMAL PARATRANSIT REPORT 6.5.2 User experience data The insights drawn from the AUMO Survey Data (considering crime, driver behaviour, comfort, and sexual harassment on public and informal paratransit services) in Kigali are reviewed in this sub-section. As illustrated in Figure 57, 66% of respondents stated that they have never experienced or witnessed crime while travelling. Figure 57: Kigali crime on public and informal paratransit (90) As illustrated in Figure 58, the majority of respondents (76%) feel that driver behaviour is acceptable. Figure 58: Kigali public and informal paratransit driver behaviour (90) As illustrated in Figure 59, the vast majority of respondents (87%) feel that comfort levels are acceptable. 66.37% 17.35% 15.92% 0.36% Kigali Crime on Public and Informal Paratransit (AUMO Survey Data - Occurrence) Never Once More Than Once Often 21.47% 75.67% 2.86% Kigali Public and Informal Paratransit Driver Behaviour (AUMO Survey Data) Poor Acceptable Excellent 48 AFRICA URBAN MOBILITY OBSERVATORY – ROLE OF INFORMAL PARATRANSIT REPORT Figure 59: Kigali public and informal paratransit comfort (90) As illustrated in Figure 60, for the majority (55%) of respondents, services usually run on time. A substantial proportion (41%) however stated that services are usually late. Figure 60: Kigali public and informal paratransit reliability (90) As illustrated in Figure 61, 88% of respondents stated that they had never seen or experienced sexual harassment while travelling. While only 12% reported otherwise, it is possible that those that claimed to have never seen or experienced sexual harassment, may have seen or experienced sexual harassment, but perhaps only consider sexual harassment to refer to the more violent forms. 7.00% 87.39% 5.60% Kigali Public and Informal Paratransit Comfort (AUMO Survey Data) Poor Acceptable Excellent 41.32% 54.74% 3.94% Kigali Public and Informal Paratransit Reliability (AUMO Survey Data) Usually Late Usually On Time Always On Time 49 AFRICA URBAN MOBILITY OBSERVATORY – ROLE OF INFORMAL PARATRANSIT REPORT Figure 61: Kigali public and informal paratransit sexual harassment (90) 88.37% 7.33% 4.11% 0.18% Kigali Public and Informal Paratransit Sexual Harassment (AUMO Survey Data - Occurrence) Never Once More Than Once Often 50 AFRICA URBAN MOBILITY OBSERVATORY – ROLE OF INFORMAL PARATRANSIT REPORT 7. Kinshasa findings 7.1 City overview Kinshasa city, situated in Kinshasa province towards the southwest, is the capital city of the Democratic Republic of Congo (DRC) (51) – see Figure 62. Its topography is hilly, with altitudes ranging between 275 m and 370 m above sea level (51). The population of Kinshasa city increased from 2.6 million in 1984 to 10.6 million in 2013, at an average annual growth rate of 4.9%; it is expected to reach 20 million by 2030 (51). The city comprises 24 communes, of which 21 (spanning 327 km2 ) are urban. The population density in older central parts of the city is high, exceeding 200 persons per hectare (51). Poorly managed and rapid urbanisation has resulted in uncontrolled urban sprawl on the periphery of the city, where single unit dwellings and informal settlements have grown, and where access to services is poor (113). This is exacerbated by high levels of unemployment, resulting in a low GRDP (Gross Regional Domestic Product) per capita of USD 766 (recorded in 2016) (51). Between 2007 and 2016, the city’s GRDP grew by 7.1%, driven predominantly by growth in the transport and telecommunication sectors (51). Figure 62: Kinshasa location (89) 51 AFRICA URBAN MOBILITY OBSERVATORY – ROLE OF INFORMAL PARATRANSIT REPORT 7.2 Urban transport services overview 7.2.1 Modal split In August 2021, 762 respondents across Kinshasa participated in an intercept survey, in which enumerators asked questions about their travel behaviour and experiences while travelling in the city. The survey was conducted over a period of three days and was administered at major transport interchanges and paratransit ranks. Modal split was calculated from this data, and the results are presented are presented in Figure 63. A comprehensive list of transport services available in the city is presented in Table 7. Figure 63: Kinshasa transport modal split (90) Table 7: Passenger transport modes in Kinshasa Mode Present Description NMT Yes 49.6% of all trips in the city are made by walking and cycling (51). Despite this considerable mode share, pedestrian facilities are generally very poor, and bicycles facilities are non-existent (48). Metered Taxi Yes There are no traditional metered cabs in Kinshasa, however, an e-hailing service, UbizCabs, was launched in 2018 (114); it is the first wholly female owned and operated e-hailing company in the region. Passenger Rail Yes There is a single passenger rail line in Kinshasa, operated by the Commercial Society of Transport and Ports (SCTP) (Société Commerciale des Transports et des Ports) and the Office National of Transport (ONATRA) (51). A lack of infrastructure maintenance has led to a dramatic decline in levels of service, with just 1,600 daily trips being recorded on average in 2017 (51). The service only operates weekdays, with a single round trip per day (departing from Kasangulu in the morning and returning from Kinshasa in the evening) (51). Bus Yes There are three formal bus operations in Kinshasa, two of which are state owned, and the third, privately owned (51). TRANSCO, a state-owned entity, operates large buses (typically 50-seaters), while New TransKin operates midi-buses. Esprit de Vie, a private entity, also operates midi-buses. BRT No At present, there are no BRT services in Kinshasa. According to the Urban Transport Master Plan of Kinshasa, there are plans for a BRT service to be introduced called KinRapid, which will replace and expand upon the existing passenger rail service (51). 2.76% 0.13% 7.61% 16.67% 30.31% 30.18% 12.34% Kinshasa Transport Modal Split (AUMO Survey Data - Main Mode of Transport) Walking Cycling Private Transport (Private Car/Metered Taxi) City Bus Minibus Taxi (Informal Paratransit) Sedan Taxi (Informal Paratransit) Motorcycle Taxi (Informal Paratransit) 52 AFRICA URBAN MOBILITY OBSERVATORY – ROLE OF INFORMAL PARATRANSIT REPORT Mode Present Description Ferries/Boats No There is no ferry/boat service currently operating in Kinshasa. Informal Paratransit Yes Privately owned and operated informal paratransit services include minibus taxis, sedan taxis and motorcycle taxis (51). CanGo (formerly SafeMotos), also operating in Kigali, Rwanda, is a motorcycle taxi service which allows users to get picked up from any location and to easily pay their fare from their e-wallet which could be mobile money, cash or a credit card (39) (76). 7.2.2 Environmental impact Worldometer CO2 emissions trends (disaggregated by sector) observed over a 40-year period, from 1970 to 2010, for DRC can be seen in Figure 64. According to Worldometer, the sources of this data are as follows: Emission Database for Global Atmospheric Research (EDGAR); CO2 Emissions from Fuel Combustion - IEA; World Population Prospects: The 2019 Revision - United Nations Population Division (92). Figure 64: DRC CO2 emissions (tons) over 40 years (92) At a national level, per 2018 World Bank records, 2,200 kilotons of CO2 emissions were produced by DRC, which translates to 0.026 metric tons per Capita, a relatively low value compared with the other six countries evaluated (1). Despite this, DRC ranks among the bottom 20 on the continent on the ambient air pollution index, at 112.78 ug/m3 (2). DRC imposes a maximum age limit on used vehicle imports of 9 years; the average age of imported used vehicles is unknown (2). Diesel fuel available currently has a sulphur content maximum of 500 ppm (parts per million), which would support only Euro 2 compliance, should this be legislated in future (2). 7.2.3 E-mobility initiatives and electricity generation Electric vehicle rental operation – Mopepe solutions In March 2021, Mopepe Solutions launched an electric vehicle rental service in Kinshasa, with a fleet of Nissan Leaf EVs and 12 charging stations (45). Cobalt mining Much of the world’s cobalt supply, a critical element in electric vehicle batteries, is mined in the DRC (46). Despite this, there are no known electric vehicle initiatives in the country to encourage their uptake. 53 AFRICA URBAN MOBILITY OBSERVATORY – ROLE OF INFORMAL PARATRANSIT REPORT Electricity generation Hydroelectric power accounts for 96% of DRC’s electricity generation (47), meaning a transition to e-mobility would have a substantial impact on reducing emissions. 7.3 Regulatory and lobbying environment 7.3.1 Governance and enforcement Kinshasa has no independent transport authority (48). The National Road Safety Commission (Commission Nationale de Prévention Routière) is a branch of the Ministry of Transport, established to regulate road transport. The national government, through the Ministry of Economy, and the Kinshasa city government, set formal public transport fares and determine routes, with input from operators. The Ministry of Public Works and Infrastructure is responsible for construction and maintenance of higher order arterial roads (48). The Kinshasa city government is responsible for maintaining lower order city roads. Planning falls under the responsibility of the Ministry of Planning, although the Ministry of Transport is responsible for transport planning through a transport study group, the Groupe d’Etudes de Transport. The National Commission for Road Safety (CNPR) (Commission Nationale de la Prévention Routière) appear to perform functions outside of its mandate (115); while it is meant to develop guidelines and coordinate actions to ensure road safety, it is also performing a road works monitoring, planning and management function. The regulatory framework and enforcement protocols were developed by national government. After the Decentralisation Law was promulgated in July of 2008, these responsibilities have since been devolved to provinces (who now have motorised transport legislative authorities) (115). The main transport regulatory instruments are Decree No. 14/19 of 2014 (Article 4) and the ‘Code de la Route’ (The Road Code), which is a national law for motorcycles. While buses are legally required to be insured by the Société Nationale d’Assurances (SONAS), a national insurance company, and registered with the Direction Générale des Impôts (DGI), the tax authorities, many informal operators disregard these requirements (48). Issuance of drivers’ licences falls under the responsibility of the state entity, the Commission Nationale de Délivrance des Permis de Conduire (CONADEP) (115). 7.3.2 Environmental protection At a national level, the Ministère de l'Environnement et du Développement Durable is responsible for environmental protection (49). Article 53 of the Constitution of the DRC (adopted by Government in 2006) states that every person has a right to a healthy environment, and which is favourable to his / her full development; the environment must be protected; the State must look after the protection of the environment and the health of the people. Article 123 of the Constitution further makes provision for laws to be made concerning, inter alia, the protection of the environment and tourism. Article 203 then also allows for co-operative governance by central government and the Provincial administrations to protect “the environment, natural sites and landscapes, and the conservation of such sites (p. 58)†(50). There are no national ambient air quality standards in the DRC as well as no publicly available PM2.5 monitoring in the city of Kinshasa. Therefore, it is currently difficult to know the level of exposure and the potential health impacts of air pollution which is an alarming gap in this megacity (116). 7.3.3 Improvement plans and policies The National Strategic Development Plan (PNSD) (Plan National Stratégique de Développement) funded by the United Nations Development Programme (UNDP) for 2017 to 2021 – the national vision for economic development by 2030, is currently being finalised (51). The PNSD is informed by the Poverty Reduction Strategy Paper (DSRP) (Documents de Stratégie pour la Réduction de la Pauvreté) for 2002 to 2005 – Stabilisation, transition and reconstruction; Growth and Poverty Reduction Strategy Paper (DSCRP) (Document de la Stratégie de Croissance et de Réduction de la Pauvreté) for 2006 to 2010 - Governance and 54 AFRICA URBAN MOBILITY OBSERVATORY – ROLE OF INFORMAL PARATRANSIT REPORT the revival of pro-poor growth; and Governance Support Programme (DSCRP-2 and the PAG - Programme d'Appui à la Gouvernance) for 2011 to 2016 - Growth, employment creation and climate change impact. A National Integrated Transport Master Plan (PDNIT) (Le Plan Directeur National Intégré des Transports) is currently being prepared, which covers the entire country, with regional and urban scales of intervention (51). In terms of the urban transport system in Kinshasa, several programs have been proposed, such as development and maintenance of urban roads, improvement and management of intersections, multi-modal transport hubs (Les pôles d’échanges), and public transport network development, including buses and BRT (51). The Strategic Orientation Scheme for the Kinshasa Metropolitan Area (SOSAK) (Schéma d'Orientation Stratégique de l'Agglomération Kinoise) was produced and approved by the provincial congress in 2015, to promote planned urban development, with support of the French Development Agency (AFD) (Agence Française de Développement), which highlights the importance of having an Urban Transport Master Plan in parallel with urban development (51). Substantial investment is required in electricity generation and distribution in Kinshasa (52); electricity blackouts for up to 15 hours a day are not uncommon. 7.3.4 Memberships and associations The Association of Public Transport Vehicles Owners (APVCO) (Association des Chauffeurs du Congo) is the association for Esprit de Vie operators, who operate formal midi-bus bus services alongside state-run buses in the city (51). The Association of Public Transport Vehicles Owners (ACCO) (Association des Propriétaires de Véhicules Affectés au Transport en Commun) caters for operators of privately owned sedan taxis. The National Association of Owners of Motorcycle Taxies of the Congo (ANIPTMC) supports motorcycle taxi operators (51). The Association des Chauffeurs du Congo supports informal paratransit minibus operators (48). 7.3.5 NGOs and lobby groups There are no known transport sector NGOs or lobby groups operating in Kinshasa. 7.4 Informal paratransit services analysis 7.4.1 Overview Passenger demand, supply, accessibility and LOS Informal paratransit services available in Kinshasa include motorcycle taxis (referred to as ‘wewa’), sedan taxis (referred to as ‘juana’) and minibus taxi (referred to as Esprit de Mort – Spirit of Death) (51). As a result of inadequate formal public transport service, a rapidly growing population, and large peripheral informal settlements, demand for informal paratransit services is high in Kinshasa (117). These services struggle to cope with this demand. This is largely due to reliance on a poorly designed and maintained road network, where lane closures due to severe road surface deterioration are frequent, and major intersections lack traffic signals, as well as a lack of pedestrian facilities, resulting in mixing of motorised and NMT traffic (113). This is exacerbated by a lack of lay-bys for informal paratransit vehicles, and insufficient law enforcement. Traffic is frequently blocked by illegally double-parked minibus taxis loading and off-loading passengers. Consequently, passengers face lengthy delays on a daily basis. In this environment, despite the high demand, informal paratransit operators struggle to achieve sustainability, with many operators failing after just a few years of entering service (117). This can be attributed to a range of factors, including a lack of seat turnover (due largely to the sprawling nature of new residential development), the inability to complete multiple return trips during peak periods (due to congestion), and a market comprising predominantly captive passengers (who earn little, and who cannot afford higher fares). 55 AFRICA URBAN MOBILITY OBSERVATORY – ROLE OF INFORMAL PARATRANSIT REPORT Network characteristics Informal paratransit services travel on Kinshasa’s under-developed road network, comprising approximately 5,000 km in total, of which just 10% is tarred – see Figure 65 for an example of a typical road in the city (48). War, civil unrest, weak policy, and a lack of capacity and investment, as well as mismanagement and misappropriation of funds by the government has resulted in a lack of maintenance, resulting in the deterioration of transport systems in the city (51). Even in central areas where the roads are tarred, frequent water pipe bursts and leaks result in cracked and potholed surfaces. In the rainy season, many roads become flooded, resulting in circuitous detours being necessary (51). Figure 65: Indicative road in Kinshasa (51) Facilities There are no dedicated informal paratransit facilities in the city (52). Therefore, informal paratransit services make use of formal public transport terminals and bus stops (see Figure 66). These facilities are generally in poor condition, and typically have no shelters, seating, or toilets (118). Figure 66: Example bus stop in Kinshasa (51) 7.4.2 Minibus taxis 32.6% of motorised trips in Kinshasa (51) are made by around 1,200 minibus taxis (48). They tend to operate short distance trips only, accept cash only and are concentrated around the Gombe and N'djili communes (52). Levels of service are highly unpredictable, with passengers frequently waiting in excess of an hour to depart. Officially, minibus taxi fares are regulated, and are linked with distance travelled (52). During peak periods however, it is not uncommon for drivers to charge passengers more than the regulated fare (52). Transaction are cash based, and most services do not provide passengers with tickets or receipts (52). A typical journey across the city costs around GBP 0.18 (119). The least wealthy quintile in Kinshasa spends around 31% of their income on transport (115). 56 AFRICA URBAN MOBILITY OBSERVATORY – ROLE OF INFORMAL PARATRANSIT REPORT Minibus taxi operators require a ‘vignette’ (transport permit), a valid driver’s licence, a valid vehicle licence (colloquially referred to as a pink card), and a bus number (52). Operators typically own several licenced vehicles, which are run by drivers on a target-based business model (48) – see glossary of terms for further details on this business model. This results in high levels of competition between drivers for passengers. More experienced drivers, who have a strong understanding of the temporal fluctuations of the market, are better able to judge when to leave a rank without waiting for a full load (in anticipation of collecting passengers enroute). The services are therefore demand responsive, albeit without centralised control, and rather through reliance on intuition. This results in unpredictable levels of service for passengers (48). Minibus taxis are usually imported used vehicles, ranging in capacity from 14 to 26-seaters. Typical models include the Toyota HiAce, VW Transporter and LT, and Mercedes TN, mostly between 15 and 20 years old (48). They tend to be poorly maintained, are uncomfortable, considered to be highly unsafe; as a result, they a colloquially named Esprit de Mort (Sprit of Death) – see Figure 67 for an example (51). Figure 67: Minibus taxi (Esprit de Mort) in Kinshasa (120) 7.4.3 Sedan taxis Fifteen percent of motorised trips in Kinshasa are supported by sedan taxis, known as ‘juana’ (translating to ‘yellow’) (51). They tend to be operated by owner drivers, who accept cash only, and travel between the major transport interchanges, without fixed routes. To operate a sedan taxi a ‘vignette’ (transport permit), a valid driver’s licence, a valid vehicle licence is required (52). While sedan taxis are ordinarily shared by multiple passengers wishing to travel in a similar direction (often with different destinations), for an additional fee it is possible to request an ‘express’ service, in which the driver take the passenger(s) directly to the desired destination, without collecting additional passengers along the way (52). Sedan taxi fares are officially regulated (linked to distance travelled), however, as with minibus taxis, during peak periods, drivers often charge passengers more than the regulated fare (52). As seen in many other sub-Saharan African cities, sedan taxi vehicles are typically imported used vehicles from the Far East. Popular models include the Toyota Vitz and Toyota Corolla – see Figure 68 (52). 57 AFRICA URBAN MOBILITY OBSERVATORY – ROLE OF INFORMAL PARATRANSIT REPORT Figure 68: Sedan taxis (Juana) in Kinshasa (121) 7.4.4 Motorcycle taxis Motorcycle taxis started gaining popularity in the region in the 1980s (115). They have since become a critical mode of transport in Kinshasa, supporting around 23% of motorised trips across the city (51). Their popularity is attributed largely to their agility, and ability to access areas which are otherwise inaccessible to fourwheeled vehicles, due to poor road conditions (115). Typically, riders either own or lease their motorcycles, although lease-to-own models are also becoming increasingly common (115). Owners are generally responsible for maintenance, while all trip-related expenses fall under the responsibility of the rider. Agreements between owners and riders are generally verbal, and seldom formalised (115). In response to increased traffic fatalities, as well as criminal activities involving motorcycle taxis, in 2016 the governor of Kinshasa introduced a restriction prohibiting motorcycle taxis from operating in the city beyond 8pm (122). Riders are required to have a valid motorcycle licence and a registered motorcycle to operate, however as many as 50% do not have the necessary documentation and operate unlicenced motorcycles (115). Motorcycles are mostly imported from China, although some are also imported from Rwanda, where they are assembled (115). Figure 69: Motorcycle taxi (Wewa) in Kinshasa (123) 7.5 AUMO data analysis 7.5.1 Mobility data The insights drawn from the AUMO Mobility Survey Data (considering mode share and travel time, disaggregated by income level and gender, on public and informal paratransit services) in Kinshasa are 58 AFRICA URBAN MOBILITY OBSERVATORY – ROLE OF INFORMAL PARATRANSIT REPORT reviewed in this sub-section. It should be noted that since the desired sample size was not reached in Kinshasa (as only intercept data was available – see Section 3.3 for further details), these results should not be interpreted to be reflective of the entire population of the city. Among respondents with household incomes in excess of 500 USD, sedan taxis are by far the most popular mode (see Figure 70). Below that income level, minibus taxis are more popular. Private transport does not exceed 26% in any of the income categories. Motorcycle taxis and bus are the least popular motorised modes among most respondents across income groups. Figure 70: Kinshasa mode share by income level Men reported spending on average 83 minutes travelling, while women reported 68 minutes per day travelling in Kinshasa (see Figure 71). Note that there were no non-binary respondents to the AUMO survey in Kinshasa. Figure 71: Kinshasa travel time by gender In Kinshasa, at 121 minutes per day for a round trip, respondents who primarily use bus as their main mode spend by far the most time travelling, which likely contributes toward their low levels of popularity among respondents from most income groups (see Figure 72). This is followed by 87 minutes on average by sedan taxi respondents, 73 minutes by minibus taxi respondents, and 72 minutes by private transport respondents. 0% 20% 40% 60% 80% 100% 0 - 99 USD 100 - 249 USD 250 - 499 USD 500 - 999 USD 1000 - 1999 USD 2000 plus USD Prefer not to say Kinshasa Mode Share by Income Level Walking Cycling Private Transport Bus Minibus Taxi Sedan / MPV Taxi Motorbike / Tricycle Taxi 0 10 20 30 40 50 60 70 80 90 Male Female Average Travel Time (minutes) Kinshasa Travel Time by Gender 59 AFRICA URBAN MOBILITY OBSERVATORY – ROLE OF INFORMAL PARATRANSIT REPORT Figure 72: Kinshasa travel time by mode 7.5.2 User experience data The insights drawn from the AUMO Survey Data (considering crime, driver behaviour, comfort, and sexual harassment on public and informal paratransit services) in Kinshasa are reviewed in this sub-section. As illustrated in Figure 73, 58% of respondents stated that they have never experienced or witnessed crime while travelling. 42% of respondents reported having witnessed or experienced at least once incident of crime while travelling in the city. Figure 73: Kinshasa crime on public and informal paratransit (90) As illustrated in Figure 74, the majority of respondents (56%) feel that driver behaviour is acceptable, but a significant proportion (44%) stated that driver behaviour is poor. 0 20 40 60 80 100 120 140 Walking Minibus Taxi Bus Sedan / MPV Taxi Private Transport Cycling Motorbike / Tricycle Taxi Average Travel Time (minutes) Kinshasa Travel Time by Mode 57.87% 27.03% 12.99% 2.10% Kinshasa Crime on Public and Informal Paratransit - Occurrence Never Once More Than Once Often 60 AFRICA URBAN MOBILITY OBSERVATORY – ROLE OF INFORMAL PARATRANSIT REPORT Figure 74: Kinshasa public and informal paratransit driver behaviour (90) As illustrated in Figure 75, the vast majority of respondents (79%) feel that comfort levels are acceptable. Figure 75: Kinshasa public and informal paratransit comfort (90) As illustrated in Figure 76, while 55% of respondents indicated that public and informal paratransit services are usually or always on time, a substantial proportion (45%) reported that service is usually late. 43.83% 55.77% 0.39% Kinshasa Public and Informal Paratransit Driver Behaviour Poor Acceptable Excellent 18.37% 78.87% 2.76% Kinshasa Public and Informal Paratransit Comfort Poor Acceptable Excellent 61 AFRICA URBAN MOBILITY OBSERVATORY – ROLE OF INFORMAL PARATRANSIT REPORT Figure 76: Kinshasa public and informal paratransit reliability (90) As illustrated in Figure 77, an unusually large majority (96%) of respondents stated that they had never seen or experienced sexual harassment while travelling. While only 4% reported otherwise, it is possible that those that claimed to have never seen or experienced sexual harassment, may have seen or experienced sexual harassment, but perhaps only consider sexual harassment to refer to the more violent forms. Figure 77: Kinshasa public and informal paratransit sexual harassment (90) 45.01% 50.00% 4.99% Kinshasa Public and Informal Paratransit Reliability Usually Late Usually On Time Always On Time 96.19% 3.67% 0.13% 0.00% Kinshasa Public and Informal Paratransit Sexual Harassment - Occurrence Never Once More Than Once Often 62 AFRICA URBAN MOBILITY OBSERVATORY – ROLE OF INFORMAL PARATRANSIT REPORT 8. Lagos findings 8.1 City overview Lagos city, situated in in the southwest of Lagos State (see Figure 78), has an estimated population of more than 20 million people, making it Africa’s most populous city (81). It is loosely divided into two main geographical areas: Lagos Island, and Lagos Mainland. While Abuja is the capital of Nigeria, Lagos is the country’s commercial centre (81). Nigeria is Africa's largest producer of oil and is the sixth-largest oilproducing country in the world (81), with close to 90% of its export revenue coming from oil. Despite this, it is estimated that 75% of Lagos’ population live in slums, due to high levels of unemployment (62). Figure 78: Lagos location (89) 8.2 Urban transport services overview 8.2.1 Modal split In August 2021, 562 respondents across Lagos participated in an intercept survey, in which enumerators asked questions about their travel behaviour and experiences while travelling in the city. The survey was conducted over a period of three days and was administered at major transport interchanges and informal paratransit ranks. From this data, modal split was calculated, the results of which are presented in Figure 79. It should be noted however, that after consultation with LAMATA, it was confirmed that modal split of BRT is closer to 25%, while minibus taxis are closer to 60% (63). It is suspected that AUMO enumerators did not adequately cover minibus taxi ranks (this will be addressed during the forthcoming phase two data collection round scheduled to commence in October 2021). A comprehensive list of transport services available in the city is presented in Table 8. 63 AFRICA URBAN MOBILITY OBSERVATORY – ROLE OF INFORMAL PARATRANSIT REPORT Figure 79: Lagos transport modal split (90) Table 8: passenger transport modes in Lagos Mode Present Description NMT Yes Over a third of all trips in the city are made by NMT modes (64). Lagos has a strong commitment to NMT, with an official NMT policy that aims to support increased walking and cycling, by creating a safe and comprehensive network of footpaths, cycle tracks, greenways, and other NMT facilities (64). Metered Taxi Yes There are two categories of taxicabs operating door to door services in Lagos: conventional regulated yellow cabs; and unregulated e-hailing services, including Uber and Bolt (63). While yellow cabs do not have meters installed, the fare is calculated based on distance travelled, using the vehicle odometer (63). Passenger Rail No There is no passenger rail service currently operating in Lagos. However, there is a new service under construction, the Lagos Rail Mass Transit (LRMT), which is scheduled to open late 2022 (81). Bus Yes There are two formal bus services operating in Lagos: a traditional fixed route regulated service is operated by LAGBUS (124), and a demand responsive micro-bus service that was launched in 2021 under the Bus Reform Initiative (BRI), to cover first-and-last-mile (FLM) journeys previously supported by informal paratransit services (63). BRT Yes The first BRT service in Africa was the Lagos BRT (BRT-Lite), which launched in 2008 (59). It comprises two lines, covering 35.5 km of busway, and transports over 350,000 commuters daily, supporting over 25% of daily trips across the city (63). Fares are collected electronically, through a smartcard system, the Cowry Travel Card, which calculates fares based on distance and zones of travel (63). Ferries/Boats Yes Of the six cities evaluated, only Lagos has ferry transport. Recently, to improve connectivity with ferry transport, under the FLM scheme, microbuses linking the BRT network to ferry terminals have been introduced (63). Ferries are generally not popular, as they are considered unsafe, and support just a few destinations (81). 0.00% 0.18% 14.06% 20.82% 7.30% 51.96% 1.42% 4.09% 0.18% Lagos Transport Modal Split (AUMO Survey Data - Main Mode of Transport) Walking Cycling Private Transport (Private Car/Metered Taxi) City Bus Minibus Taxi (Informal Paratransit) BRT Bus Motorcycle/Tricycle Taxi (Informal Paratransit) Sedan Taxi (Informal Paratransit) Water Ferry 64 AFRICA URBAN MOBILITY OBSERVATORY – ROLE OF INFORMAL PARATRANSIT REPORT Mode Present Description Informal Paratransit Yes There are several informal paratransit services operating in Lagos: minibus and midibus taxis, sedan taxis, tricycle taxis, and motorcycle taxis (59). Figure 80: BRT in Lagos (59) 8.2.2 Environmental impact Worldometer CO2 emissions trends (disaggregated by sector) observed over a 40-year period, from 1970 to 2010, for Nigeria can be seen in Figure 81. According to Worldometer, the sources of this data are as follows: Emission Database for Global Atmospheric Research (EDGAR); CO2 Emissions from Fuel Combustion - IEA; World Population Prospects: The 2019 Revision - United Nations Population Division (92). Figure 81: Nigeria CO2 emissions (tons) over 40 years (92) At a national level, per 2018 World Bank records, 130,670 kilotons of CO2 emissions were produced by Nigeria, which translates to 0.667 metric tons per Capita, a moderate value compared with the other six countries evaluated (1). Nigeria ranks among the bottom 20 on the continent on the ambient air pollution index, at 151.52 ug/m3 (2) – the highest value of the six countries evaluated. Nigeria imposes a maximum age limit on used vehicle imports of nine years (2) – the average age of imported used vehicles is unknown. Diesel fuel available currently has a sulphur content maximum of 3000 ppm (parts per million), which is unable to support even Euro 2 compliance (2). 65 AFRICA URBAN MOBILITY OBSERVATORY – ROLE OF INFORMAL PARATRANSIT REPORT For Lagos specifically, the emissions produced per sector, as measured in 2015, is presented in Figure 82. Figure 82: Emissions per sector in Lagos, 2015 (60) 82% of transport emissions, which accounts for 20% of total emissions, are generated by road transport. The consumption of jet kerosene in aviation contributes 18% of transport emissions, while 0.15% was generated by waterborne transport (see Figure 83). Figure 83: Transport emissions in Lagos by end user and fuel type, 2015 (60) 8.2.3 E-mobility initiatives and electricity generation National automotive industry development plan In anticipation of the transition towards electric vehicles globally and motivated by a desire to reduce harmful emissions in Nigerian cities, in July 2021 Nigeria’s Federal Government announced its intention to incorporate electric vehicles into the National Automotive Industry Development Plan (NAIDP) (53). It is expected that the NAIDP will be passed into law by the end of 2021 (53). Locally assembled electric vehicle In November 2020, Stallion Motors, a Nigerian vehicle assembly company based in Abuja, unveiled the first electric passenger vehicle to be produced in Nigeria, the Hyundai Kona Electric (54); this is a major milestone not just for the country, but the entire region. It is anticipated the Volkswagen will also assemble electric vehicles in Nigeria, having signed a memorandum of understanding with the Nigerian government in 2018 (55). 66 AFRICA URBAN MOBILITY OBSERVATORY – ROLE OF INFORMAL PARATRANSIT REPORT National Automotive Design and Development Agency electric vehicle pilot In 2020, Nigeria’s National Automotive Design and Development Agency (NADDC) launched it Electric Vehicle Technology Transfer pilot programme, which includes the construction of three solar electric vehicle charging stations at various university campuses across Nigeria, to encourage research and development into electric vehicle technologies in Nigeria (56). The first of these opened at the University of Lagos in 2021. Electricity generation Renewable energy sources account for 12.7% of electricity generation capacity in Nigeria (57). According to the 2011 Renewable Energy Masterplan of Nigeria, this is intended to increase to 23% by 2025, and to 36% by 2030 (58). 8.3 Regulatory and lobbying environment 8.3.1 Governance and enforcement There are almost 100 agencies at the federal, state, and local levels responsible for the organisation and regulation of urban transport in Nigeria (48). The main transport regulatory instruments include the Central Licensing Authority Law of 1980, the National Road Traffic Regulations of 1997 (adopted under the Federal Road Safety Commission Decree of 1988), and the Lagos State Road Traffic Law and subsidiary legislation dating from 1949 (48). In order to enable Lagos City to have greater control over transport matters in the city, LAMATA (Lagos Metropolitan Area Transport Authority) was founded in 2002, as an independent transport authority and the entity responsible for formulating, coordinating, and implementing urban transport policies and programs in the metropolitan area (48). LAMATA has the authority to levy and collect user charges relating to its services, and to collect other tariffs, fees, and road taxes (48), and is responsible for local traffic management schemes, parking control, and management of public transport terminals (59). At the federal level, the Ministry of Transport develops national transport policy, though urban transport functions are devolved to the states by the 1999 Constitution (48). State regulations governing road transport must be compliant with legislation, although Lagos State has not updated its traffic and transport legislation since 1949 and, as a result, is no longer compliant with Federal legislation. The main arterial roads in Lagos are Federal roads, and therefore fall under the jurisdiction of the Federal Ministry of Works and Housing, with the Federal Roads Maintenance Agency (FERMA) being responsible for maintenance (65). Vehicle standards are regulated by the National Road Traffic Regulations of 1997, per the Federal Road Safety Commission Act of 2007 (65). These Regulations also assign responsibility for the setting of maximum and minimum permitted bus fares to the Federal office of the State Director of Motor Vehicle Administration. The Motor Vehicle Administration is responsible for licensing vehicles and regulates public transport vehicles. The Lagos State Waterways Authority (LSWA) is responsible for coordinating and managing the reforms necessary for the long-term growth and development of water transport in Lagos State (81). Primary law enforcement responsibilities reside with the Nigeria Police, a federal body (65). To improve law enforcement, Lagos State Government, through the Lagos State Ministry of Transportation, mandated LASTMA (Lagos State Traffic Management Authority) to help enforce traffic laws, set new standards, encourage road regulation compliance, and oversee major transport infrastructure projects. Traffic wardens are deployed to state roads by the Lagos State Traffic Division, while traffic control and enforcement on federal roads falls under the mandate of the Federal Road Safety Commission (48). 8.3.2 Environmental protection At a national level, the Ministry of Environment is responsible for environmental protection (60). National policies and plans include, among others, the National Environmental Policy of 1989, the National Climate Change Policy and Response Strategy of 2013, and the National Adaptation Strategy and Plan of Action of 2011 (for Climate Change) (60) (61). 67 AFRICA URBAN MOBILITY OBSERVATORY – ROLE OF INFORMAL PARATRANSIT REPORT The Department of Climate Change (DCC), within the Ministry of Environment, was created to implement the Climate Change Convention and the Kyoto Protocol of 2004 activities. The National Policy on Climate Change is a strategic policy response to climate change that aims to fosters low-carbon, high-growth economic development path and to build a climate-resilient society through the attainment of set targets (61). The National Adaptation Strategy and Plan of Action for Climate Change includes 13 sector-specific strategies, policies, programmes, and measures. Its stated objective is to reduce the impacts of climate change through adaptation measures to be undertaken by the federal, state, and local (60). At a state level, environmental protection falls under the responsibility of the Lagos State Environmental Protection Agency (LASEPA) (60). The Lagos State Transport Sector Reform Law of 2018 governs the operation of commercial buses, motorcycles, and tricycles on Lagos roads. It, for example, prohibits the use of motorcycles and tricycles with an engine capacity of 200 cc on major highways within Lagos State (60). More recently, the Lagos Resilience Strategy of 2020 and Lagos Climate Action Plan (CAP) 2020 - 2025 were introduced (60). CAP 2020 – 2025 builds on earlier climate change strategies for Lagos State to deliver a package of measures that, if implemented successfully, will set Lagos on a pathway towards zero-carbon by 2050. 8.3.3 Improvement plans and policies After a series of studies conducted in the 1990s, including the Lagos Mass Transit Study (LMTS), the institutional responsibility fragmentation, traffic management weaknesses, and the absence of a cohesive urban strategy were highlighted (59). In 1999, the Lagos Urban Transport Project (LUTP) was prepared, with the primary aims being to build capacity to manage the transport system, identify priority actions, identify where investment was most urgent, and to introduce systems of measure (65). In recognition of the potential for development of rail and inland waterway mass-transit which integrated with the road passenger transport network, a multimodal transport approach was adopted (65). After founding LASTMA in 2000, LAMATA was formed in 2002 to oversee all transport-related matters in the city (59). In 2005, LAMATA financed the city’s first Strategic Transport Master Plan (STMP), which serves as the guiding framework for all transport policies until 2025 and aims to coordinate the city’s multimodal transport ambitions (59). Between 2008 and 2017, several regulatory reforms and infrastructure investments took place, including the setting of new safety standards, deployment of new technologies on bus fleets to improve passenger experience, construction of new infrastructure, including junctions, bus terminals, shelters, and rail systems (59). In 2011, the second phase of the LUTP was prepared, with the primary objectives being to improve mobility along critical corridors, and to encourage a shift towards environmentally sustainable urban transport modes. In 2013, the Lagos State Government (LSG) developed the Logos State Development Plan (2012-2025), with the key aims being to provide direction for growth and development in the state, and to provide direction to all sectors of the economy to help achieve improved quality of life for people living in the state (62). Another key initiative was the three-year Bus Reform Initiative (BRI) (2017-2019), which aimed to improve capacity and customer experience by replacing all minibus taxis with High Occupancy Vehicles (HOVs), along with increased digitalisation of the network, improved transport infrastructure, and driver training (59). An example of an outcome associated with this initiative was the launch of 500 seven-seater microbuses in 2021 as a first and last mile (FLM) service (63). In 2018, on behalf of the LSG, LAMATA initiated the development of a Non-Motorised Transport (NMT) Policy, to guide the implementation of transport systems that prioritise the needs of pedestrians and cyclists (64). In addition, LSG is currently working on a policy for the use of electric vehicles and plans to conduct a pilot using CNG buses imminently, with an electric bus pilot to follow in future (63). 8.3.4 Memberships and associations Informal paratransit minibus and midi-bus taxi operators are affiliated with one of several associations (65); the two largest being the National Union of Road Transport Workers (NURTW), and the Lagos State Urban Bus 68 AFRICA URBAN MOBILITY OBSERVATORY – ROLE OF INFORMAL PARATRANSIT REPORT Owners Association. The latter association claims membership of 3,000 owners, however only 1,270 are reported to be licenced (48). There are two BRT operators: a private sector entity called PRIMERO Transport Services; and a Lagos State government owned entity, Lagos Bus Services Limited (LBSL) (64). LBSL was created in 2016 as part of the BRI, and currently runs more than 500 buses across 40 routes. Membership to the Motorcycle Operators Association of Nigeria, for motorcycle taxis, and the Tricycle Owners Association of Nigeria, for tricycle taxis, is voluntary (63). 8.3.5 NGOs and lobby groups Arrive Alive Road Safety Initiative (AARSI) is a Nigerian NGO aiming to improve road safety awareness, and ultimately prevent traffic fatalities (66). Recent campaigns have focused on pedestrian safety, truck safety, child safety, motorcycle safety, as well as driving under the influence of alcohol, and driver distractions (such as use of cell phones while driving) (66). 8.4 Informal paratransit services analysis 8.4.1 Overview Passenger demand, supply, accessibility and LOS Officially, 70% of motorised trips in Lagos are conducted using informal paratransit services (64). Informal paratransit modes operating in the city include minibus taxis (known as ‘danfos’), midi-bus taxis (known as ‘molue’), sedan taxis (known as ‘kabukabu’), tricycle taxis (known as ‘keke napep’), and motorcycle taxis (known as ‘okada’) – see Figure 84 (59). Motorcycle and tricycle taxis emerged in the 1990s in response to a depressed economy, high unemployment, and declining levels of public transport services (48). The total number of these vehicles is unknown, since many are not registered (48). Lagos has the highest traffic index in Africa, with over five million passenger carrying vehicles, and 200,000 commercial vehicles on its roads (124). Commuters in Lagos spend an average of 1,560 hours in traffic annually, substantially higher than Moscow (210 hours), London (227 hours), or Boston (164 hours) – see Figure 86 (124). Traffic congestion is exacerbated by increased private vehicle ownership, encouraged by fuel subsidies and a lack of restriction on used vehicle imports (65). This makes it difficult for informal paratransit operators to run reliable and frequent services, with many areas receiving little, if any service at all (64); generating sufficient revenue in this environment is a challenge. Despite the critical role of paratransit in supporting mobility services across the city, the relationship between LSG and paratransit operators is characterised by conflict (63). This is largely because vehicles are old and poorly maintained, and therefore uncomfortable, unreliable and unsafe. In 2008, LSG introduced a curfew preventing motorcycle taxis operating between 7pm and 6am (48). In 2013, LSG banned midi-bus taxis altogether from Lagos Island (125). Currently tricycle and motorcycle taxis are prohibited from operating on major state highways (81). Under the BRI initiative, in mid-2021, 500 seven-seater micro-buses were introduced as a semi-formalised FLM service, intended to replace tricycle and motorcycle taxis which had been providing feeder services to the BRT network. The micro-buses are operated through a public-private partnership, with imported new Chinese vehicles – see Figure 85 (63). 69 AFRICA URBAN MOBILITY OBSERVATORY – ROLE OF INFORMAL PARATRANSIT REPORT Figure 84: Informal paratransit modes in Lagos: midi and minibus taxis, sedan taxis, tricycle taxis and motorcycle taxis Figure 85: Microbus taxis in Lagos (63) Figure 86: Minibus taxis congest the main road in Lagos (59) 70 AFRICA URBAN MOBILITY OBSERVATORY – ROLE OF INFORMAL PARATRANSIT REPORT Network characteristics Lagos State has a total road network of 9,900 km, of which 509.97km are federal roads, 5,816.71 km are state roads and 3,573.71 km are local roads (62). Informal paratransit services make use of this extensive (80). Approximately 50% of the city’s urban roads are tarred (63), although the infrastructure is aged and poorly maintained (81). There is a major roadway improvement programme currently underway (63). Facilities Prior to the introduction of BRT in 2008, Lagos did not have a single formal bus stop (59). Today, there are approximately 260 formal bus stops, which are used not only by formal public transport services, but informal paratransit vehicles too (59). Despite most of these bus stops being approximately only 10 years old, many are in poor condition, and have no seating, in order to deter loitering (63). There are approximately 50 open- air minibus taxi interchanges (known as ‘garages’) across the city, each able to accommodate around 50 minibuses (63). Many of these facilities are close to BRT stops, allowing ease of mode change (63). Some are paved with bricks, although most are gravel, and a small number have facilities such as shops and bathrooms. They have no wayfinding signage; while vehicles have the official licenced destination printed on a placard on their doors, they are permitted to operate other routes, and therefore seldom adhere to the registered route. Drivers and conductors therefore announce the actual destination to passers-by (63). Often these facilities are adjacent to major highways, and while there are often pedestrian bridges, most passengers find it more convenient to cross the highways on foot, as the bridges result in a more circuitous route (63). Tricycle and motorcycle taxis do not have dedicated facilities and tend to park nearby minibus facilities (63). Figure 87: Informal paratransit facilities in Lagos (63) 71 AFRICA URBAN MOBILITY OBSERVATORY – ROLE OF INFORMAL PARATRANSIT REPORT 8.4.2 Minibus and midi-bus taxis In 2008, minibus and midi-bus taxis accounted for around 69% of all motorised trips, operating mostly longer distance services (59). While this has since decreased to around 60%, they are still the dominant mode of transport in Lagos (63). The fleet is estimated to be 75,000 vehicles, and mostly comprises minibuses rather than midi-buses (48). Due to the higher cost of midi-buses, their share has declined considerably (48). The minibus taxi and midi-bus taxi operations comprise two divisions: owners and crews (drivers and conductors) (48). Typically, the crew rents a vehicle from an owner for a daily fee, which varies depending on the condition and capacity of the vehicle, and the route on which it operates. Most owners have at most three or four buses. A target operating model where the crew pays for fuel, association fees, and minor running repairs prevails (48). Terminals are controlled by taxi associations, which have the ability to restrict access to the various routes (48). As vehicles depart, so the association collects a fee; drivers who attempt to avoid paying this fee by turning short of the terminus typically are harassed by association representatives. Some taxi associations operate at informal curb-side terminals (48). It is unknown to what degree the associations are democratic or whether there is any transparency in terms of how membership fees are spent. It is alleged that there are parasitic elements among the associations, which extort money from drivers – a portion of which is allegedly passed on to the police and other regulators (48). Some associations have arranged with banks to enable minibus taxi drivers to purchase vehicles, albeit at a high rate of interest (48). While vehicles have the official licenced destination printed on a placard on their doors, they are permitted to operate other routes, and therefore seldom adhere to the registered route. Drivers and conductors therefore announce the actual destination to passers-by (63) Minibus and midi-bus taxis accept cash only (63), and fares are not regulated, with substantial variations throughout the day (64); factors taken into consideration by drivers when determining fares include distance travelled, route, traffic conditions, weather conditions, and period of travel (64). Passengers can pay up to nine times more for trips during peak periods than for the same trip during off-peak periods. By comparison, BRT fares are typically between 30% and 50% less than those of minibus taxis (124). The share of household budget spent on transport equates to 14% (48). It is understood that around 21% of minibus taxi drivers do not hold a valid driver’s licence (48). It is estimated that 37% of informal paratransit vehicles operate without valid certificates of roadworthiness, and 47% without valid test certificates (48). In an attempt to address this, a new informal paratransit vehicle inspection regime was introduced for vehicles exceeding five years. The scheme has not been successful at raising the standard of informal paratransit vehicles (48). Minibus and midi-bus taxis are identifiable by their yellow exterior and carry between 12 and 18 passengers (48). Most minibus taxis are well over 15 years old and are generally in very poor condition. Common models include Volkswagen Transporter and LT, and Toyota HiAce. They are mostly imported used vehicles from Europe and China (63). Although far less common, midi-bus taxis have a passenger capacity ranging from around 30 to 50 (part seated, part standing). These vehicles are often older than 40 years, with the Mercedes L911 being the most popular model (48). 8.4.3 Sedan taxis Sedan taxis (known as ‘kabukabu’) have a mode share of less than 5% and operate area-based shared taxi services (63) – see glossary of terms for further details on this operating model. They are unregulated and can be hailed from the side of the road (63). They do not operate on a schedule, or along fixed routes, and accept cash only (63). 8.4.4 Motorcycle and tricycle taxis Motorcycle and tricycle taxis do not operate on a schedule, or along fixed routes, but are area-based services (63). Having no formal facilities, they park along the side of streets near minibus taxi terminals, supporting feeder style trips (63). Fares are cash-based only, and are negotiated by passengers and drivers, with a number of factors being taken into consideration, including distance to be travelled, area of travel, period of 72 AFRICA URBAN MOBILITY OBSERVATORY – ROLE OF INFORMAL PARATRANSIT REPORT travel, and even weather conditions (63). Motorcycle taxis operate both short and longer distance services (and are favoured for longer trips during heavy congestion, due to their manoeuvrability) (63). Tricycle taxis typically only operate short distance services (63). 8.5 AUMO data analysis 8.5.1 Mobility data The insights drawn from the AUMO Mobility Survey Data (considering mode share and travel time, disaggregated by income level and gender, on public and informal paratransit services) in Lagos are reviewed in this sub-section. It should be noted that since the desired sample size was not reached in Lagos (as only intercept data was available – see Section 3.3 for further details), these results should not be interpreted to be reflective of the entire population of the city. While survey results suggest that BRT is by far the most popular modes across all income groups (see Figure 88), LAMATA confirmed that BRT mode share is closer to 25%. This is likely due to the inadequate sample size due to only intercept survey data being available (63). Figure 88: Lagos mode share by income level At 100 minutes per day, women respondents reported spending on average just two minutes more travelling than men respondents (see Figure 89). Note that there were no non-binary respondents. Figure 89: Lagos travel time by gender In Lagos, only one respondent chose cycling as their main mode, and one chose water ferry as their main mode. Travel times for BRT, bus and minibus taxi were reported by respondents to be very similar on average (97, 99, 105 minutes respectively) – see Figure 90. The fastest mode was reported to be motorcycle taxi (52 minutes per day), followed closely by private vehicle (61 minutes per day). 0% 20% 40% 60% 80% 100% 0 - 99 USD 100 - 249 USD 250 - 499 USD 500 - 999 USD 1000 - 1999 USD 2000 plus USD Prefer not to say Lagos Mode Share by Income Level Walking Cycling Private Transport Bus Minibus Taxi BRT Motorbike/Tricycle Taxi Water Ferry 0 20 40 60 80 100 120 Male Female Average Travel Time (minutes) Lagos Travel Time by Gender 73 AFRICA URBAN MOBILITY OBSERVATORY – ROLE OF INFORMAL PARATRANSIT REPORT Figure 90: Lagos travel time by mode 8.5.2 User experience data The insights drawn from the AUMO Survey Data (considering crime, driver behaviour, comfort, and sexual harassment on public and informal paratransit services) in Lagos are reviewed in this sub-section. As illustrated in Figure 91, survey respondents in Lagos feel somewhat safe from crime, with 73% having never experienced or witnessed crime while travelling. This number seems unusually high and is more likely a result of a lack of sufficient data than an accurate reflection of the broader population’s perceptions of crime. Figure 91: Lagos crime on public and informal paratransit (AUMO survey data – occurrence) As illustrated in Figure 92, the majority of respondents (75%) feel that driver behaviour is either acceptable or excellent. 0 50 100 150 200 Minibus Taxi Bus Sedan / MPV Taxi Private Transport Cycling BRT Motorbike/Tricycle Taxi Water Ferry Average Travel Time (minutes) Lagos Travel Time by Mode 72.95% 16.19% 9.25% 1.60% Lagos Crime on Public and Informal Paratransit - Occurrence Never Once More Than Once Often 74 AFRICA URBAN MOBILITY OBSERVATORY – ROLE OF INFORMAL PARATRANSIT REPORT Figure 92: Lagos public and informal paratransit driver behaviour (AUMO survey data) As illustrated in Figure 93, the vast respondents (71%) feel that comfort levels are acceptable. Figure 93: Lagos public and informal paratransit comfort (AUMO survey data) As illustrated in Figure 94, for a large majority (63%) of respondents, services usually run late. Conversely, 27% of respondents stated services usually run on time. 25.27% 65.12% 9.61% Lagos Public and Informal Paratransit Driver Behaviour Poor Acceptable Excellent 14.52% 70.95% 14.52% Lagos Public and Informal Paratransit Comfort Poor Acceptable Excellent 75 AFRICA URBAN MOBILITY OBSERVATORY – ROLE OF INFORMAL PARATRANSIT REPORT Figure 94: Lagos public and informal paratransit reliability (AUMO survey data) As illustrated in Figure 95, while a large majority (82%) of respondents stated that they had never seen or experienced sexual harassment while travelling, and only 18% reported otherwise, it is possible that those that claimed to have never seen or experienced sexual harassment may actually have seen or experienced sexual harassment, but perhaps only consider sexual harassment to refer to the more violent forms. Figure 95: Lagos public and informal paratransit sexual harassment (AUMO survey data – occurrence) 24.91% 69.57% 5.52% Lagos Public and Informal Paratransit Reliability Usually Late Usually On Time Always On Time 82.38% 10.68% 5.69% 1.25% Lagos Public and Informal Paratransit Sexual Harassment - Occurrence Never Once More Than Once Often 76 AFRICA URBAN MOBILITY OBSERVATORY – ROLE OF INFORMAL PARATRANSIT REPORT 9. Maseru findings 9.1 City overview Maseru, situated in the northwest (see Figure 96), is the capital city of Lesotho, with a population size of 330,760 inhabitants as of 2016 (126). Maseru is characterised by rapid growth and development, with a population growth rate of over 5% per annum (126). It spans approximately 143 km2 , of which 99 km2 is developed, mostly at low density (70). Driving this growth is primarily labour-oriented industry, such as textiles (70). Employment opportunities and access to services are limited, however, and the sprawling urban environment exacerbates this further (70). Figure 96: Map of Lesotho (127) 9.2 Urban transport services overview 9.2.1 Modal split In August 2021, 567 respondents across Maseru participated in an intercept survey, in which enumerators asked questions about their travel behaviour and experiences while travelling in the city. The survey was conducted over a period of three days and was administered at major transport interchanges and informal paratransit ranks. Modal split was calculated from this data, and the results are presented in Figure 97. A comprehensive list of transport services available in the city is presented in Table 9. Figure 97: Maseru transport modal split (90) 7.05% 1.41% 7.23% 2.65% 57.32% 24.34% Maseru Transport Modal Split (AUMO Survey Data - Main Mode of Transport Walking Cycling Private Transport (Private Car/Metered Taxi) City Bus Minibus Taxi (Informal Paratransit) Sedan Taxi (Informal Paratransit) 77 AFRICA URBAN MOBILITY OBSERVATORY – ROLE OF INFORMAL PARATRANSIT REPORT Table 9 – Passenger transport modes in Maseru Mode Present Description NMT Yes Despite walking being the primary mode of transport in the city, there is little dedicated NMT infrastructure, resulting in pedestrians having little choice but to share roads with motorised traffic (70). Metered Taxi No There is no metered taxi service currently operating in Maseru. Passenger Rail No There is no passenger rail service currently operating in Maseru. Bus Yes The bus services were discontinued in the 1990s (70). More recently bus services were reintroduced, however they operate a very limited service, at very low frequencies. Most bus operations only offer inter-city services (70). BRT No There is no BRT service currently operating in Maseru. Ferries/Boats No There is no ferry/ boat service currently operating in Maseru. Informal Paratransit Yes Informal paratransit services make up the majority of motorised transport travel across the city, comprising privately owned and operated minibus and sedan taxis (70). 9.2.2 Environmental impact Worldometer CO2 emissions trends (disaggregated by sector) observed over a 40-year period, from 1970 to 2010, for Lesotho can be seen in Figure 98. According to Worldometer, the sources of this data are as follows: Emission Database for Global Atmospheric Research (EDGAR); CO2 Emissions from Fuel Combustion - IEA; World Population Prospects: The 2019 Revision - United Nations Population Division (92). Years 2011 to 2017 are presented in Figure 99. At a national level, per 2018 World Bank records, 2,570 kilotons of CO2 emissions were produced by Lesotho, which translates to 1.2 tonnes per Capita, the second highest compared with the other six countries evaluated (1). The residential sector is the largest contributor to this sector’s emissions accounting for 65.3% in 2016 (minimum) and 69.7% in 2013 (maximum); civil aviation is the smallest contributor accounting for between 0.006% (in 2011) and 0.033% (in 2017) (71). The transport sector emissions were 390.65 Gg CO2e in 2011, increasing to 466.85 Gg CO2e in 2017. Road transport accounted for over 99% of all the transport emissions throughout that period (71). Lesotho’s road transport CO2 emissions, disaggregated by vehicle type, can be seen in Figure 100. Passenger cars are the fastest growing source of CO2 emissions. Lesotho imposes a maximum age limit on used vehicle imports of five years (2); the average age of imported used vehicles is unknown. Diesel fuel available currently has a sulphur content maximum of 50 ppm (parts per million), which would support Euro 4 compliance if this were to be legislated (2). 78 AFRICA URBAN MOBILITY OBSERVATORY – ROLE OF INFORMAL PARATRANSIT REPORT Figure 98: Lesotho CO2 emissions (tons) over 40 years (92) Figure 99: Lesotho energy sector CO2 emissions (disaggregated by sector): 2011 – 2017 (71) Figure 100: Lesotho road transport CO2 emissions (disaggregated by vehicle type): 2011 – 2017 (71) 79 AFRICA URBAN MOBILITY OBSERVATORY – ROLE OF INFORMAL PARATRANSIT REPORT 9.2.3 E-mobility initiatives and electricity generation Draft renewable energy policy The Lesotho draft Renewable Energy Policy of 2013 recommends the introduction of a range of incentives to encourage the transition to electric vehicles, including the following (67): • Reduce VAT (value added tax) on EVs (electric vehicles) and PHEVS (plug-in hybrid electric vehicles); • Reduced road tax on EVs and PHEVs; • Reduced electricity tariffs for off-peak EV and PHEV charging; • Incentives to encourage fleet operators to switch to electric trucks, buses and taxis. It is unclear why this policy, eight years after the draft was released, has still not been ratified. Electricity generation Over 50% of electricity consumed in Lesotho is imported from neighbouring countries (68). Local generation capacity is 99.7% hydroelectric, with plans underway to expand local generating capacity further using renewable energy sources (69). 9.3 Regulatory and lobbying environment 9.3.1 Governance and enforcement The Ministry of Public Works and Transport (MoPW&T) is the primary authority responsible for overseeing transport related matters in the city, including the following (70): • Construction, maintenance, operation, marking, signing, change of traffic arrangements, and traffic signalling for all roads; • Licensing of public transport vehicles and drivers, authorising routes and fares (regulated through Road Transport Board), and enforcement of regulations; • Vehicle and driver licensing. The Department of Traffic and Transport, led by the Traffic Commissioner, who reports to the MoPW&T, is responsible for vehicle registration, vehicle licensing roadworthiness testing, driver testing and licensing, as well as issuing and enforcement of transport permits, and compliance with road regulations. The Ministry of Local Government and Chieftainship (MCC), which is responsible for land allocation in coordination with traditional chiefs, is also responsible for construction and maintenance of all local roads. The Roads Fund (Ministry of Finance) is a separate body with dedicated resources (fuel levy, licensing fees, border toll-gate fees, etc.), financing and auditing of road maintenance of major roads (70). Lesotho became a formal constitutional democracy in 1993, which was followed by the Lesotho's Constitution of 1993 with Amendments through 1998. This Constitution is the supreme law of Lesotho, protecting fundamental human rights and freedoms by dictating order concerning citizenship, the King and the Parliament. The main transport regulatory instruments include the following (70): Road Act of 1969; Town and Country Planning Act No. 11 of 1980; Road Traffic Act of 1981; Road Traffic Regulations of 1981; Urban Government Act 3 of 1983; Town and Country Planning (Control of Advertisements) Regulations of 1991; Town and Country Planning (Land Use and Building Use Classes) Order of 1991; Town and Country Planning (Development) (Amendment) Regulations of 1993; Building Control Act No. 68 of 1995; Local Government Act of 1997; and Environment Act of 2008 Supplement No.1 of Gazette No. 80. 9.3.2 Environmental protection At a national level, the Ministry of Energy and Meteorology is responsible for environmental protection (71). Lesotho’s first national greenhouse gas inventory was compiled in 2000 for 1994, while the second was undertaken for 2000 and was published in 2013. The first two inventories were based on the revised 1996 Intergovernmental Panel on Climate Change (IPCC) guidelines. Lesotho’s third national greenhouse gas inventory was published in 2018, covering the years 2005 to 2010, with the fourth published in 2019 covering the years 2011 to 2017. The last two inventories have been compiled using the 2006 IPCC guidelines (71). 80 AFRICA URBAN MOBILITY OBSERVATORY – ROLE OF INFORMAL PARATRANSIT REPORT Emissions are regulated through the Lesotho Environment Act 10 of 2008 and are monitored by the Lesotho Meteorological Services (LMS). LMS is the national inventory agency with the overall responsibility for compiling the national greenhouse gas inventories, including the emissions from the energy sector which encompasses road transport (71). Lesotho is in the process of developing a National Adaptation Plan with the support of the United Nations Framework Convention on Climate Change Kampala Regional Collaboration Centre (72). 9.3.3 Improvement plans and policies Following independence in 1966 and the incorporation of vast tracts of land and numerous villages in the boundaries of the city, it became evident that there was a need for a comprehensive development plan for the city (70). The Maseru Development Plan (MDP) was commissioned by the Department of Lands, Survey and Physical Planning, Physical Planning Division, and was completed in 1990 (70). The MDP has since been implemented only to a very limited extent, largely due to capacity and resource constraints (70). Subsequent to the MDP, various bodies have planned different elements of the city (70). The Department of Lands, Surveys and Physical Planning (LSPP) has planned and subdivided specific areas, the Lesotho National Housing Development Corporation (LNHDC) has planned and developed new residential areas, and the Lesotho National Development Corporation (LNDC) has planned and developed new industrial areas. Various ministries and public bodies, and a few private developers, have also planned and developed specific developments. Examples of plans following the MDP include (70): • The Integrated Strategic and Spatial Development Framework (SDF): integrated schematic expression of a proposed coordinated policy for the development and conservation of spatial and physical resources in Maseru, including transport, to enable and direct the development of the city to 2030; • The Transport Development Plan: aims to promote of safe, direct, and high-quality pedestrian movements within Maseru through the development of a high-standard city-scale Sidewalk Backbone Network, along the main pedestrian corridors; • Maseru City Council (MCC) Strategic Plan: defines a clear Mission Statement for Maseru as “a vibrant, innovative and people centred city committed to sustainable environment (p. 146)†and mandates the MCC to provide accessible quality services and to promote local socio-economic growth and development in meeting the changing needs of the communities; • Vision 2020: a comprehensive strategic development roadmap for Lesotho, laying out a wide range of development goals and objectives. 9.3.4 Memberships and associations Minibus operators are organised into associations defined by geography and mode in the South, North and Central Regions of the city (29). These associations include: • Maseru Regional Taxi Association (MRTO) – Minibuses and sedan taxis; • Mejametalane Transport Operators – Minibuses and sedan taxis; • Central Region Taxi Association – sedan taxis only; • Steering Committee – sedan taxis only. 9.3.5 NGOs and lobby groups Established in 1990, the Lesotho Council of Non-Governmental Organisations (LCN) is an umbrella organisation which supports NGOs by facilitating networking, capacity building and coordination (73). There are no known NGOs dedicated to transport related matters, however in 2016, LCN coordinated a road safety campaign with the support of the Puma Energy Foundation, and an NGO called AMEND (73). 81 AFRICA URBAN MOBILITY OBSERVATORY – ROLE OF INFORMAL PARATRANSIT REPORT 9.4 Informal paratransit services analysis 9.4.1 Overview Passenger demand, supply, accessibility and LOS Officially, informal paratransit services support over 80% of motorised trips across Maseru, transporting approximately 48 million passengers annually (70). It is estimated that by 2030, passenger demand for motorised informal paratransit trips will increase to 70 million. The informal paratransit modes operating in the city are minibus and sedan taxis – see Figure 101 (70). Despite private vehicle ownership being low (approximately 60 to 70 vehicles per 1,000 population), roads used by informal paratransit vehicles become heavily congested during peak periods – see Figure 102 (70). There are several contributing factors. The road network itself is under-developed and without adequate traffic signalling, although the main issue is a lack of adequate regulation of the sector, especially in terms of issuing of route licences. No attempts are made by the city to optimise the number of sedan and minibus taxi route licences issued to match the demand, as there is no centralised database monitoring the number of route licences in circulation (29). Route licences cost less than GBP 6 and GBP 9 per annum for sedan and minibus taxis respectively, and as a result, many routes are over-saturated. Conversely, there are many routes which are under-served since they are not sufficiently profitable for operators. Over-saturated routes are not only congested, but also challenging to operate profitably, since there are too many vehicles competing for the same passengers (29). The Road Transport Board specifies that public transport vehicles must have copies of their timetable and fare structure readily available. This requirement is not adhered to by informal paratransit services since they are an informal unscheduled service (70). They operate instead on a fill-and-go system, where vehicles typically only depart from ranks once they are full. Levels of service therefore vary considerably across the city and are travel period dependent. During off-peak periods, waiting times of up to two hours are not uncommon. Figure 101: Informal paratransit modes in Maseru: minibus and sedan taxis (29) Figure 102: Example of long queues in Maseru (70) 82 AFRICA URBAN MOBILITY OBSERVATORY – ROLE OF INFORMAL PARATRANSIT REPORT Network characteristics Maseru’s roads are mostly in poor condition, with just a few being tarred (70). This has a significant impact on operating costs since high rates of wear and tear are experienced. As a result, some outlying areas are not served by informal paratransit at all. This leaves many communities without access to motorised transport. Facilities Informal paratransit facilities lack wayfinding signage and have no segregation between motorised and nonmotorised traffic. Most ranks are open-air and untarred and lack facilities such as shops and bathroom (29). 9.4.2 Minibus taxis Official 2011 figures suggest that minibus taxis constitute 74% of motorised transport trips across Maseru (70). Through on-the-ground evaluation in 2020, it was apparent that this share has since declined, due to a dramatic increase in the number of sedan taxis operating in the city (29).This was verified by the results of the AUMO intercept surveys conducted in August 2021, in which just 24% of respondents stated that minibus taxis were their main mode of travel (90). During peak periods, minibus taxis operate fixed route services, travelling between two terminals. During offpeak periods, many operators deviate from their primary route to serve neighbouring suburbs aligned with this route (29). To support a World Bank study on informal paratransit in Maseru finalised in 2021, several minibus taxis were mapped using GoMetro Pro. The map generated is shown in Figure 103. Minibus taxis passenger capacities range from 10 to 18. The most popular model is the Toyota HiAce, which is sourced used from South Africa and the Japanese second-hand markets. They tend to be in shorter supply than sedan taxis, and therefore tend to have high mileage; they are on average 18 years of age. Minibus taxi fares are regulated (distance-based) by the Road Transport Board and are slightly higher than sedan taxis (29). They also tend to take longer to fill with passengers at ranks, and therefore waiting times are considerably longer. They are also less reliable and less predictable, and their routes are less flexible (especially during peak periods). Despite being a more efficient service, in terms of revenue generation, they are decreasing in popularity in the city because of their disadvantages for passengers. Most minibus taxi operations consist of no more than two vehicles owned by a family, and which are typically driven by family members (29). Vehicles which are not driven by owners typically operate on either a commission or target-based business model (see glossary of terms for further details). Since informal paratransit services are cash-based, with no tickets being issued, owners have no way of verifying revenue generation each day, and thus raises the risk under-reporting of revenue by drivers. The target model mitigates this risk since owners assign a fixed daily revenue target for their drivers; revenue above this target is then retained by the driver (29). Given the informal fragmented nature of minibus taxi operations, most operators do not keep record of their operational expenditures. Further, in the absence of adequately regulated operating permits, competition between drivers is high, making it very difficult for operators to turn a profit. Minibus taxis do however generate higher earnings per kilometre than sedan taxis, since sedan taxis run far more circuitous routes, making them significantly less efficient (29). With tight operating margins, many operators are unable to afford regular preventative maintenance on their vehicles. As a result, repairs might only be performed when components fail to the extent that the vehicle cannot be driven. This not only results in vehicles being taken out of service for longer periods (thereby losing revenue), but also leads to greater damage to the vehicle, and higher maintenance costs long term (29). 83 AFRICA URBAN MOBILITY OBSERVATORY – ROLE OF INFORMAL PARATRANSIT REPORT Figure 103: Minibus taxi network in Maseru (29) 9.4.3 Sedan taxis Official 2011 figures suggest that sedan taxis support just 6% of motorised transport trips across Maseru (70). Through on-the-ground evaluation in 2020, it was apparent that there has been a substantial increase in the number of sedan taxis operating since 2011 (29). This was verified by the results of the AUMO intercept surveys conducted in August 2021, in which 57% of respondents stated that sedan taxis were their main mode of travel (90). A key contributor to the rapid increase in sedan taxis is the relatively low cost of entry, as a result of the abundant supply of reliable and affordable imported used vehicles from the Far East (29). Popular models include the Toyota Corolla and Honda Fit; on average sedan taxis are around 20 years old (29). While minibus taxis tend to adhere to fixed routes, sedan taxis are more flexible, and are even willing to provide door-to-door services, especially during off-peak periods (29). Officially they are licenced to operate freely within a radius of 10 km of their allocated zone (29). Many sedan taxis travel beyond this limit (29). To support a World Bank study on informal paratransit in Maseru (2021), several minibus taxis were mapped using GoMetro Pro. The map generated is shown in Figure 104. During peak periods, like with minibus taxis, sedan taxis queue at the terminals to receive passengers; a vehicle’s position in the queue is not always defined on a first-come-first-served basis, as the respective route association will often dictate which vehicles get priority, based on the strength of the relationship between the operator and the association. While the city authority places no restrictions on the number of sedan taxi route licences in circulation, informal paratransit associations function as de facto gatekeepers to the various routes (29). New entrants wishing to operate a route must be granted membership by a corresponding association managing that route. During off-peak periods, rather than queuing at terminals for passengers, sedan taxis often change to a roaming model, searching for demand across the network (29). Fares are negotiated between passengers and drivers prior to departure and are based on the travel distance and direction of travel. Sedan taxi drivers’ routes are highly circuitous, since their routes are defined according to the needs of the passengers, who typically have different destinations, albeit in a similar travel direction. Typically, sedan taxi fares are lower than those of minibus taxis. They are also usually more comfortable, and have shorter waiting times at ranks, since they are smaller and therefore take less time to fill with passengers. As a result, sedan taxis are most informal paratransit users’ preferred mode. 84 AFRICA URBAN MOBILITY OBSERVATORY – ROLE OF INFORMAL PARATRANSIT REPORT Figure 104: Sedan taxi (4+1) network in Maseru (29) 9.5 AUMO data analysis 9.5.1 Mobility data The insights drawn from the AUMO Mobility Survey Data (considering mode share and travel time, disaggregated by income level and gender, on public and informal paratransit services) in Maseru are reviewed in this sub-section. It should be noted that since the desired sample size was not reached in Maseru (as only intercept data was available – see Section 3.3 for further details), these results should not be interpreted to be reflective of the entire population of the city. Those earning in excess of 1,000 USD per day reported using private transport as their main mode in Maseru (see Figure 105). Those earning less than this reported using sedan taxis as their main mode, followed by private vehicles for those earning between 500 and 999 USD, and minibus taxis, for those earning less. Figure 105: Maseru mode share by income level At 61 minutes on average, women respondents reported spending two minutes more traveling each day than men in Maseru (see Figure 106). Note that there were no non-binary respondents. 0% 20% 40% 60% 80% 100% 0 - 99 USD 100 - 249 USD 250 - 499 USD 500 - 999 USD 1000 - 1999 USD 2000 plus USD Maseru Mode Share by Income Level Walking Cycling Private Transport Bus Minibus Taxi Sedan / MPV Taxi 85 AFRICA URBAN MOBILITY OBSERVATORY – ROLE OF INFORMAL PARATRANSIT REPORT Figure 106: Maseru travel time by gender In Maseru, respondents who use motorised modes (bus, minibus taxi, sedan taxi, and private transport) on average recorded travel times within a relatively narrow range of 57 and 68 minutes (see Figure 107). In total, 40 respondents indicated that walking was their main mode of travel, and on average spend 62 minutes per day travelling. Figure 107: Maseru travel time by mode 9.5.2 User experience data The insights drawn from the AUMO Survey Data (considering crime, driver behaviour, comfort, and sexual harassment on public and informal paratransit services) in Maseru are reviewed in this sub-section. As illustrated in Figure 108, respondents in Maseru feel somewhat safe from crime, with 78% stating that they have never experienced or witnessed crime while travelling. 0 10 20 30 40 50 60 70 Male Female Average Travel Time (minutes) Maseru Travel Time by Gender 0 10 20 30 40 50 60 70 80 Walking Minibus Taxi Bus Sedan / MPV Taxi Private Transport Cycling Average Travel Time (minutes) Maseru Travel Time by Mode 86 AFRICA URBAN MOBILITY OBSERVATORY – ROLE OF INFORMAL PARATRANSIT REPORT Figure 108: Maseru crime on public and informal paratransit (90) As illustrated in Figure 109, while the majority of respondents (63%) feel that driver behaviour is acceptable, a significant proportion (33%) stated that driver behaviour is poor. Figure 109: Maseru public and informal paratransit driver behaviour (90) As illustrated in Figure 110, the majority of respondents (84%) feel that comfort levels are acceptable or excellent. 77.79% 15.16% 5.97% 1.07% Maseru Crime on Public and Informal Paratransit - Occurrence Never Once More Than Once Often 32.98% 63.49% 3.53% Maseru Public and Informal Paratransit Driver Behaviour Poor Acceptable Excellent 87 AFRICA URBAN MOBILITY OBSERVATORY – ROLE OF INFORMAL PARATRANSIT REPORT Figure 110: Maseru public and informal paratransit comfort (90) As illustrated in Figure 111, for a large majority (77%) of respondents, services usually or always run on time. Figure 111: Maseru public and informal paratransit reliability (90) As illustrated in Figure 112, a large majority (88%) of respondents stated that they had never seen or experienced sexual harassment while travelling. While only 12% reported otherwise, it is possible that those that claimed to have never seen or experienced sexual harassment may have seen or experienced sexual harassment, but perhaps only consider sexual harassment to refer to the more violent forms. 16.32% 78.66% 5.02% Maseru Public and Informal Paratransit Comfort Poor Acceptable Excellent 23.46% 71.43% 5.11% Maseru Public and Informal Paratransit Reliability Usually Late Usually On Time Always On Time 88 AFRICA URBAN MOBILITY OBSERVATORY – ROLE OF INFORMAL PARATRANSIT REPORT Figure 112: Maseru public and informal paratransit sexual harassment (90) 87.73% 7.28% 4.99% 0.00% Maseru Public and Informal Paratransit Sexual Harassment - Occurrence Never Once More Than Once Often 89 AFRICA URBAN MOBILITY OBSERVATORY – ROLE OF INFORMAL PARATRANSIT REPORT 10. Discussion In all six cites, informal paratransit services fulfil an essential role in terms of enabling a large proportion of urban dwellers to access opportunities, which otherwise would likely be inaccessible. These services are, however, far from perfect and face numerous challenges that reduce their efficiency, increasing fuel consumption and harmful emissions, their ability to generate sufficient revenue and which, ultimately, contribute to poor levels of service. It is thus unsurprising that local authorities tend to have conflicting attitudes towards these services; with often strong desires to replace them with formalised services. In the absence of funding to support the formalisation of the sector, there is a need to explore reform strategies, which take advantage of the strengths and resilience associated with informal paratransit services, while introducing interventions which mitigate for their weaknesses. In this section, a summary of the strengths and weaknesses broadly associated with informal paratransit services operating in the six cities is presented. This is then followed by a more detailed evaluation of the informal paratransit reform strategies adopted in Kigali and Lagos over the past decade. This section then concludes with a summary of the city specific challenges and opportunities for reform. 10.1 Strengths and weaknesses associated with informal paratransit In this sub-section, the general strengths and weaknesses associated with informal paratransit services, as identified through evaluation of the six case study cities, and through discussion with an industry expert (74), are presented. Strengths Demand responsive: Informal paratransit services typically do not adhere to timetables, and have flexible route profiles, and in the absence of strong regulatory environments they are free to adapt their services to match demand. Scale: Informal paratransit operations typically run smaller vehicles, such as minibuses and sedans, as well as motorcycles and micro-mobility vehicles – this gives operators the flexibility to choose ‘right-sized’ vehicles for the area being serviced, which in turn allows them to service areas with lower demand. Low barriers to entry: Operators can enter the market with just a single vehicle and can select a vehicle type based on what they can afford. In addition, many cities do not limit the number of operating licences. Sweating of assets: Operators can use privately owned vehicles to support informal paratransit services and their own transportation needs. Use of passenger vehicles: Many informal paratransit operations use regular mass-produced passenger vehicles (unlike formal public transport modes which typically run specialised vehicles, produced at low volumes). Consequently, the capital and maintenance cost of informal paratransit vehicles is considerably less, parts are generally more readily available, and mechanics do not need to be as specialised. Weaknesses Safety concerns: Informal paratransit services are often characterised by old, poorly maintained vehicles, which are driven aggressively by drivers competing for passengers in order to exceed their daily targets. Drivers also drive long hours in order to service both the morning and evening peaks each day – this environment is enabled by the lack of adequate regulatory interventions. Over-saturated market: While the low barriers to entry are a strength from the perspective of new entrants into the market, over saturation of the market is common consequence, which reduces profit margins for existing operators. This in turn results in vehicles being poorly maintained, and conflicts erupt between competing operators. Predatory associations: In the absence of strong regulatory environments, informal paratransit associations can hold enormous power. This allows them to extort high fees from operators, who often have little choice but to maintain memberships if they wish to operate. 90 AFRICA URBAN MOBILITY OBSERVATORY – ROLE OF INFORMAL PARATRANSIT REPORT Poor levels of service: A lack of centralised coordination and planning results in high levels of inefficiency, and unpredictable/poor levels of service, especially during off-peak periods. More profitable routes tend to become over saturated, while less profitable routes have inadequate service. Congestion: Vehicles are often chosen based on operators’ budgets, rather than the optimum capacity vehicle for the route. This can result in high demand routes becoming congested with smaller informal paratransit vehicles (which would be better served with larger capacity vehicles). Vehicle emissions: Given the age and poor condition typically associated with informal paratransit vehicles, combined with often over-saturated networks with many smaller and less efficient vehicles in high demand areas, vehicle emissions are substantially higher than they would be if services were better optimised. This is discussed in more detail in Section 10.2, below. 10.2 Factors affecting informal paratransit vehicle emissions The key factors impacting on informal paratransit vehicle emissions are as follows (74): • Informal paratransit operators often choose their vehicles based solely on their budget, rather than the needs of the operating environment – therefore, smaller vehicles, which use more fuel per passenger, might be chosen instead of larger vehicles, which may be more efficient; • Over-saturated markets, due to inadequate limits on informal paratransit operating licences, results in less efficient use of vehicles, heavier congestion, and therefore increased fuel consumption per passenger; • Heavily congested road networks result in excessive vehicle idling and stop/starts, which reduce vehicle efficiency; • Most informal paratransit vehicles are older than 10 years, and often poorly maintained. As a result, not only are these vehicles powered by older generation engines, which are less efficient and more polluting by design, but they no longer run optimally, and therefore emit even more harmful emissions (see Section 2.2.2 for further details); • The ‘target’ system encourages aggressive driver behaviour, which results in excessive fuel consumption and engine wear; • Many cities do not have vehicle standards, vehicle emission standards, or fuel standards in place (and where standards do exist, enforcement is poor); • Many urban roads are not tarred, resulting in higher fuel consumption due to higher rolling resistance, and hence higher vehicle emissions, as well as dust during dry seasons. 10.3 Approaches to informal paratransit reform There is increasing acceptance that replacement of informal paratransit services with formalised public transport is simply not viable in many sub-Saharan African cities (74). There is thus, subsequently, a need to identify ways in which existing services can be incrementally improved. In this sub-section, possible reform strategies, corroborated through stakeholder engagement (74), are discussed. It should be noted that there has, however, been limited research on informal paratransit reform strategies, largely because there is little data, and attitudes towards informal paratransit have been less than favourable, resulting in most efforts investing how to replace these services entirely. The following reform strategies are not intended to be prescriptive, but rather indications of possible reform measures, from which inferences can be drawn. 10.3.1 Regulatory environment reform While informal paratransit operations frequently operate outside of formal regulations, resulting in continual conflict between informal paratransit operators and law enforcement, a reformed regulatory environment is necessary to help overcome this challenge. It is important that the needs of operators are considered more carefully to ensure an environment that is conducive to their services, and thereby making compliance less of 91 AFRICA URBAN MOBILITY OBSERVATORY – ROLE OF INFORMAL PARATRANSIT REPORT a burden. A well-designed regulatory environment has the potential to improve safety standards and driver behaviour, as well as to match supply with demand, thereby improving levels of service and profitability. 10.3.2 Infrastructure improvements Better infrastructure and facilities are essential for optimisation of informal paratransit operations and improvement of safety. This includes roads and pathways for motorised and NMT traffic and dedicated public and informal paratransit lanes as well as queue jump lanes at intersections to help prioritise mass transit services over private vehicular traffic. Initiatives like these would aid in reducing the impact of traffic congestion on mass transit services by reducing journey duration and allowing increased frequency. Upgrading of public and informal paratransit ranks, terminals and stops ensures a better experience for users, improve safety, as well as optimises flow of traffic. In addition, to support the transition towards e-mobility, in the context of fragmented privately owned and operated informal paratransit services, public investment in charging infrastructure and equipment is required. 10.3.3 Capital subsidies In the context of limited funding, subsidisation of informal paratransit services is usually not viable. However, where there are adequate resources available, capital subsidies towards fleet renewal can have a major positive impact on the safety and levels of service offered by informal paratransit operators. Such a programme could also be leveraged to encourage business model reforms, and introduction of monitoring systems (such as vehicle tracking devices) to foster road regulation adherence. 10.3.4 Business model reform The ideal business model, which would support the optimisation of informal paratransit services, would allow operators to work towards providing an integrated service based on a centralised operational plan. Since informal paratransit operations are highly fragmented, this is unfortunately a major challenge. The primary changes required to achieve this include: • Forming a centralised company in which existing operators become shareholders, and drivers become salaried employees; • The centralised company develops operational and maintenance plans to which drivers adhere, thereby shifting away from vehicle level target models; and • Revenue is pooled, through the support of an electronic fare collection system thereby ensuring that success is not linked to the performance of individual vehicles in isolation, but rather the collective success of the fleet. It should be noted that such reforms are incredibly ambitious and are not realistic in the short to medium term – this should be considered a long-term goal to incrementally work towards. 10.3.5 Urban transport technology reform In the absence of data, it is difficult to identify opportunities for optimisation. Route mapping and live vehicle tracking are cost-effective ways to generate data and can be used to monitor vehicle driver behaviour (speed, acceleration), as well as monitor vehicle emissions, to ensure compliance with operational requirements and regulations. In addition, integrated cashless automatic fare collection systems can enable more seamless transfers between vehicles and modes, while enhancing revenue visibility. Telemetry and AFC systems typically cost between GBP 10 and GBP 30 per vehicle per month (depending on features and services chosen). 10.3.6 Vehicle emissions reduction To reduce vehicle emissions, national and local authorities can consider the following interventions: • Support route and operation optimisation through licence controls; • Collect live vehicle tracking data to identify opportunities for network optimisation; • Ensure availability of cleaner fuels (maximum sulphur content 50 parts per million); 92 AFRICA URBAN MOBILITY OBSERVATORY – ROLE OF INFORMAL PARATRANSIT REPORT • Encourage a transition to electric vehicles through incentive schemes (reduced tax on EVs, reduced electricity tariffs for EVs during off-peak periods, vehicle recapitalisation programmes) and investment in charging infrastructure and local automotive industry; • Place restrictions on the maximum age of used imported vehicles; • Enforce emissions compliance standards applicable to new and imported used vehicles; • Introduce emissions testing criteria for vehicle licence renewal; • Improve the road network and conditions through regular preventative maintenance; • Improve road traffic management by (traffic signal coordination to reduce delays). 10.4 Informal paratransit reform case study cities In this sub-section, focus is shifted to two research cities, Kigali and Lagos, in which informal paratransit and regulatory environment reform strategies have been attempted and to a large degree, have been successful. It is important to note that these reform strategies are not without their flaws and must be carefully scrutinised before any consideration is made to transplant these approaches to other cities where contextual conditions vary considerably. 10.4.1 Kigali Business model reform Between 2006 and 2013, the RURA embarked on a process of formalising paratransit bus operations in Kigali. Four five-year contracts were awarded to three bus companies, replacing previous paratransit operations. The city was divided into four public transport zones. These companies receive no state operating subsidy, but they are protected from competition, since RURA only permits a single operator per zone. RURA encourages increased use of high occupancy vehicles and sets levels of service targets. Other improvements made by RURA and CoK include public transport infrastructure upgrades (bus terminals, NMT facilities, and roads); increased public transport supply; cashless fare collection system on all buses; free Wi-Fi internet on all buses; public transport vehicles speed management; and regulation of motorcycle taxis. Urban transport technology reform Through a combination of private sector innovation and regulatory environment reform, several technological advances have been achieved in Kigali. All buses are legally required to be equipped with a centralised AFC system, which includes live vehicle location tracking and speed monitoring. The data generated is monitored by RURA, allowing optimisation of service, and enables greater visibility of compliance with levels of service targets and regulations. Bus fares are distance-based and managed using a smartcard system developed by AC Group, called Tap and Go. Tap and Go travel credits can be loaded via a smartphone app, a USSD-based mobile-money service, or with cash, at kiosks located across the city. Many buses are also equipped with LTEbased Wi-Fi internet for passengers to use free of charge (75). Motorcycle taxis are also increasingly embracing new technologies, with several motorcycle taxi e-hailing services emerging in Kigali, and which are expanding into neighbouring countries. CanGo (formerly SafeMotos), is one such platform, and aims to increase transport safety by monitoring driver behaviour, and ensuring a minimum threshold is met in order to remain on the platform (76). Other e-hailing platforms include SafiRide, Pascal-Moto, and YegoMoto (77) (78). Vehicle emissions reduction President Paul Kagame’s announced desire in 2019 to replace all internal combustion engine motorcycle taxis with electric motorcycles has encourage rapid uptake of electric motorcycles in Kigali (33). Ampersand, the Rwandan electric motorcycle taxi manufacturer, with its own battery charging and swap network in Kigali (34), is supplying to several motorcycle operators, including YegoMoto (35) and SafriRide (36). 93 AFRICA URBAN MOBILITY OBSERVATORY – ROLE OF INFORMAL PARATRANSIT REPORT 10.4.2 Lagos Regulatory environment and business model reform Major regulatory environment reforms were initiated in 1999 by the Governor Asiwaju Bola Ahmed Tinubu. Reform initiatives included the creation of new agencies such as the LASTMA in 2000 and the LAMATA in 2002. LAMATA’s mandate is to reverse the decades of neglect of Lagos’ transport network, and to coordinate the activities of multiple agencies responsible for making and implementing transport policy. LAMATA is a corporate body, with an independent board, responsible for formulating, coordinating, and implementing urban transport policies and programs in the metropolitan area. Figure 113 provides a visual summary of the overall reform strategy. Figure 113: Lagos informal paratransit reform strategy (60) The aims of the reform strategy of 2019 were as follows: • Busses: To replace all minibus taxis with a fleet of 5,000 high occupancy busses and midi-busses, with improved safety, reliability, and comfort; • Infrastructure: To construct world-class infrastructure to support the transport system, including BRT corridors, road and junction improvement works, 954 bus shelters and lay-bys, 13 new terminals, and seven depots; • Operations: To introduce 60 routes, operated by qualified bus operating companies, whose performance would be monitored against set indicators for service delivery; • Digitisation: To increase digitisation of the network, including the collection and dissemination of realtime service information, smart ticketing and ITS-based route allocation; • Staff Training: To better support and train drivers and bus attendees, including mandatory practical courses to ensure staff are adequately certified to operate the bus services. In 2008, Lagos was the first city in Africa to launch a BRT service (63). Two operators run the service: a private sector entity called PRIMERO Transport Services, and a Lagos State government owned entity, LBSL. The network comprises over 500 buses, operating 40 routes. Fares are around 30% to 50% less than the minibus taxi services it replaced, with journeys costing from as little as GBP 0.35. This project is estimated to have reduced travel time by one third, which is equivalent to benefits in time saved of approximately USD$240M (60). In 2021, the Lagos State Governor launched 500 seven-seater microbuses, providing an on-demand feeder service to the BRT network (63). These micro-buses are intended to eventually replace tricycle taxis and motorcycle taxis. 94 AFRICA URBAN MOBILITY OBSERVATORY – ROLE OF INFORMAL PARATRANSIT REPORT Urban transport technology reform The BRT service supports electronic payment via an NFC travel card (The Cowry Travel Card), which applies a distance and zone-based fare using location-tracking technologies (63). Likewise, the seven-seater feeder service micro-buses have the same AFC system integrated, which allows not only easier transfer between the modes, but collection of more complete travel pattern data (63). 10.5 Informal paratransit reform opportunities In this sub-section, the status quo, challenges, and opportunities associated with the informal paratransit operations in each of the six cities are presented. 10.5.1 Blantyre Regulatory environment reform The MoTPW is responsible for transport planning in Blantyre, while Blantyre City Council is responsible for managing basic urban services, which includes roads provision and maintenance. Blantyre City Council is supported by the Ministry of Lands and Housing, Ministry of Works, Roads Authority, Malawi Police Service, and the Ministry of Local Government and Rural Development. It is thus proposed that the establishment of a metropolitan area transport authority, mandated to plan, coordinate, and manage all urban transport matters, would support the provision of a coordinated regulatory and planning environment (including the introduction of an informal paratransit licencing regime) capable of balancing supply and demand, and thereby improving levels of service and profit margins for, especially, the various paratransit operators. Infrastructure improvements Over two thirds of Blantyre’s road network is untarred, and in poor condition, resulting in higher capacity informal paratransit services avoiding many poorer communities altogether. To address this, it is proposed that a tarred road network expansion plan in conjunction with an informal paratransit road network development and maintenance plan be advocated to enable the various paratransit services to access these areas more easily and efficiently. The existing roads (gravel and tar) which are in poor condition, but which are to be included in an informal paratransit route network, should be prioritised for maintenance and/or upgrade. In addition, plans should be developed for a publicly funded EV charging network to support the future transition of informal paratransit vehicles towards e-mobility. Capital subsidies None of the informal paratransit services receive any form of subsidy. While funding to support any form of subsidy is very limited, it is proposed that should funds become available, focus be placed on a minibus taxi recapitalisation programme, in conjunction with a new centrally managed licenced informal paratransit route network. This would ensure that minibus taxis, which are more efficient than sedan taxis in terms of energy consumption and road space, are more affordable to operators. Business model reform In the absence of a metropolitan area transport authority to coordinate and support informal paratransit operators to reform their business models, it is proposed that this be considered as a longer-term opportunity in future. Urban transport technology reform Currently, none of the informal paratransit services make use of transport technologies, such as vehicle telemetry or AFC (Automatic Fare Collection). To enable the development of a minibus taxi route network, it is thus proposed that all informal paratransit vehicles be equipped with telemetry systems (as a prerequisite to receive an operating license). This will enable MoTPW to continually optimise and balance informal paratransit services through a data driven licensing regime, as well as monitoring of driver behaviour and emissions. In addition, operators will have a better understanding of their operational costs, which will allow them to focus on delivering an efficient and effective service. Training and capacity building would be required to administer such a system effectively. 95 AFRICA URBAN MOBILITY OBSERVATORY – ROLE OF INFORMAL PARATRANSIT REPORT Vehicle emissions reduction Most paratransit operators choose used imported vehicles due to their affordability. Since there are no restrictions on the age of used import vehicles in Malawi, the average age of used petrol and diesel vehicles imported is nine and 18 years, respectively (3). There are also currently no vehicle emissions standards. In order to reduce informal paratransit vehicle emissions, as is typical in other cities, a maximum age limit of between three and five years for used imported vehicles should be introduced (this will result in an increase in the cost of purchasing an informal paratransit vehicle – this should be investigated thoroughly before implementing any such reforms). In addition, since the fuel available is already able to support Euro 4 emissions standards, Euro 4 emissions compliance should be the minimum permitted for all new and used imported vehicles. To support the transition to e-mobility, it is also proposed that the MoTPW investigate the possibility of conducting a pilot with an electric minibus and/or electric sedan to understand how EV technology impacts on operations, as well as to calibrate total cost of ownership models. 10.5.2 Gaborone Regulatory environment reform The MT&C, with the support of the DRTS, and the Botswana Police Service Traffic Department, is responsible for transport-related matters in the city. DRTS is responsible for issuing and monitoring public transport permits, as well as managing vehicle registration and licensing, vehicle roadworthy examinations, driver training, examination and licensing, transport permits, registration and inspection of driving schools, and control of public passenger and freight transport vehicles (29). Law enforcement, including public transport inspection, is supported by the Botswana Police Traffic Department. It is thus proposed that the establishment of a metropolitan area transport authority, mandated to plan, coordinate, and manage all urban transport matters, would support the provision of a coordinated regulatory and planning environment (including the introduction of an informal paratransit licencing regime) capable of balancing supply and demand, and thereby improving levels of service and profit margins for, especially, the paratransit operators. Infrastructure improvements Approximately 90% of roads used by informal paratransit vehicles in Gaborone are tarred, with the balance being mostly gravel roads that are typically not adequately maintained (28). In addition, infrastructure is under-developed in many parts of the city causing operators to avoid many areas, particularly those with low population densities. To address this, it is proposed that an informal paratransit route network expansion plan in conjunction with a road network infrastructure maintenance plan be advocated. The existing roads (gravel and tar) which are in poor condition, but which are to be included in an informal paratransit route network, should be prioritised for maintenance and/or upgrade. In addition, plans should be developed for a publicly funded EV charging network to support the future transition of informal paratransit vehicles towards emobility. Capital subsidies None of the informal paratransit services receive any form of subsidy. It is proposed that emphasis be placed on introducing a minibus taxi recapitalisation programme (since they supply more than 90% of public transport trips within the CBD (79)), in conjunction with a new centrally managed licenced informal paratransit route network. This would ensure that minibus taxis, which are more efficient than sedan taxis in terms of energy consumption and road space, are more affordable to operators. Business model reform In the absence of a metropolitan area transport authority to coordinate and support informal paratransit operators to reform their business models, it is proposed that this be considered as a longer-term opportunity in future. Urban transport technology reform 96 AFRICA URBAN MOBILITY OBSERVATORY – ROLE OF INFORMAL PARATRANSIT REPORT Currently, none of the informal paratransit services make use of transport technologies, such as vehicle telemetry or AFC (Automatic Fare Collection). To enable the development of a minibus taxi route network, it is thus proposed that all informal paratransit vehicles be equipped with telemetry systems (as a prerequisite to receive an operating license). This will enable DRTS to continually optimise and balance informal paratransit services through a data driven licensing regime, as well as monitoring of driver behaviour and emissions. In addition, operators will have a better understanding of their operational costs, which will allow them to focus on delivering an efficient and effective service. Training and capacity building would be required to administer such a system effectively. Vehicle emissions reduction Most paratransit operators choose used imported vehicles due to their affordability. There are no restrictions on the age of used import vehicles in Botswana, and the average age of these vehicles is unknown (it is recommended that this be established through engagement with a licencing officer at a Gaborone Department of Road Transport and Safety Office). There are also currently no vehicle emissions standards. In order to reduce informal paratransit vehicle emissions, as is typical in other cities, a maximum age limit of between three and five years for used imported vehicles should be introduced (this will result in an increase in the cost of purchasing an informal paratransit vehicle – this should be investigated thoroughly before implementing any such reforms). In addition, since the fuel available is already able to support Euro 4 emissions standards, EURO 4 emissions compliance should be the minimum permitted for all new and used imported vehicles. Giyani Metals currently supplies manganese to electric vehicle battery manufacturers (22) and Baylee Enterprises plans to manufacture an electric vehicle in Botswana from August 2021 (23). To support the transition to e-mobility, it is also proposed that MT&C (with the help of the DRTS) promote initiatives like these by, for example, advocating a pilot programme with an electric minibus and/or electric sedan to understand how EV technology impacts on operations, as well as to calibrate total cost of ownership models. 10.5.3 Kigali Regulatory environment reform Although MININFRA, RTDA, CoK, RURA and REMA seem to work effectively together, it may still be advantageous to introduce a single metropolitan area transport authority, mandated to plan, coordinate, and manage all urban transport matters. The aim would be for this authority to support the provision of a coordinated regulatory and planning environment among the formalised bus and paratransit operators which caters for all services through balancing demand and supply, and considering their accessibility, levels of service and profit margins. Infrastructure improvements More than 80% of Kigali’s roads are not tarred and become water-logged during the wet season and dusty during the dry season. This causes discomfort to passengers, damage to vehicles, and increased travel time (39). To address this, it is proposed that a tarred road network expansion in conjunction with an informal paratransit road network development and maintenance plan be advocated, to enable bicycle and motorcycle taxi services to access these areas more effortlessly. The existing roads (gravel and tar) which are in poor condition, but which are to be included in an informal paratransit route network, should be prioritised for maintenance and/or upgrade. In addition, plans should be developed for a publicly funded EV charging network to support the future transition of formalised bus services towards e-mobility. Capital subsidies Motorcycle taxis do not receive any form of subsidy. However, since President Paul Kagame’s is advocating that all internal combustion engine motorcycle taxis be replaced with electric motorcycles, it is recommended that a motorcycle recapitalisation programme be considered. In the absence of any form of capital or operating subsidy for the formal bus services, their operators will likely struggle to renew their fleet once they reach the end of their service life. It is therefore recommended that either a subsidy or bus recapitalisation programme be considered to ensure the fleet remains safe and reliable. Urban transport technology reform 97 AFRICA URBAN MOBILITY OBSERVATORY – ROLE OF INFORMAL PARATRANSIT REPORT While Kigali has achieved several technological advances including, among others, AFC, live vehicle location tracking, and speed monitoring on formalised buses and licenced motorcycle taxis, the data being generated is not being leveraged to aid with the optimisation of these services. Therefore, it is recommended that RURA invest in capacity to take advantage of this rich data source. In addition, it is proposed that the data collected be extended to vehicle emissions monitoring. Vehicle emissions reduction There are currently no vehicle emissions standards, nor any restrictions on the age of used vehicle imports. To reduce passenger transport vehicle emissions, a maximum age limit of between three and five years for used imported vehicles should be introduced (this will result in an increase in the cost of purchasing an informal paratransit vehicle – this should be investigated thoroughly before implementing any such reforms). In addition, since fuel currently supplied is able to support Euro 4 emissions standards, Euro 4 emissions compliance should be the minimum permitted for all new and used imported vehicles. To further advocate emobility, it is also proposed that MININFRA, through the e-mobility strategy approved in April 2021, actively remind motorcycle taxi operators of the incentives of this strategy and the benefits they could reap from transitioning to electric motorcycles. 10.5.4 Kinshasa Regulatory environment reform Kinshasa has no independent transport authority, with multiple government agencies being responsible for various aspect of transport related governance and enforcement (48). It is thus proposed that the establishment of a metropolitan area transport authority, mandated to plan, coordinate, and manage all urban transport matters, would support the provision of a coordinated regulatory and planning environment (including the introduction of an informal paratransit licencing regime) capable of balancing supply and demand, and thereby improving levels of service and profit margins for, especially, the various paratransit operators. Infrastructure improvements Informal paratransit services travel on Kinshasa’s under-developed road network, of which just 10% is tarred, and in poor condition (51). To address this, it is proposed that a tarred road network expansion plan in conjunction with an informal paratransit road network development and maintenance plan be developed. The existing roads (gravel and tar) which are in poor condition and known to become flooded, but which are to be included in an informal paratransit route network, should be prioritised for maintenance and/or upgrade. In addition, plans should be developed for a publicly funded EV charging network to support the future transition of informal paratransit vehicles towards e-mobility. Capital subsidies None of the informal paratransit services receive any form of subsidy. While funding to support any form of subsidy is very limited, it is proposed that should funds become available, focus be placed on a minibus taxi recapitalisation programme. This is supported by the fact that more than a third of motorised journeys are made by this (notoriously unsafe) paratransit mode (51), known as Esprit de Mort/ Spirit of Death which are mostly well over 15 years old. In addition, due to rising popularity of motorcycle taxis, accounting for more than a fifth of motorised journeys (51), a subsequent focus could be to support motorcycle taxi operators convert their fleets to electric motorcycles. Business model reform In the absence of a metropolitan area transport authority to coordinate and support informal paratransit operators to reform their business models, it is proposed that this be considered as a longer-term opportunity in future. 98 AFRICA URBAN MOBILITY OBSERVATORY – ROLE OF INFORMAL PARATRANSIT REPORT Urban transport technology reform Currently, none of the informal paratransit services make use of transport technologies, such as vehicle telemetry or AFC (Automatic Fare Collection). To enable the development of a minibus taxi route network, it is thus proposed that all informal paratransit vehicles be equipped with telemetry systems (as a prerequisite to receive an operating license). This will enable the continued optimisation and balancing of service offering once a route network is introduced, as well as monitoring of driver behaviour and emissions. In addition, with the realisation of such a formalised monitoring system, operators will have a better understanding of their operational costs, which will allow them to focus on delivering an efficient and effective service. Vehicle emissions reduction Most informal paratransit operators choose used imported vehicles due to their affordability. DRC imposes a maximum age limit on used vehicle imports of nine years (2). There are currently no vehicle emissions standards. To reduce informal paratransit vehicle emissions, as is typical in other cities, a lower maximum age limit of between three and five years for used imported vehicles should be considered (this will result in an increase in the cost of purchasing an informal paratransit vehicle – this should be investigated thoroughly before implementing any such reforms). In addition, since the current fuel only supports a Euro 2 emissions standards, emissions compliance should be, at minimum, Euro 2. However, legislations for a more preferred compliance level (such as Euro 4) should be advocated for all new and used imported vehicles. Lastly, given the fact that much of the world’s cobalt supply, a critical element in electric vehicle batteries, is mined in the DRC (46), the Ministry of Transport through the Ministry of Public Works and Infrastructure should put forth initiatives to encourage their uptake and to support the transition to e-mobility. 10.5.5 Lagos Infrastructure improvements Informal paratransit services make use of Lagos’ extensive road network and highways (80). Approximately 50% of the city’s urban roads are tarred (63), although the infrastructure is aged and poorly maintained (81). Fortunately, however, there is a major roadway improvement programme currently underway (63). It is proposed that, in addition to the roadway improvement programme, an informal paratransit route network expansion and infrastructure development and maintenance plan be developed. The existing roads (gravel and tar) which are in poor condition, but which are to be included in an informal paratransit route network, should be prioritised for maintenance and/or upgrade. In addition, plans should be developed for a publicly funded EV charging network to support the future transition of both formal public transport services and informal paratransit vehicles towards e-mobility. Capital subsidies None of the informal paratransit services receive any form of subsidy. Should funds be available, focus be placed on a minibus taxi recapitalisation programme, in conjunction with a new centrally managed licenced informal paratransit route network. This is supported by the fact that more than a half of motorised journeys are made by minibus taxis (63), which are mostly over 15 years old and in poor condition. Business model reform With the creation LASTMA in 2000 and LAMATA in 2002, Lagos has made significant strides in reforming its public transport environment. Lagos is not only the only city from the six cities evaluated that has a BRT system but, in 2021, through their BRI, they have also introduced microbuses to replace the less safe paratransit modes. From the aforementioned, it is evident that strong political will exists to deliver a safe and convenient public transport service. Regardless, this political will could be further extended to better integrating minibus taxi services with the newly introduced modes, by developing a transport masterplan which incorporates minibus taxi routes. Urban transport technology reform Lagos has achieved several technological advances including, among others, electronic payment (via The Cowry Travel Card) which applies a distance and zone-based fare using location-tracking technologies on the BRT buses. Likewise, the seven-seater feeder service micro-buses have the same AFC system integrated. It is 99 AFRICA URBAN MOBILITY OBSERVATORY – ROLE OF INFORMAL PARATRANSIT REPORT proposed that this technology be leveraged further to monitor driver behaviour (speed and acceleration), as well as emissions. To improve levels of service, it is proposed that these technologies also be introduced on informal paratransit operations as a prerequisite for license renewal. This would enable monitoring of driver behaviour, emissions, and support network optimisation. Vehicle emissions reduction Most paratransit operators choose used imported vehicles due to their affordability. Nigeria imposes a maximum age limit on used vehicle imports of nine years (2). There are also currently no vehicle emissions standards. To reduce informal paratransit vehicle emissions, a lower maximum age limit of between three and five years for used imported vehicles should be considered (this will result in an increase in the cost of purchasing an informal paratransit vehicle – this should be investigated thoroughly before implementing any such reforms). In addition, since the current fuel only supports a Euro 2 emissions standards, emissions compliance should be, at minimum, Euro 2. However, legislations for a more preferred compliance level (such as Euro 4) should be advocated for all new and used imported vehicles. Lastly, since the reformed fossil fuel subsidy regime yielded an annual saving to the government of approximately US$ 2 billion (82), the Ministry of Transport through LAMATA should continue to put forth initiatives (like the national automotive industry development plan) to encourage the transition to e-mobility. It is recommended that pilot studies be conducted with electric buses and microbuses, to collect data and understand the impact of EV technology on operations, in preparation for a future transition to a fully electric public transport environment. 10.5.6 Maseru Regulatory environment reform There are several entities responsible for transport related matters, including MoPW&T, The Department of Traffic and Transport, and the MCC (70). It is proposed that the establishment of a metropolitan area transport authority, mandated to plan, coordinate, and manage all urban transport matters, would support the provision of a coordinated regulatory and planning environment (including the introduction of an informal paratransit licencing regime) capable of balancing supply and demand, and thereby improving levels of service and profit margins for, especially, the various paratransit operators. Infrastructure improvements Maseru’s roads are mostly in poor condition, with just a few being tarred (70). This has a significant impact on operating costs since high rates of wear and tear are experienced. In addition, some outlying areas are not served by informal paratransit, leaving many communities without access to motorised transport. To address this, it is proposed that a tarred road network expansion plan be developed in conjunction with an informal paratransit route network, to enable paratransit services to access these areas more easily and efficiently. The existing roads (gravel and tar) which are in poor condition, but which are to be included in an informal paratransit route network, should be prioritised for maintenance and/or upgrade. In addition, plans should be developed for a publicly funded EV charging network to support the future transition of informal paratransit vehicles towards e-mobility. Capital subsidies None of the informal paratransit services receive any form of subsidy. While funding to support any form of subsidy is limited, it is proposed that should funds become available, focus should be placed on a minibus taxi recapitalisation programme, in conjunction with a new centrally managed licenced informal paratransit route network. With the dramatic increase in sedan taxis observed in a 2021 on-the-ground evaluation, this recommendation could help to alleviate their market presence as minibus taxis are more efficient in terms of energy consumption and road space. Business model reform In the absence of a metropolitan area transport authority to coordinate and support informal paratransit operators to reform their business models, it is proposed that this be considered as a longer-term opportunity in future. Urban transport technology reform 100 AFRICA URBAN MOBILITY OBSERVATORY – ROLE OF INFORMAL PARATRANSIT REPORT Currently, none of the informal paratransit services make use of transport technologies, such as vehicle telemetry or AFC (Automatic Fare Collection). To enable the development of a minibus taxi route network, it is thus proposed that all informal paratransit vehicles be equipped with telemetry systems (as a prerequisite to receive an operating license). This will enable MoPW&T to continually optimise and balance informal paratransit services through a data driven licensing regime, as well as monitoring of driver behaviour and emissions. In addition, operators will have a better understanding of their operational costs, which will allow them to focus on delivering an efficient and effective service. Training and capacity building would be required to administer such a system effectively. Vehicle emissions reduction Most paratransit operators choose used imported vehicles due to their affordability. Lesotho imposes a maximum age limit on used vehicle imports of five years (2). There are currently no vehicle emissions standards. In addition, since the fuel available is already able to support Euro 4 emissions standards, Euro 4 emissions compliance should be the minimum permitted for all new and used imported vehicles. To support the transition to e-mobility, it is also proposed that MoPW&T revisits the Lesotho draft Renewable Energy Policy of 2013 and that they investigate the possibility of conducting a pilot with an electric minibus to understand how EV technology impacts on operations, as well as to calibrate total cost of ownership models. 101 AFRICA URBAN MOBILITY OBSERVATORY – ROLE OF INFORMAL PARATRANSIT REPORT 11. Conclusion The primary objectives of this report were to identify and elaborate on the various informal paratransit services operating in the six research cities (Blantyre, Gaborone, Kigali, Kinshasa, Lagos, and Maseru), to understand their operating models, to establish the roles these services play in supporting mobility, and to identify how to optimise these services to reduce vehicle emissions and improve levels of service. The contextual conditions in which these services operate, and the regulatory environments were also reviewed. Through this evaluation, it was intended that the successes and challenges associated with the informal paratransit services operating in the six cities would be identified, to allow cross-pollination of ideas, and thereby illuminate potential opportunities for informal paratransit reform. In Section 2, informal paratransit was contextualised in terms of typical services operating in sub-Saharan Africa. In addition, an overview of transport-related emissions, in the global and African contexts was presented. In Section 3, the methodology applied in gathering and evaluating the information during the compilation of this report was presented. The first phase of analysis comprised desktop research, followed by a gap analysis. These gaps were closed through a process of stakeholder engagement. Finally, AUMO surveys data results (collected in August 2021, as published on the Web Data Platform), were evaluated, to understand respondents’ experiences of using informal paratransit in their respective cities. Section 4 to Section 1 each presented the findings of the application of this methodology on the six research cities. Finally, Section 10 discussed the strengths and weaknesses associated with informal paratransit operations, followed by a summary of possible informal paratransit reform strategies to be considered to improve levels of service and safety, reduce CO2 emissions, and improve operators’ profit margins. Examples of informal paratransit and regulatory environment reform initiatives in Kigali and Lagos were then discussed, before concluding the section with a summary of possible opportunities for reform in each city. It should be noted that many of the proposed reforms would undoubtedly be challenging to implement, and should not be understood to be prescriptive, as they have been developed with only the limited information available. While the operating models and levels of service of informal paratransit operations varied from city to city, it was clear that despite their numerous challenges, they perform a critical role in that they support the majority of daily trips in most of the evaluated cities. Generally, informal paratransit users are captive, rather than choice users, and are among some of the most vulnerable population groups in the region. In addition, operators of informal paratransit services work on incredibly slim profit margins, and levels of competition are often so high that many operations unfortunately fail after just a few years in service. High levels of inefficiency also result in higher levels of CO2 than the levels of service can justify. The fragmented nature of informal paratransit services, a lack of funding for subsidies, uncoordinated service management and delivery, and fragmented, weak regulatory and enforcement environments are all examples of contributing factors. With regard to the general condition and age of the informal paratransit vehicles across the cities, there is evidently an urgent need for reform, to help protect the safety of travellers, and to improve levels of service, and to reduce harmful emissions. Additional aspects of informal paratransit ecosystems requiring attention include road and NMT infrastructure. It should not be assumed that the solution to these challenges is to replace informal paratransit services with formal public transport services. While this may be feasible in some cities, it is highly questionable whether this would indeed be a sustainable approach, and the lack of funding to subsidise such services makes this almost impossible in most of the cities evaluated. Informal paratransit services have inherent resilience which should be recognised as a foundation upon which to build, rather than destroy. Increased support for the sector, through more active involvement from regulatory authorities, to help balance supply and demand, and thus protect the operators’ profit margins, would allow recapitalisation of fleets, and ensure more reliable levels of service. While Kigali and Lagos offer examples of how informal paratransit reform programmes could be executed, it remains to be seen whether these relatively bold approaches are sustainable in the longer term. It is also questionable to what degree these approaches can be transplanted into the very different contexts found in the other cities evaluated. In conclusion, the importance of informal paratransit services in sub-Saharan Africa should not be underestimated. While they lack formality, with levels of service often being far from ideal, and high levels of 102 AFRICA URBAN MOBILITY OBSERVATORY – ROLE OF INFORMAL PARATRANSIT REPORT harmful emissions, they provide an essential service, and provide an important foundation upon which to build more resilient, seamless and cleaner transport systems moving forward. 103 AFRICA URBAN MOBILITY OBSERVATORY – ROLE OF INFORMAL PARATRANSIT REPORT 12. References 1. World Bank. CO2 emissions from liqued fuel consumption. [Online].; 2018 [cited 2021 September 14. Available from: https://data.worldbank.org/indicator/EN.ATM.CO2E.LF.ZS. 2. G.K. Ayetor IMJAAS. Investigating the state of road vehicle emissions in Africa: A case study of Ghana and Rwanda. Transportation Research Interdisciplinary Perspectives. 2021 June; 11. 3. UNEP. Malawi proposes Euro 4-equivalent vehicle emission standards. [Online].; 2019 [cited 2021 September 15. Available from: https://www.unep.org/events/workshop/malawi-proposes-euro-4- equivalent-vehicle-emission-standards. 4. BERA (Botswana Energy Regualtion Authority). [Media Release - Phasinf Out of Diesel 500 ppm].; 2020 [cited 2021 September 16. Available from: http://www.bera.co.bw/downloads/Petroleum/Media%20Release%20- %20PHASING%20OUT%20OF%20DIESEL%20500%20PPM%20v1.pdf. 5. MicroMek. MicroMek - About Us. [Online].; 2018 [cited 2021 October 20. Available from: https://micromek.net/. 6. Institute of Developing Economies Japan External Trade Organization. Electricity Supply Commission Of Malawi (ESCOM). [Online].; 2008 [cited 2021 October 20. Available from: https://www.ide.go.jp/English/Data/Africa_file/Company/malawi05.html. 7. World Bank Group. Malawi National Transport Master Plan. Final Report. ; 2016. 8. Cross Boarder Road Transport Agency. Malawi Country Profile. ; 2016. 9. UN-Habitat (United Nations Human Settlements Programme). Malawi: Blantyre urban profile. , Regional and Technical Cooperation Division; 2011. 10. Council BC. About Us. [Online]. [cited 2021 August 30. Available from: https://bccmw.com/about-us/. 11. Government of Malawi. National Climate Change Policy. Final. Ministry of Natural Resources, Energy and Mining, Environmental Affairs Departmen; 2016. 12. Government of Malawi. National Environmental Policy. Minstry of Natural Resources and Environmental Affairs, Environmental Affairs Department; 2004. 13. Makanje GD. The Environmental Management Act (2017) and natural resource regulation in Malawi: opportunities for and limitations to effective enforcement. The Association of Environmental Law Lecturers from African Universities in cooperation with the Climate Policy and Energy Security Programme for Sub-Saharan Africa of the Konrad-Adenauer-Stiftung and UN Environment. 2018; 38(Chapter 8). 14. Ministry of Natural Resources, Energy and Mining Environmental Affairs Department - Malawi. Malawi’s National Adaptation Plan Framework. Lilongwe: Government of Malawi, Ministry of Natural Resources, Energy and Mining Environmental Affairs Department - Malawi; 2020. 15. Chabwera T. An assessment of the safety of vulnerable road users in Malawi - Case Study Blantyre city roads. Final Year Project. University of Malawi, Department of Civil Engineering; 2017. 104 AFRICA URBAN MOBILITY OBSERVATORY – ROLE OF INFORMAL PARATRANSIT REPORT 16. Mzengereza IT, Mndelemani C. HVT Africa Urban Mobility Observatory - Informal Paratransit Stakeholder Engagement (Blantyre). 1 Septemeber 2021.. 17. Sangala T. The Times - Minibus owners to comply with carrying-capacity law. [Online].; 2021 [cited 2021 October 21. Available from: https://times.mw/minibus-owners-to-comply-with-carrying-capacity-law/. 18. Kumbani. The Nation - Minibus operators raise fares. [Online].; 2018 [cited 2021 October 21. Available from: https://www.mwnation.com/minibus-operators-raise-fares/. 19. High Volume Transport. Empower: Safer Transport for Women in Sub-Saharan Africa. [Online].; 2021 [cited 2021 October 25. Available from: http://transport-links.com.w01c1b50.kasserver.com.w01c1b50.kasserver.com/research-project/empower-vectos/. 20. Republic of Botswana. Botswana's First Biennial Update Report (BUR) to the UN Framework Convention on Climate Change. Final. , Ministry of Environment, Natural Resources Conservation and Tourism Of theRepublic of Botswana; 2019. 21. United Nations Development Programme. UNDP Procurement Notices. [Online].; 2021 [cited 2021 October 20. Available from: https://procurement-notices.undp.org/view_file.cfm?doc_id=247612. 22. Bungane B. Botswana, producer of metals required for EV batteries. [Online].; 2019 [cited 2021 September 17. Available from: https://www.esi-africa.com/industry-sectors/future-energy/botswanaproducer-of-metals-required-for-ev-batteries/. 23. Chida D. Electric Car To Be Assembled In Mogoditshane- Molebatsi. [Online].; 2021 [cited 2021 September 23. Available from: https://news.thevoicebw.com/2021/03/electric-car-to-be-assembled-inmogoditshane-molebatsi/. 24. CGTN Africa. Botswana to produce electric car in August 2021. [Online].; 2021 [cited 2021 October 20. Available from: https://africa.cgtn.com/2021/03/31/botswana-to-produce-electric-car-in-august-2021/. 25. Esau I. Upstream Online - Botswana in renewables drive, but coalbed methane and coal still in the mix. [Online].; 2020 [cited 2021 October 20. Available from: https://www.upstreamonline.com/energytransition/botswana-in-renewables-drive-but-coalbed-methane-and-coal-still-in-the-mix/2-1-933944. 26. Modupe O. Akinola MLEOD. Air quality management in Botswana. Academy of Science of South Africa (ASSAf): Open Journal Systems. 2017 March; 27(1). 27. Ministry of Environment, Natural Resources Conservation and Tourism of Botswana. National Adaptation Plan Framework for Botswana. Gaborone: Government of Botswana, Department of Meteorological Services of Botswana; 2020. 28. Tlhogo , Saudu G, Baele MS. HVT Africa Urban Mobility Observatory - Informal Paratransit Stakeholder Engagement (Gaborone). 2021 August 13.. 29. Flx Mobility (UK) Ltd. World Bank Regional Program for Digital Innovation to Support Public Transport. 2021. Research Project. 30. BOCONGO. Welcome to BOCONGO. [Online].; 2021 [cited 2021 October 25. Available from: https://bocongo.org/#About%20Us. 105 AFRICA URBAN MOBILITY OBSERVATORY – ROLE OF INFORMAL PARATRANSIT REPORT 31. UNEP (United Nations Environment Programme). Kigali City Air Quality Policy and Regulatory Situational Analysis. Final. ; 2018. 32. Ministry of Infrastructure Rwanda. E-Mobility Stakeholder Outreach: Ministry of Infrastructure of Rwanda. 2021 April 19. Interview. 33. International Growth Centre. A Road Map for e-Mobility Transition in Rwanda. Kigali:; 2020. 34. Whale J. IFC E-Mobility Stakeholder Outreach: Ampersand. 13 April 2021.. 35. Kumar M. IFC E-Mobility Stakeholder Outreach: YegoMoto. 16 April 2021.. 36. Adesina T. IFC E-Mobility Stakeholder Outreach: SafiRide. 14 April 2021.. 37. Ministry of Finance and Economic Planning of Rwanda. Vision 2050. Kigali:; 2020. 38. SSATP UTM. Sustainable Mobility and Accessibility Policy in Cities of Rwanda. FInal Report. ; 2018. 39. JICA (Japan International Cooperation Agency). Data Collection Survey on Development of Urban Transport System in Kigali City. Final Report. , Republic of Rwanda; 2019. 40. Ministry of Environment Rwanda. Ministry of Environment. [Online].; 2021 [cited 2021 September 16. Available from: https://www.environment.gov.rw/. 41. Ministry of Lands, Environment, Forestry, Water and Mines of Rwanda. National Adaptation Programmes of Action to Climate Change. Kigali: Government of the Republic of Rwanda, Ministry of Lands, Environment, Forestry, Water and Mines of Rwanda; 2006. 42. GoMetro. Fare Payment System Study - Emerging Solutions in the Digitalization Era. Advisory Report. Cape Town: GoMetro, Advisory; 2020. 43. Internaitonal Growth Centre (IGC). International Growth Centre - Rwanda. [Online].; 2021 [cited 2021 October 25. Available from: https://www.theigc.org/country/rwanda/. 44. Global Green Growth Institute (GGGI). Global Green Growth Institute - Rwanda. [Online].; 2021 [cited 2021 October 25. Available from: https://gggi.org/country/rwanda/. 45. Takouleu JM. Afrik 21 - Yacine Fylla: “Our vocation is to democratise electric vehicles in the DRCâ€. [Online].; 2021 [cited 2021 October 22. Available from: https://www.afrik21.africa/en/yacine-fylla-ourvocation-is-to-democratise-electric-vehicles-in-the-drc/. 46. Jolly J. Cutting battery industry's reliance on cobalt will be an uphill task. [Online].; 2020 [cited 2021 September 17. Available from: https://www.theguardian.com/environment/2020/jan/05/cuttingcobalt-challenge-battery-industry-electric-cars-congo. 47. Department of Commerce - United States of America. Democratic Republic of the Congo - Energy. [Online].; 2021 [cited 2021 October 20. Available from: https://www.trade.gov/country-commercialguides/democratic-republic-congo-energy. 106 AFRICA URBAN MOBILITY OBSERVATORY – ROLE OF INFORMAL PARATRANSIT REPORT 48. Ajay Kumar FB. Africa Infrastructure Country Diagnostic: Stuck in Traffic - Urban Transport in Africa. Final. ; 2008. 49. Ministère de l'Environnement et du Développement Durable. The powers of the Vice-Prime Minister, Ministry of the Environment and Sustainable Development. [Online].; 2021 [cited 2021 September 16. Available from: https://medd.gouv.cd/qui-sommes-nous/. 50. Constitution TDRotC. Constitution Net. [Online].; 2005 [cited 2021 September 15. Available from: https://constitutionnet.org/sites/default/files/DRC%20-%20Congo%20Constitution.pdf. 51. JICA (Japan International Cooperation Agency). Project for Urban Transport Master Plan in Kinshasa City. Final Report Volume 1. , MInistry of Infrastructure, Public Works and Reconstruction, DRC; 2019. 52. Ntumba F. HVT Africa Urban Mobility Observatory - Informal Paratransit Stakeholder Engagement (Kinshasa). 17 August 2021.. 53. Alade B. FG to incorporate electric vehicles in revised NAIDP. [Online].; 2021 [cited 2021 September 17. Available from: https://guardian.ng/features/fg-to-incorporate-electric-vehicles-in-revised-naidp/. 54. Stallion Group. FG, Stallion Motors Unveil Nigeria’s First Electric Car in Abuja. [Online].; 2020 [cited 2021 Septmeber 17. Available from: https://stalliongroup.com/blogs/governor-inaugurates-nigerias-firstelectric-car-hyundai-kona-at-stallion-group-von-assembly-plant-2-2/. 55. Magoum I. NIGERIA: Stallion Motors launches its Hyundai-Kona, a 100% electric car. [Online].; 2020 [cited 2021 September 17. Available from: https://www.afrik21.africa/en/nigeria-stallion-motorslaunches-its-hyundai-kona-a-100-electric-car/. 56. Odunsi W. Nigerian govt commissions electric vehicle charging station in Lagos. [Online].; 2021 [cited 2021 September 17. Available from: https://dailypost.ng/2021/07/13/nigerian-govt-commissionselectric-vehicle-charging-station-in-lagos/. 57. US Aid. Nigeria - Power Africa Fact Sheet. [Online].; 2021 [cited 2021 October 20. Available from: https://www.usaid.gov/powerafrica/nigeria. 58. Department of Commerce - United States of America. Nigeria - Country Commercial Guide. [Online].; 2021 [cited 2021 October 20. Available from: https://www.trade.gov/country-commercialguides/nigeria-electricity-and-power-systems. 59. Centre IIG. The BRT and the danfo: A case study of Lagos’ transport reforms from 1999-2019. Case Study. Cities that Work; 2019. 60. Otunola B, Kriticos S, Harmon O. The BRT and the danfo: A case study of Lagos' transport refroms from 1999 - 2019. [Online].; 2019 [cited 2021 September 20. Available from: https://www.theigc.org/wpcontent/uploads/2019/10/lagos-BRT-case-study.pdf. 61. Clean Tech Incubation and Acceleration Foundation. National Policy on Climate Change. Curated version. , Federal Ministry of Environment; 2013. 62. Lagos State Government. Lagos State Development Plan 2012-2025. Main Document. , Minstry of Economic Planning and Budget; 2013. 107 AFRICA URBAN MOBILITY OBSERVATORY – ROLE OF INFORMAL PARATRANSIT REPORT 63. Amure K. HVT Africa Urban Mobility Observatory - Informal Paratransit Stakeholder Engagement (Lagos). 17 Augusts 2021.. 64. Lagos State Ministry of Transportation. Lagos NMT Policy - Empowering pedestrians and cyclists for a better city. Institute for Transportation and Development Policy, United Nations Environment Programme; 2018. 65. SSATP, The World Bank. Toolkit on Fare Collection Systems for Urban Passenger Transport - Lagos, Niegria. [Online].; 2011 [cited 2021 26 August. 66. Arrive Alive Road Safety Initiative (AARSI). Arrive Alive Road Safety Initiative - About Us. [Online].; 2013 [cited 2021 October 25. Available from: https://arrivealiveng.com/about-us/. 67. Parthan B. Lesotho: Renewable Energy Policy (Draft). Draft Policy. Kottayam: Sustainable Energy Associates; 2013. 68. Ministry of Energy and Meteorology Lesotho. Lesotho Energy Policy. Maseru: Government of Lesotho, Ministry of Energy and Meteorology; 2015. 69. Department of Commerce - United States of America. Lesotho - Country Commercial Guide. [Online].; 2021 [cited 2021 October 20. Available from: https://www.trade.gov/country-commercialguides/lesotho-renewable-energy. 70. Government of the Kingdom of Lesotho. Maseru Urban Planning and Transport Study. Final Report. , Ministry of Public Works and Transport and Maseru City Council; 2011. 71. T. Letete EMLSHMPN. Lesotho’s 4th National Greenhouse Gas Inventory: 2011 - 2017. Final. , Ministry of Energy and Meteorology; 2019. 72. United Nations Framework Convention on Climate Change. Terms of Reference - Country Expert - Supporting the Preparation of the National Adaptation Plan (NAP) of Lesotho. Kampala: United Nations Framework Convention on Climate Change, Regional Collaboration Centre - Kampala; 2020. 73. Lesotho Council of Non-Governmental Organisations (LCN). Lesotho Council of Non-Governmental Organisations - About LCN. [Online].; 2021 [cited 2021 October 25. Available from: http://www.lcn.org.ls/about/default.php. 74. Philip vR. Consultation on Paratransit Reform Strategies for Sub-Saharan Africa. 2021.. 75. Ministry of ICT Rwanda. 4G LTE INTERNET BUS PROJECT LAUNCHED. [Online].; 2021 [cited 2021 September 20. Available from: https://www.minict.gov.rw/news-detail/4g-lte-internet-bus-projectlaunched. 76. Business Call to Action. CanGo (Formerly SafeMotos). [Online]. [cited 2021 September 3. Available from: https://www.businesscalltoaction.org/member/safemotos. 77. SafiRide. Find your city. [Online].; 2021 [cited 2021 September 6. Available from: https://safiride.com/cities/. 108 AFRICA URBAN MOBILITY OBSERVATORY – ROLE OF INFORMAL PARATRANSIT REPORT 78. YegoMoto. Home. [Online].; 2017 [cited 2021 September 6. Available from: https://www.yegomoto.com/. 79. CPCS. Study for the Implementation of an Improved Metropolitan Public Transport System for the Greater Gaborone Area. Final Report. , The Ministry of Transport & Communications, Botswana; 2016. 80. Salau T. Public transportation in metropolitan Lagos Nigeria: analysis of public transport users’ socioeconomic characteristics. Urban, Planning and Transport Research. 2015; 3. 81. Mogaji E. Impact of COVID-19 on transportation in Lagos, Nigeria. Transportation Research Interdisciplinary Perspectives. 2020 June; 6. 82. SLOCAT Partnership on Sustainable Low Carbon Transport. Transport and Climate Change Global Status Report. 2nd Edition. ; 2021. 83. Jennings G&BR. The case for investing in paratransit strategies for regulation and reform. : Volvo Research and Educational Foundations (VREF); 2017. 84. Menash. Ghana: Why Tricycles Are Edging Taxis in Northern Ghana. [Online].; 2017 [cited 2021 September 10. Available from: https://allafrica.com/stories/201706191047.html. 85. International Council on Clean Transportation. Developing a roadmap for the adoption of clean fuel and vehicle standards in Southern and Western Africa. Final. ; 2017. 86. Zacharof NG, Fontaras G, Ciuffo B, Tsiakmakis S, Anagnostopoulos K, Marotta A, et al. Review of in use factors affecting the fuel consumption and CO2 emissions of passenger cars. Luxembourg: European Commision, JRC Science Hub; 2016. Report No.: ISBN 978-92-79-57593-8. 87. Carslaw D. Emissions deterioration – the Cinderella of vehicle emissions measurement. [Online].; 2018 [cited 2021 October 21. Available from: https://ee.ricardo.com/news/emissions-deterioration- %E2%80%93-the-cinderella-of-vehicl. 88. Carslaw D, Farren N, Borken-Kleefeld J, Sjödin Ã…. Study on the durability of European passenger car emission control systems utilizing remote sensing data. Stockholm: IVL Swedish Environmental Research Institute, IVL Swedish Environmental Research Institute; 2019. Report No.: ISBN: 978-91-7883-035-0. 89. WorldAtlas. Countries. [Online].; 2021 [cited 2021 September 20. Available from: https://www.worldatlas.com/. 90. GoAscendal. HVT Africa Urban Mobility Observatory. [Online].; 2021 [cited 2021 September 09. Available from: https://africa-observatory.staging.gometroapp.com/#/start. 91. YTCM (Yellow Top Cab Malawi). Yellow Top Cab Malawi. [Online]. [cited 2021 September 2. Available from: http://yellowtopmalawi.com/. 92. WorldoMeter. CO2 Emissions. [Online].; 2016 [cited 2021 September 16. Available from: https://www.worldometers.info/co2-emissions/. 93. CCARDESA. Taxing carbon emissions in Malawi. [Online].; 2020 [cited 2021 September 16. Available from: https://www.ccardesa.org/taxing-carbon-emissions-malawi. 109 AFRICA URBAN MOBILITY OBSERVATORY – ROLE OF INFORMAL PARATRANSIT REPORT 94. Republic of Malawi. National Transport Policy. 2019.. 95. Mzengereza IT. Informal Paratransit Interview. 2021 September 6. Blantyre Informal Paratransit Questions. 96. CFTC (Competition and Fare Trading Commission). Competition Assessment in Malawi Transport Sector. In ACER Conference; 2016; Livingstone, Zambia. 97. Seth W. Botswana and Its People - Major Urban Cities: New Africa Press; 2008. 98. Statistics Botswana. Botswana Statistical Year Book 2010. Gaborone:; 2011. 99. PAGE (Policy Analysis Growth and Employment). Sustainable Development Goals, Botswana: A Case Study of Gabane Village in Kweneng District. 2020 May. 100. Statistics Botswana. 2011 Population and Housing Census. Gaborone:; 2012. 101. Vincent Manirakiza LMANMN. City Profile: Kigali, Rwanda. National Institute of Urban Affairs (NIUA). 2019: p. 290-307. 102. Transitec, ODA & GoMetro. Business Model for Public Transport Services in the City of Kigali - Phase 2 - Diagnosis and future scenarios. Second Interim Report – Draft Version. ; 2019. 103. Africa D. Rwanda’s SafeMotos rebrands to CanGo, expands to DRC after raising funding. [Online].; 2019 [cited 2021 September 6. Available from: https://disrupt-africa.com/2019/09/10/rwandas-safemotosrebrands-to-cango-expands-to-drc-after-raising-funding/. 104. Newsroom V. First for Africa: Volkswagen and Siemens launch joint electric mobility pilot project in Rwanda. [Online].; 2019 [cited 2021 September 8. Available from: https://www.volkswagennewsroom.com/en/press-releases/first-for-africa-volkswagen-and-siemens-launch-joint-electricmobility-pilot-project-in-rwanda-5510. 105. The City of Kigali. Transport Plan - Kigali Master Plan 2050. Kigali:; 2020. 106. Kigali Bus Services. Kigali Bus Services. [Online].; 2021 [cited 2021 April 30. Available from: https://kigalibusservices.rw/. 107. GoMetro , Transitec , TESS , ODA. Second Interim Report Kigali Bus Restructuring Business Model. Cape Town:; 2019. 108. Ndikubwimana F. IFC Stakeholder Outreach - Jali Transport. 2021 March 29.. 109. SafiRide. SafiRide E-Mobility Transport Services. [Online].; 2020 [cited 2021 April 30. Available from: https://safiride.com/. 110. Ampersand. Ampersand. [Online].; 2020 [cited 2021 April 30. Available from: https://www.ampersand.solar/. 111. Kumar M. YegoMoto Interview. 2021 April 16.. 110 AFRICA URBAN MOBILITY OBSERVATORY – ROLE OF INFORMAL PARATRANSIT REPORT 112. Zirikana F. HVT Africa Urban Mobility Observatory - Informal Paratransit Stakeholder Engagement (Kigali). 7 September 2021.. 113. SSATP Africa Transport Policy Program. Policies for Sustainable Policies for Sustainable Policies for Sustainable. Working Paper No. 106. ; 2015. 114. France24. DR Congo taxi service puts women in the driver's seat. [Online].; 2020 [cited 2021 August 25. Available from: https://www.france24.com/en/20200307-dr-congo-taxi-service-puts-women-in-thedriver-s-seat. 115. AfCAP (Africa Community Access Partnership). Enhancing understanding on safe motorcycle and threewheeler use for rural transport in DRC. Literature Review. ; 2019. 116. C. McFarlane1 2P.IRSLAMENRDXJVFMCMRSDMW. First Measurements of Ambient PM2.5 in Kinshasa, Democratic Republic of Congo and Brazzaville, Republic of Congo Using Field-calibrated Low-cost Sensors. Aerosol and Air Quality Research. 2021 March; 21(7). 117. Corneille Luboya Tshiunza HSBCKK. Life Cycle of Public Transportation Companies of DR Congo. Open Journal of Social Sciences. 2018; 6. 118. (JICA) JICA. The Developmen Study for Urban Rehabilitation Plan of KInshasa on the DRC. Final, Action Plan. , The DRC Kinshasa Provincial Government; 2010. 119. LonelyPlanet. Getting Around. [Online].; 2021 [cited 2021 August 24. Available from: https://www.lonelyplanet.com/democratic-republic-of-congo/kinshasa/narratives/practicalinformation/transport/getting-around. 120. Le Phare Online. Transports en commun : un « esprit de mort» sème la mort à Lemba. [Online].; 2014 [cited 2021 September 04. Available from: https://www.lephareonline.net/transports-en-commun-unesprit-de-mort-seme-la-mort-a-lemba/. 121. Zencey. Zencey now available for public transport drivers in Congo Kinshasa. [Online].; 2021 [cited 2021 September 04. Available from: https://www.zencey.com/2021/08/13/zencey-now-available-for-publictransport-drivers-in-congo-kinshasa/. 122. Radio Okapi. Kinshasa: la circulation des taxis-moto limitée à 20 heures. [Online].; 2016 [cited 2021 September 05. Available from: https://www.radiookapi.net/2016/11/30/actualite/societe/kinshasa-lacirculation-des-taxis-moto-limitee-20-heures. 123. Radio Okapi. Kinshasa : les activités des motocyclistes prolongées jusqu'à minuit. [Online].; 2018 [cited 2021 September 04. Available from: https://www.radiookapi.net/2018/09/11/actualite/securite/kinshasa-les-activites-des-motocyclistesprolongees-jusqua-minuit. 124. Patrick McSharry OP. Public Transportation Demand Analysis: A Case Study of Metropolitan Lagos. ResearchGate. 2021. 125. Nation T. Molue banned on Lagos Island. [Online].; 2013 [cited 2021 August 27. Available from: https://thenationonlineng.net/molue-banned-on-lagos-island/. 111 AFRICA URBAN MOBILITY OBSERVATORY – ROLE OF INFORMAL PARATRANSIT REPORT 126. Bureau of Statistics Lesotho. 2016 Census - Summary of Key Findings. Population Census Report. Maseru: Ministry of Development Planning; 2016. 127. Driving Directions and Maps. Lesotho Google Map. [Online].; 2021 [cited 2021 September 10. Available from: https://www.drivingdirectionsandmaps.com/wp-content/uploads/country-maps/lt-countrymap.webp. 128. Codatu. Paratransit: A Key element in a Dual System. ; 2015. 129. Kumar M. YegoMoto Interview. 2021 April 16.. 130. Government of Rwanda. Media Brief - Electric Mobility Adoption. Kigali: Government of Rwanda; 2021. 131. A. Adedoyin KFDNBJGMGANGPGRCSMK. Botswana Greenhoue Gas (GHG) Inventories for Biennial Update Report (BUR). Final. , Minstry of Environment, Wildlife and Tourism; 2016. 132. M. Chinombo FWM. Reduction of Vehicle Emissions in Malawi. In Presented at the Promoting Low Sulphur Fuels and Cleaner, Efficient Vehicles in Malawi Workshop; 2017; Blantyre. 133. Lagos State Government. Lagos Climate Action Plan - Second Five Year Plan (2020 - 2025). Final. , Minstry of Environment and Water Resources; 2020. 134. ISSD (International Institute of Sustainable Development). Democratic Republic of Congo: Greenhouse gas emissions baseline projection. Final. ; 2013. 135. WION Web Team. The city where cyclists are unwelcome. [Online].; 2020 [cited 2021 September 16. Available from: https://www.wionews.com/world/cyclists-are-unwelcome-in-this-city-281081. 136. Vehovar V, Toepoel V, Steinmetz S. Non-probability Sampling Wolf C, Joye D, Smith T, Fu Y, editors. Lodone: Sage; 2016. 137. Glen S. Sample Size in Statistics (How to Find it): Excel, Cochran’s Formula, General Tips. [Online].; 2020 [cited 2020 December 30. Available from: https://www.statisticshowto.com/probability-andstatistics/find-sample-size/. 112 AFRICA URBAN MOBILITY OBSERVATORY – ROLE OF INFORMAL PARATRANSIT REPORT APPENDIX A: STAKEHOLDER QUESTIONNAIRE General Passenger Transport Questions 1. What urban passenger transport services are available in your city and who owns/operates them (e.g.: train, bus, minibus taxi, bicycle taxi, motorbike taxi, metered taxis, e-hailing etc)? 2. Where do these services operate (are they restricted to specific zones or routes)? 3. Roughly how many vehicles operate each of the above services? 4. Roughly what percentage (mode share) of trips are conducted using these services? 5. Does the transport network adequately serve the city’s entire population (are some communities without adequate access to transport)? 6. What is the condition of roads in your city (especially those used by public transport services and informal paratransit - are these roads tarred or gravel)? 7. Are you able to share road fatality data, and is this data disaggregated by mode of transport? Passenger Transport Regulatory Environment Questions 8. What are the key regulations and policies governing transport in your city (especially informal paratransit such as minibus taxis and 4+1 sedan taxis)? 9. Are there any existing passenger transport improvement plans? 10. Who is responsible for enforcing transport regulations, and how well are they enforced? 11. Are there any policies or programmes in place encouraging a shift towards electric vehicles? 12. Women and vulnerable groups experience high rates of harassment while travelling globally a. Are there regulations, policies, processes in place which aim to protect women and vulnerable groups, and ensure ease of reporting incidents? b. Are instances of harassment while travelling frequently reported, and if so, are the perpetrators successfully apprehended and punished? Informal Paratransit Detailed Questions 13. What are the operating models of the informal modes of transport (e.g. minibus taxis, 4+1 taxis, motorbike taxis etc)? 14. Are there any informal paratransit associations, and if so, is membership compulsory to operate in the city? 15. How reliable are these informal services (i.e.: do they run on a fixed schedule, or on a fill-and-go basis, what is the frequency of service)? 16. Are paratransit vehicles generally in good condition or do they break down often? 17. What are the fare structures of these services (route based or distance based), and are they considered to be affordable? 18. How are fares collected (cash only with/without tickets, electronic fare collection)? 19. What types of vehicles are used (typical vehicle models and passenger capacities if known)? 20. Roughly what is the average age of these vehicles? 21. Are there formalised ranks/station/stop/terminal for informal transport operations, and if so a. Where are they typically located? b. What facilities do they offer (seating, roof, toilets, shops) c. In what condition are they? d. Is pedestrian traffic prioritised, and are pedestrians safe (i.e.: few reported incidents of vehicles injuring pedestrians at these locations)? e. Are they integrated with formal public transport services (i.e.: are they in close proximity to formal bus stops and train stations etc)? 113 AFRICA URBAN MOBILITY OBSERVATORY – ROLE OF INFORMAL PARATRANSIT REPORT APPENDIX B: INTERCEPT SURVEY QUESTIONNAIRE (LAGOS) Welcome to the HVT Africa Urban Mobility Observatory Transport Survey. The data collected will be used to help identify how to improve transport in this city. The estimated duration of this survey is 5 minutes. Collected data is anonymised and aggregated before being published. Your participation is voluntary, if you no longer wish to participate, you may end this survey at any time. You must be 18 years or older to participate. 1. Part A - Initiate Survey 1.1. What is your age? 1.1.1. Response:____ (If 17 or younger, exit and display “thank you for your timeâ€. If over 18, proceed) 1.2. What is your gender? 1.2.1. Female 1.2.2. Male 1.2.3. Non-Binary 2. Part B - Travel Survey 2.1. What is your area of residence? 2.1.1. Agege 2.1.2. Ajeromi Ifelodun 2.1.3. Alimosho 2.1.4. Amuwo Odofin 2.1.5. Apapa 2.1.6. Eti Osa 2.1.7. Ifako Ijaye 2.1.8. Ikeja 2.1.9. Kosofe 2.1.10. Lagos Island 2.1.11. Lagos Mainland 2.1.12. Mushin 2.1.13. Ojo 2.1.14. Oshodi Isolo 2.1.15. Shomolu 2.1.16. Surulere 2.2. What is the most common reason for you to travel in this city? 2.2.1. Work 2.2.2. Shops/Food 2.2.3. Healthcare 2.2.4. Social 2.2.5. Education Access 2.3. What is the area of this activity? 2.3.1. Agege 2.3.2. Ajeromi Ifelodun 2.3.3. Alimosho 2.3.4. Amuwo Odofin 2.3.5. Apapa 2.3.6. Eti Osa 2.3.7. Ifako Ijaye 2.3.8. Ikeja 114 AFRICA URBAN MOBILITY OBSERVATORY – ROLE OF INFORMAL PARATRANSIT REPORT 2.3.9. Kosofe 2.3.10. Lagos Island 2.3.11. Lagos Mainland 2.3.12. Mushin 2.3.13. Ojo 2.3.14. Oshodi Isolo 2.3.15. Shomolu 2.3.16. Surulere 2.4. How much does this return journey typically cost per day (in NGN) 2.4.1. Response:_____ 2.5. How many times a week (enter number) do you typically take this journey? 2.5.1. Response:_____ 2.6. What time do you usually leave home to reach your destination? 2.6.1. 6am - 7:59am 2.6.2. 8am - 8:59am 2.6.3. 9am - 2:59pm 2.6.4. 3pm - 4:59pm 2.6.5. 5pm - 5:59pm 2.6.6. 6pm - 5:59am 2.7. How long (in minutes) does it take you to travel from home to your destination? 2.7.1. Response:_____ 2.8. What time do you usually leave to return home? 2.8.1. 6am - 7:59am 2.8.2. 8am - 8:59am 2.8.3. 9am - 2:59pm 2.8.4. 3pm - 4:59pm 2.8.5. 5pm - 5:59pm 2.8.6. 6pm - 5:59am 2.9. How long (in minutes) does it take to return home? 2.9.1. Response:_____ 2.10. How do you usually travel? 2.10.1. Walking Only (skip to 3.1) 2.10.2. Cycling Only (skip to 3.1) 2.10.3. Private Transport (car, motorbike, metered taxi) (skip to 3.1) 2.10.4. Minibus Taxi 2.10.5. Sedan/MPV Shared Taxi 2.10.6. Motorbike/3-wheeler Taxi 2.10.7. City bus 2.10.8. BRT bus 2.10.9. Water Ferry 2.11. How many times do you change vehicles during your journey? 2.11.1. None (direct route) 2.11.2. Once 2.11.3. Twice 2.11.4. Three times or more 2.12. How comfortable are the vehicles you usually use when making this journey? 2.12.1. Poor 115 AFRICA URBAN MOBILITY OBSERVATORY – ROLE OF INFORMAL PARATRANSIT REPORT 2.12.2. Fair 2.12.3. Excellent 2.13. How crowded are the vehicles usually when you make this journey? 2.13.1. Not crowded 2.13.2. Fairly crowded 2.13.3. Very crowded 3. Part C - Travel Experience 3.1. Have you ever been a victim of, or witnessed crime while travelling or waiting for transport in this city? 3.1.1. No 3.1.2. Once 3.1.3. More than once 3.1.4. Very often 3.2. Have you ever been a victim of, or witnessed anyone being sexually harassed while travelling or waiting for transport in this city? 3.2.1. No 3.2.2. Once 3.2.3. More than once 3.2.4. Very often 3.3. How frequently do public transport vehicles break down during your journey? 3.3.1. Never 3.3.2. Sometimes 3.3.3. Often 3.4. How would you rate public transport drivers’ adherence to road regulations? 3.4.1. Poor 3.4.2. Acceptable 3.4.3. Excellent 3.5. Is public transport reliable/on time? 3.5.1. Usually late 3.5.2. Usually on time 3.5.3. Always on time 4. Part D - Demographics 4.1. What is your highest qualification? 4.1.1. None 4.1.2. Primary School 4.1.3. High School 4.1.4. College/University/Technical 4.2. What is your occupation status? 4.2.1. Employed/Self-Employed 4.2.2. Full-Time Parent 4.2.3. Student/Scholar 4.2.4. Unemployed 4.2.5. Pensioner 4.3. What is your monthly household income? 4.3.1. Under NGN39,999 4.3.2. NGN40,000 to NGN99,999 4.3.3. NGN100,000 to NGN199,999 116 AFRICA URBAN MOBILITY OBSERVATORY – ROLE OF INFORMAL PARATRANSIT REPORT 4.3.4. NGN200,000 to NGN399,999 4.3.5. NGN400,000 to NGN799,999 4.3.6. Over NGN800,000 4.4. Do you have any physical disabilities? 4.4.1. None 4.4.2. Sight 4.4.3. Hearing 4.4.4. Mobility 4.4.5. Speech 117 AFRICA URBAN MOBILITY OBSERVATORY – ROLE OF INFORMAL PARATRANSIT REPORT GoMetro 13 Kwagga Street Goedemoed Cape Town, 7550 Tel: +2721 824 3343 Email: admin@gometro.com Web: www.getgometro.com