Overview
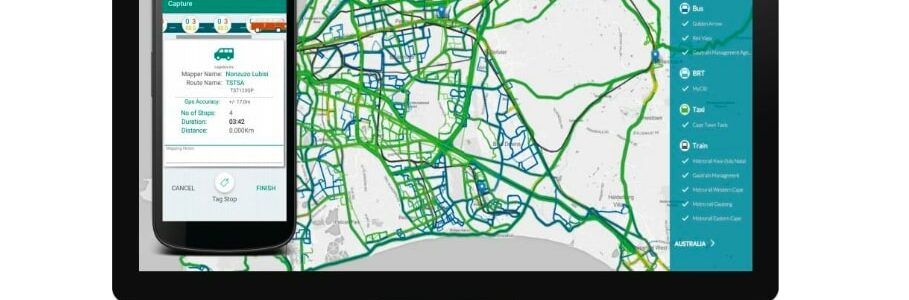
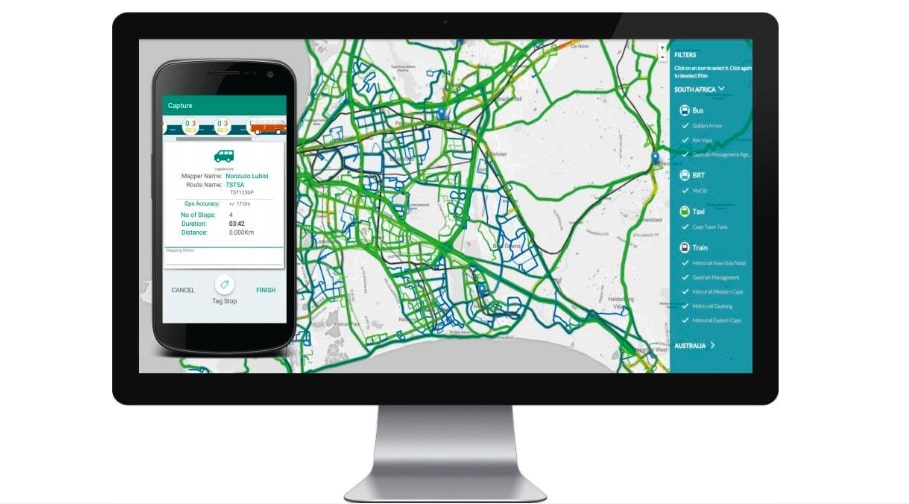
The key objective of the Africa Urban Mobility Observatory (AUMO) research project is to promote inclusive, lowcarbon mobility in African Low-Income Country (LIC) cities, by piloting Big Data applications to generate data, benchmark performance, and draw policy insights in six African cities. These insights will be used to develop Action Plans in two of these cities, and catalyse broader uptake via a Web Data Platform, workshops, and research. This research paper compares policy regimes to better understand and optimise sustainable mobility pathways. It analyses the mobility performance and policy drivers of Blantyre (Malawi); Kinshasa (DRC); Maseru (Lesotho); Lagos (Nigeria); Kigali (Rwanda) and Gaborone (Botswana).
Publications with the same themes

Publications with the same study countries

Related news & events

Podcast

Blog
PDF content (text-only)
Big Data to Enable Inclusive, Low-Carbon Mobility Africa Urban Mobility Observatory Policy and Planning Insights Report February 2022 Africa Urban Mobility Observatory/40001 HVT042 - GoMetro This research was funded by UKAID through the UK Foreign, Commonwealth and Development Office under the High Volume Transport Applied Research Programme, managed by IMC Worldwide. The views expressed in this report do not necessarily reflect the UK government’s official policies. Reference No. HVT/042 Lead Organisation/ Consultant GoMetro (PTY) LTD Partner Organisation(s)/ Consultant(s) UN-Habitat, Wuppertal Institute, UEMI Title HVT Africa Urban Mobility Observatory – Policy and Planning Insights Report Type of document Project Report Theme Climate change Sub-theme Urban Transport Author(s) Carolina Benavides, Janene Tuniz; Judith Owigar, Lander Bosch, Stefanie Holzwarth, Sydney Satsiru Lead contact Philip Krause Geographical Location(s) Malawi, Botswana, Rwanda, DR Congo, Nigeria, Lesotho Abstract The key objective of the Africa Urban Mobility Observatory (AUMO) research project is to promote inclusive, lowcarbon mobility in African Low-Income Country (LIC) cities, by piloting Big Data applications to generate data, benchmark performance, and draw policy insights in six African cities. These insights will be used to develop Action Plans in two of these cities, and catalyse broader uptake via a Web Data Platform, workshops, and research. This research paper compares policy regimes to better understand and optimise sustainable mobility pathways. It analyses the mobility performance and policy drivers of Blantyre (Malawi); Kinshasa (DRC); Maseru (Lesotho); Lagos (Nigeria); Kigali (Rwanda) and Gaborone (Botswana). Keywords Informal Paratransit; Low Income Country; Inclusivity; Mobility; Big Data; Transport Policy; Vision 2063; Road Safety; Mobility Pathways; Climate Change; Air Quality; Accessibility Funding UKAid/ FCDO Acknowledgements Gratitude to the stakeholders in Kigali and Blantyre who shared their sector specific insights and provided detailed information on the unique mobility innovations and challenges experienced in their cities. Issue Status Author(s) Reviewed By Approved By Issue Date 1 Draft Report Carolina Benavides; Lander Bosch; Sydney Satsiru Debashish Bhattacharjee; Janene Tuniz - 11 November 2021 2 Draft Report Carolina Benavides; Janene Tuniz; Lander Bosch; Sydney Satsiru Judith Anne; Adem Owigar - 29 December 2021 3 Draft Report Carolina Benavides; Janene Tuniz; Lander Bosch; Sydney Satsiru Stefanie Holzwarth - 20 January 2022 4 Final Draft Carolina Benavides; Janene Tuniz; Lander Bosch, Sydney Satsiru; Judith Owigar; Stefanie Holzwarth Philip Krause - 26 January 2022 5 Updated Final Draft Carolina Benavides; Janene Tuniz; Lander Bosch, Sydney Satsiru; Judith Owigar; Stefanie Holzwarth Philip Krause Justin Coetzee 25 February 2022 6 Final Release Carolina Benavides; Janene Tuniz; Lander Bosch, Sydney Satsiru; Judith Owigar; Stefanie Holzwarth Philip Krause Justin Coetzee 7 March 2022 i AFRICA URBAN MOBILITY OBSERVATORY – POLICY AND PLANNING INSIGHTS REPORT CONTENTS Executive Summary ix Methodology ix Summary of Findings ix 1. Introduction 1 1.1 Report objectives 1 1.2 Report Structure 1 1.3 Research background and objectives 2 1.4 Project activity streams and deliverables overview 2 2. Background 4 2.1 Regional Policy Guidance 4 2.2 Positive Mobility Pathways 5 2.2.1 Car Use Restriction 6 2.2.2 Congestion Charging 6 2.2.3 Low Emission Zone (LEZ) 7 2.2.4 Walking and Cycling Policy – Complete Streets 8 2.2.5 Modernising Informal Transport and Paratransit 9 2.2.6 Parking Management 9 2.2.7 Bus Rapid Transit 10 2.2.8 Digital Innovation 10 2.2.9 Electrification of vehicle fleets 11 2.2.10 Climate resilient transport 11 2.2.11 Road safety innovation 12 2.2.12 Bike share Schemes 13 2.2.13 Personal Safety 13 2.2.14 Transit-Oriented Development 14 2.3 Negative Mobility Pathways – and the need to end the “Car Focus†14 3. Blantyre, Malawi 17 3.1 National Policy frameworks 17 3.1.1 Climate Change and air quality 19 3.1.2 Accessibility and Safety 20 3.2 Blantyre Mobility Landscape 21 3.2.1 Urban Mobility Trajectory 22 3.2.2 Barriers to Sustainable Mobility Solutions 23 3.2.3 Recommendations and Insights 23 4. Gaborone, Botswana 25 4.1 National Policy Frameworks 25 4.1.1 Climate change and air quality 28 4.1.2 Accessibility and Safety 29 4.2 Gaborone Mobility Landscape: 29 4.2.1 Urban Mobility Trajectory 30 ii AFRICA URBAN MOBILITY OBSERVATORY – POLICY AND PLANNING INSIGHTS REPORT 4.2.2 Barriers to Sustainable Mobility Solutions 31 4.2.3 Recommendations and Insights 31 5. Kigali, Rwanda 33 5.1 National Policy Frameworks 33 5.1.1 Climate Change and Air Quality 33 5.1.2 Accessibility and Safety 34 5.2 Kigali Mobility Landscape 35 5.2.1 Urban Mobility Trajectory 36 5.2.2 Barriers to Sustainable Mobility Solutions 37 5.2.3 Recommendations and Insights 38 6. Kinshasa, DRC 39 6.1 National Policy Frameworks 39 6.1.1 Climate Change and Air Quality 41 6.1.2 Accessibility and Safety 41 6.2 Kinshasa Mobility Landscape: 42 6.2.1 Urban Mobility Trajectory 42 6.2.2 Barriers to Sustainable Mobility Solutions 43 6.2.3 Recommendations and Insights 43 7. Lagos, Nigeria 45 7.1 National Policy Frameworks 45 7.1.1 Climate Change and Air Quality 46 7.1.2 Accessibility and Safety 47 7.2 Lagos Mobility Landscape 48 7.2.1 Urban Mobility Trajectory 48 7.2.2 Barriers to Sustainable Mobility Solutions 49 7.2.3 Recommendations and Insights 49 8. Maseru, Lesotho 51 8.1 National Policy Frameworks 51 8.1.1 Climate Change and Air Quality 53 8.1.2 Accessibility and Safety 54 8.2 Maseru Mobility Landscape 54 8.2.1 Urban Mobility Trajectory 55 8.2.2 Barriers to Sustainable Mobility Solutions 56 8.2.3 Recommendations and Insights 56 9. AUMO City Analysis 58 10. Mobility Analysis 62 10.1 Ensuring Positive Urban Mobility Pathways 62 10.1.1 Preventing Negative Pathways 63 11. Conclusions 65 12. References 66 Appendix A: Road Safety Data 77 iii AFRICA URBAN MOBILITY OBSERVATORY – POLICY AND PLANNING INSIGHTS REPORT Appendix B: Meeting Monitoring and Evaluation Data 78 TABLES Table 1: Summary of Sustainable urban mobility actions and potential benefits................................................. 1 Table 2: Project deliverables per activity stream................................................................................................... 3 Table 3: Transport measures in Malawi NDC Implementation Plan (Malawi Updated NDC July 2021) ............. 20 Table 4: Summary of Urban Mobility Actions in Blantyre.................................................................................... 22 Table 5: Summary of urban mobility actions in Gaborone .................................................................................. 31 Table 6: Summary of urban mobility actions in Kigali.......................................................................................... 37 Table 7: Main Stakeholders in Urban Development and Management in DRC (135) ......................................... 39 Table 8: SLCP Transport Measures in the Nigerian 2019 SLCP Plan .................................................................... 47 Table 9: Summary of urban mobility actions in Lagos......................................................................................... 48 Table 10: Sustainable Quality Transport Network Strategic Objectives set out in Lesotho's Draft NSDP II........ 52 Table 11: History of Development Plans in Maseru............................................................................................. 55 Table 12: Summary of urban mobility actions in Maseru .................................................................................... 55 Table 13: Road Safety Data for AUMO cities........................................................................................................ 77 Table 14: Kigali Stakeholder Engagement Meeting ............................................................................................. 78 Table 15: Blantyre Stakeholder Engagement Meeting ........................................................................................ 79 FIGURES Figure 1: Research activity flow ............................................................................................................................. 3 Figure 2: Map depicting London's ULEZ (Blue) and Congestion Charging zones (red).......................................... 8 Figure 3: Passenger Capacity of different types of roads (39)............................................................................. 15 Figure 4: Pillar 3 of the Botswana Vision 2036 (Sustainable Environment)......................................................... 26 Figure 5: Pillar 1 of the Botswana Vision 2036 (Sustainable Economy)............................................................... 28 Figure 6: Proposed Zoning in the Kigali Master Implementation Plan for 2050.................................................. 36 Figure 7: Transport Infrastructure in the Democratic Republic of the Congo (135)............................................ 40 Figure 8: Summary of urban mobility actions in Kinshasa ................................................................................... 43 Figure 9: AUMO Data collected on perceived level of comfort of public transport vehicles. ............................. 58 Figure 10:AUMO data collected on mode share during peak and off-peak periods........................................... 59 Figure 11: AUMO Data collected on witnessed and experienced levels of sexual harassment while travelling on public transport.................................................................................................................................................... 60 Figure 12: Perceptions of crime by gender in the AUMO cities........................................................................... 60 Figure 13: AUMO Data collected on average distance travelled per city by education level.............................. 61 Figure 14: Implementing the New Urban Agenda for Africa's transformation - Policy and Implementation priorities (161)...................................................................................................................................................... 62 iv AFRICA URBAN MOBILITY OBSERVATORY – POLICY AND PLANNING INSIGHTS REPORT ACRONYMS AND ABBREVIATIONS ALS Area Licensing Scheme AQMS Air Quality Monitoring System ASI Avoid Shift Improve AUMO African Urban Mobility Observatory BADEA Arab Bank for Economic Development in Africa BITP Botswana Integrated Transport Project BRT Bus Rapid Transit CBD Central business district CCD Climate Change Department CNG Compressed Natural Gas CNPR National Program for Road Safety CoK The City of Kigali COP Conference of the Parties (United Nations Climate Change Conference) CO2 Carbon Dioxide CRPD Convention on the Rights of Persons with Disabilities DART Dar es Salaam Rapid Transit DRC Democratic Republic of the Congo DRTSS Directorate of Road Traffic and Safety Services DTT Department of Traffic and Transportation DVDA Ministry of Rural Development, under the management of the Directorate of Agricultural Roads ECOWAS Economic Community of West African States FCDO United Kingdom’s Foreign, Commonwealth and Development Office FMoPWH Federal Ministry of Power, Works and Housing FMoT Federal Ministry of Transportation FONERWA The National Fund for Environment v AFRICA URBAN MOBILITY OBSERVATORY – POLICY AND PLANNING INSIGHTS REPORT FRSC Federal Road Safety Commission GBVH Gender Based Violence and Harassment GCC Gaborone City Council GDP Gross Domestic Product GGCRS Green Growth and Climate Resilience Strategy GHG Green House Gas GNI Gross National Income GTFS General Transit Feed Specification HVT High Volume Transport IBM International Business Machines Corp ICLEI Local Governments for Sustainability ICT Information Communication Technologies IPTN Integrated Public Transport Network ITDP Institution for Transport and Development Policy ITPCC Integrated Transport Policy Coordination Committee ITS Intelligent Transport Systems JICA Japan International Cooperation Agency KARA Kenya Alliance of Residents Association LAMATA Lagos Metropolitan Area Transport Authority LEZ Low Emission Zone LIC Low Income Countries LSPP Department of Lands, Surveys, and Physical Planning LTE Long-Term Evolution LT-LEDS Low emission development strategy MaaS Mobility as a Service MCC Millennium Challenge Corporation MEDD Ministry of Environment and Sustainable Development vi AFRICA URBAN MOBILITY OBSERVATORY – POLICY AND PLANNING INSIGHTS REPORT MGDS Malawi Growth and Development Strategy MHC Malawi Housing Corporation MININFRA National Ministry of Infrastructure MIPTR Ministry of Infrastructure, Public Works and Reconstruction MIT Massachusetts Institute of Technology MOE Ministry of Environment MoLG&C Ministry of Local Government and Chieftainship MoPW&T Lesotho Ministry of Public Works and Transport MoTPW Ministry of Transport and Public Works MUP&T Study Maseru Urban Planning and Transport Study MW2063 Malawi 2063 NAMA Nationally Appropriate Mitigation Actions NAP National Adaptation Plans NCCP National Climate Change Policy NCCRF National Climate Change Response Framework NDC Nationally Determined Contributions NDP National Development Plan NESP Nigeria Economic Stability Plan NGO Non-Governmental Organisation NIWA National Inland Waterways NMS Nairobi Metropolitan Services NMT Non-Motorised Transport NPA Nigeria Port Authority NPC National Planning Commission NRA National Roads Authority NRSC National Road Safety Committee NRSCM National Road Safety Council of Malawi vii AFRICA URBAN MOBILITY OBSERVATORY – POLICY AND PLANNING INSIGHTS REPORT NSDP National Strategic Development Plan NSP National Settlement Policy NST National Strategy for Transformation NTMP National Transport Master Plan NTC National Transport Commission NTP National Transport Policy NTS National Transformation Strategy NUA New Urban Agenda ODI Overseas Development Institute OPEC Organization of the Petroleum Exporting OVO Office des Voiries et Drainage PDNIT Le Plan Directeur National Intégré des Transports PM Particulate Matter PNSD Plan National Stratégique de Développement RAMS Road Asset Management System RFA Road Fund Administration RIT Rede Integrada de Transporte RMI Road Maintenance Initiative RNP Rwanda National Police RTDA The Rwanda Transport Development Agency SADC Southern African Development Community SDG Sustainable Development Goals SERMP South East Regional Master Plan SGF Office of the Secretary to the Government of the Federation SLCP Short-lived Climate Pollutants SLOCAT Sustainable Low Carbon Transport SOSAK Schéma d'Orientation Stratégique de l'Agglomération Kinoise viii AFRICA URBAN MOBILITY OBSERVATORY – POLICY AND PLANNING INSIGHTS REPORT SSATP African Transport Policy Program SUMP Sustainable Urban Mobility Plan TOD Transit-Orientated Development TU Traffic Unit UEMI Urban Electric Mobility Initiative UK United Kingdom ULEZ Ultra Low Emission Zone UN United Nations UNDP United Nations Development Programme UNEP United Nations Environment Programme UNFCCC United Nations Framework Convention on Climate Change VED Vehicle Excise Duty WHO World Health Organisation WRI World Resources Institute ix AFRICA URBAN MOBILITY OBSERVATORY – POLICY AND PLANNING INSIGHTS REPORT Executive Summary This report aims to benchmark sustainable mobility performance. It compares policy regimes to better understand and optimise transport pathways. It analyses the mobility performance and policy drivers of six African cities: Blantyre (Malawi); Kinshasa (Democratic Republic of the Congo - DRC); Maseru (Lesotho); Lagos (Nigeria); Kigali (Rwanda) and Gaborone (Botswana). This report falls under Activity Stream 2 of the HVT Africa Urban Mobility Observatory (AUMO) project. The primary objective is to determine what the main policy levers for urban transport are and explore the role of data. It sets out the status quo and elaborates on what cities have achieved in terms of mode share, inclusiveness and greenhouse gas emissions, as well as what factors/policies/measures explain their differences. Methodology Extensive desktop research was conducted to capture baseline conditions in the selected cities. A review of existing literature on sustainable mobility initiatives, as well as research on key policies and exogenous variables was undertaken, to understand the factors that influence the mobility system, as well as policy and planning opportunities (to enable a transition towards sustainable mobility). Source materials reviewed included legislation, local and national urban planning strategies, transport policies and improvement plans, journal articles, census data, and various transport and mobility related reports published by Non-Governmental Organisations (NGOs), multilateral banks, international organisations and consulting firms. A large portion of the data analysed in this report was sourced from “The Role of Informal Paratransit Reportâ€, developed as part of the wider AUMO project (Deliverable 4). To close any knowledge gaps, the information was cross-referenced across multiple sources and reviewed by city officials. Where possible, core stakeholders were interviewed via virtual meetings and email, with a specific focus on the two Action Plan cities, namely Blantyre and Kigali. Summary of Findings The most effective initiatives towards low carbon and inclusive mobility include a combination of qualitative improvements to walking, cycling, ridesharing, and public transport services, together with incentives to discourage carbon-intensive modes, as well as integrated transport planning and land use development (1). These measures support more compact and better-connected communities, ensuring a multitude of cobenefits and synergies. However, in many African cities, due to financial, capacity and political constraints, the development and implementation of sustainable mobility policies and actions simultaneously is not always possible and some trade-offs are made. A global consensus represented by the Sustainable Development Goals (SDGs), the Paris Agreement on Climate Change and the New Urban Agenda (NUA) among other frameworks has emerged to guide action by national and local governments and other stakeholders to transform urban mobility to focus on improved and inclusive accessibility and to reduce Green House Gas (GHG) emissions and air pollution from transport while making transport safer. These frameworks highlight the Avoid Shift Improve (ASI) approach. The adoption of the African Union’s Agenda 2063 reaffirms the strong commitment of the continent’s Heads of State and Government to the international frameworks and to transformation - it also explicitly underlines the need for harnessing the potential of urbanisation and ensure access to basic services in the continent’s development by promoting “Modern, affordable and liveable habitats and quality basic servicesâ€. Most of the counties that are involved in the AUMO project have developed comprehensive national policy levers that set out the overall vision. Malawi 2063, Botswana’s Vision 2036, Kigali’s Vision 2050 and Nigeria’s Agenda 2050 (in development) all establish goals and ambitions that incorporate sustainable mobility approaches and strategies. These documents have been translated into medium and short term policy levers in the form of climate strategies, road safety agendas, clean air targets, urban development plans and transport master plans. x AFRICA URBAN MOBILITY OBSERVATORY – POLICY AND PLANNING INSIGHTS REPORT Although there are varied degrees of commitment and styles of policy formation, it can generally be said that on a policy level, sustainable urban mobility is a priority across all 6 cities. However, in some cases due to a lack of systematic funding, poor coordination or political will, implementation is lacking. Despite the possibility for some quick wins in accelerating and leapfrogging negative mobility pathways there are still instances in which private vehicle and high carbon and pollution strategies are prioritised over long term mobility goals. 1 AFRICA URBAN MOBILITY OBSERVATORY – POLICY AND PLANNING INSIGHTS REPORT 1. Introduction 1.1 Report objectives This report aims to benchmarks sustainable mobility performance. It compares policy regimes to better understand transport pathways. It analyses mobility performance and identifies possible policy drivers for six African cities: Blantyre (Malawi); Kinshasa (DRC); Maseru (Lesotho); Lagos (Nigeria); Kigali (Rwanda) and Gaborone (Botswana). The report falls under Activity Stream 2 of the HVT Africa Urban Mobility Observatory (AUMO) project. The primary objective is to determine what the main policy levers for urban transport are and explore the role of data. It sets out the status quo and elaborates on what cities have achieved in terms of mode share, inclusiveness and greenhouse gas emissions as well as what factors / policies explain their differences. This report builds on Deliverable 4 of the project, “The Role of Informal Paratransit Report†and utilises Data from the Africa Urban Mobility Observatory Web Data Platform. To avoid repetition, this report does not include an in-depth analysis of informal paratransit. 1.2 Report Structure The report begins by outlining general policy and sustainability landscapes in both global and African contexts. It then segues into blended case studies that illustrate positive and negative examples of mobility pathways and policy innovations. It includes a general assessment of mobility development pathways and innovations with relevance for the target cities (D5.1). Although it is acknowledged that aviation, rail, road, and maritime innovations all form part of mobility pathways, this report focuses predominantly on road transport. To make relevant policy and planning recommendations, the report expands on national and local contexts for each of the cities. Each section of this report provides an in-depth analysis of the mobility development trajectory, key stakeholders, general policy framework, vision documents and key factors that have contributed to the prevailing mobility system (D5.3). The development trajectory is contextualised using an indepth analysis of the status quo and factors presented in Table 1. Table 1: Summary of Sustainable urban mobility actions and potential benefits Urban Mobility Action Emission Reduction Potential Co-benefits and Synergies Activity: Short travel distances, compact cities and mixed land use. (Metrics: Land use planning and accessibility) Potential to reduce energy consumption by 10% - 30% Reduced travel times; improved air quality, public health, safety, and more equitable access Safety: Speed management, relevant policy and road safety commitment (Metrics: Safe Systems approach and dedicated funds and procedures) Provides an environment in which people want to walk and cycle more, reducing vehicle emissions by reducing vehicle speed and prioritising the movement of people. Congestion mitigation, health benefits and reduced fatalities. Improvement in local air and noise pollution. Structure: Shift to more energy efficient modes such as walking and cycling and accessible public transport. (Metrics: Prioritised NMT and vulnerable groups and reduced costs of mobility and enabling environment) Potential for energy efficiency gains varies greatly, but, for example, Bus Rapid Transit systems can deliver up to 30% reductions at a cost of $1-27 M/km Reduced urban congestion and more equitable access 2 AFRICA URBAN MOBILITY OBSERVATORY – POLICY AND PLANNING INSIGHTS REPORT Urban Mobility Action Emission Reduction Potential Co-benefits and Synergies Fuels and vehicles: Switch to electricity, hydrogen, compressed natural gas, biofuels, and other fuels, vehicle fuel efficiency and age. (Metrics: Vehicle and fuel standards and air quality and environmental considerations) Efficiency improvement of 40% - 60% by 2030 feasible at low or negative costs. Changing the structure of the energy consumption, but not necessarily overall demand Improved energy security, productivity, and affordability. Diversification of the fuels used contributes to climate, air quality, and/or energy security objectives This table is inspired by Sustainable Urban Mobility Pathways: Policies, Institutions and coalitions for low carbon transportation in emerging countries. It is adapted and expanded from IPCC, 2014. Climate Change 2014 - Mitigation O Climate Change, 5th Assessment Report. Cambridge: Cambridge University Press; Figueroa Meza, M.J., Lah, O., Fulton, L.M., McKinnon, A.C., Tiwari, G., 2014. Energy for transport. Ann. Rev. Environ. Resour. 39 (1); Lah, O., 2017a. Continuity and change: dealing with political volatility to advance climate change mitigation strategies— examples from the transport sector. Sustainability 9 (6). https://doi.org/10.3390/su9060959. Although it is acknowledged this table does not incorporate all elements required to assess true mobility trajectories, it does capture the essence of the low carbon and inclusivity dimensions. The policy insights and recommendations for a sustainable mobility pathway for each city based on their existing challenges and priority areas, is outlined after and in the context of the local analysis (D5.4). The last section of this report includes a comparative assessment of mobility performance across target and peer cities (D5.2). It identifies the positive and negative mobility pathways as well as insights into how other comparable cities and regions have addressed the negative trajectories. The conclusion of the report includes general guidelines on improving mobility systems and the importance of ensuring inclusive, low carbon mobility in African cities. 1.3 Research background and objectives The AUMO research project is a component of the second phase of the United Kingdom’s Foreign, Commonwealth and Development Office (FCDO) High Volume Transport (HVT) Applied Research Programme. More specifically, in the context of the impact that urban transport planning has on climate change and inclusion in LIC (Low Income Countries) in Africa, this research intends to address the following three research questions: 1. Big Data Technology: What are the opportunities and risks of big data applications in HVT cities? 2. Informal Paratransit: What is the role of informal transport in the global South and how to enable transition towards a clean, affordable and efficient solution for HVT? 3. Policy Levers: What are the main levers for mode share and what is the role of data? 1.4 Project activity streams and deliverables overview This project comprises four interlinked Activity Streams (see Figure 1). Activity Streams 1, 2 and 3 are led by GoMetro, UN-Habitat, and Wuppertal/UEMI, respectively. Activity Stream 4 is led collaboratively. These Activity Streams run in parallel, and the outputs generated under one Activity Stream are used as inputs to the others. This report, Deliverable 5, falls under Activity Stream 2. A total of 10 deliverables are associated with the four Activity Streams (see Table 2). 3 AFRICA URBAN MOBILITY OBSERVATORY – POLICY AND PLANNING INSIGHTS REPORT Figure 1: Research activity flow Table 2: Project deliverables per activity stream Deliverable Description Activity Stream Submission Date Deliverable 0 Inception Report (submitted) 0 31 August 2020 Deliverable 1 Brief Scoping Report (submitted) 1 30 October 2020 Deliverable 2 Launch of Big Data Application (submitted) 1 18 December 2020 Deliverable 3 Web Data Platform (submitted) 4 26 February 2021 Deliverable 4 Role of Informal Paratransit – Report (submitted) 2 30 September 2021 Deliverable 5 Policy and Planning Insights – Report (This report) 2 28 January 2022 Deliverable 6a Workshop and Webinars (Introductory) (submitted) 4 29 October 2021 Deliverable 6b Workshop and Webinars (Post Data Collection) 4 29 April 2022 Deliverable 7 Big Data and Technology Research Report 3 24 June 2022 Deliverable 8 Action Plans 4 26 August 2022 Deliverable 9 Peer Reviewed Journal Article 4 25 November 2022 4 AFRICA URBAN MOBILITY OBSERVATORY – POLICY AND PLANNING INSIGHTS REPORT 2. Background Africa is undergoing rapid urbanisation. It is predicted that almost 1.33 billion people will be living in cities by 2050, compared to the current 470 million (2). Increasing urban populations are a powerful asset for transformation, however, this potential can only be unlocked if cities are properly planned and sufficiently serviced. Most African cities are not ready to make use of this opportunity and significant transformations are required in order to achieve the future we want. Since cities are the future home for the majority of Africans, now is the time for investing in inclusive and resilient infrastructure (2). Policy and legislation, urban planning and design, governance and comprehensive financing mechanisms are important drivers in achieving the necessary changes (2). It is important to understand the working of these drivers of change and ensure that they are enabled through innovation, complete systems, partnerships and capacity building. Transport policy, planning, governance and infrastructure is essential in reducing spatial inequality and poverty in communities across the urban – rural continuum and an essential component of ensuring an inclusive and resilient future. However, being a highly complex sector with multiple cross sector implications, policy interventions in transport can have unintended positive and negative consequences that decision makers need to be cognisant of (1). A global consensus represented by the SDGs, the Paris Agreement on Climate Change and the NUA guides action by national and local governments and other stakeholders to transform urban mobility to focus on improved and inclusive accessibility and the reduction of GHG emissions as well as air and noise pollution from transport. These frameworks highlight the ASI approach and emphasise the importance of packaging policies. Global evidence suggests that economic growth can be decoupled from motorisation, however, many African cities prioritise vehicle movement over that of people. Central to this problem is the invisibility of travellers’ daily experience due to insufficient data. There is an urgent need for African cities to develop Inclusive Sustainable Urban Mobility Policies and Plans – a long-term vision for mobility geared towards a sustainable, low carbon and inclusive trajectory. Data on the current and future mobility demand and other sustainability parameters is needed to shape such a vision and identify a sustainable pathway for the future. While it is often touted that data required to understand complex issues related to accessibility or mobility patterns is difficult to collect in African cities (3), it is possible to source meaningful information, sustainably. The Africa Urban Mobility Observatory project is a first step in transforming the role of data in decision making for the selected cities. It has the potential to empower local and national authorities to make decisions for the constituents that they represent, as well as future generations, through the development of thoughtful and comprehensive policy and action. Comprehensive and reliable datasets, together with clear policy priorities, can change the course of negative mobility pathways and ensure that key strengths are emphasised and shortfalls addressed. This report aims to understand the trends and drivers in the transport sector for the selected cities through an analysis of the existing policy and institutional set ups, as well as preliminary AUMO data. It includes the generation of insights into what actions or policy levers may be needed to achieve the necessary package of priorities to ensure sustainable, low carbon pathways for transport along with all the potential co-benefits. The insights of this report will also form the basis of the subsequent action planning exercise with Blantyre and Kigali. 2.1 Regional Policy Guidance All countries included in this policy insights report are parties to various multilateral agreements on the environment, urban development and human rights. Some of the multilateral agreements include the UN Framework Convention on Climate Change (UNFCCC), the 1999 Basel Convention and the 1994 Bamako Convention. In terms of urban development, the Sustainable Development Goals as well as NUA establish the frameworks for a more “inclusive, safe, resilient and sustainable†cities, as well as a focus on those that are most vulnerable. Both frameworks place mobility at the heart of sustainable urbanisation and address both its 5 AFRICA URBAN MOBILITY OBSERVATORY – POLICY AND PLANNING INSIGHTS REPORT dimensions – namely, transport as a means to access public goods and quality services – and the accessibility to the means of transport itself (see NUA paragraph 13a). The role of transport in leveraging urbanisation for structural transformation is implicit in NUA paragraphs 113 and 114. Here, cities have committed to promote access to safe, efficient, affordable and sustainable infrastructure for public transport, as well as nonmotorised options such as walking and cycling, prioritising them over private motorised transportation. Governments also pledge to promote equitable Transit Oriented Development (TOD) (see NUA paragraph 114b), as well as improved coordination between transport and land use planning (see NUA paragraph 114c). The adoption of the African Union’s Agenda 2063 reaffirms the strong commitment of the continent’s Heads of State and Government to the international frameworks and to transformation – it also explicitly underlines the need for harnessing the potential of urbanisation and ensure access to basic services through the continent’s development, by promoting modern, affordable and liveable habitats and quality basic services. 2.2 Positive Mobility Pathways A global consensus represented by the SDGs, the Paris Agreement on Climate Change and the NUA, among other frameworks, has emerged to guide action by national and local governments and other stakeholders to transform urban mobility. The focus is on improved, inclusive, accessible transport, with reduced GHG emissions and air pollution, while improving safety. These frameworks highlight the ASI approach. Vital to the success of urban transport is a comprehensive combination of all the measures outlined below: • Avoid – Providing access for all (as stipulated in SDG target 11.2 and the New Urban Agenda) should be a key transport policy objective for local and national governments. Local authorities must ensure proximity of destination and shape land use, urban form and transport infrastructure to reduce necessity for trips and reduce distances travelled. The COVID-19 pandemic illustrated the importance of being able to access daily supplies within a short walking distance. The concept of the 15-minute neighbourhood gained popularity and should be seen as integral to building back better. • Shift – A city can shift the modal share of its transport system towards sustainability, by providing infrastructure and incentives for public transport and active mobility. Concepts such as TOD and Complete Streets can be used as guiding frameworks to create compact, pedestrian- and cyclist-oriented, mixed-use communities centred around high-quality transit systems – encouraging residents to use public transport and non-motorised transport (NMT) conveniently. A good example is Dar es Salaam that introduced a Bus Rapid Transit (BRT) system in 2016 on a high demand corridor, linking residential neighbourhoods to the city centre. As the buses operate on dedicated lanes, this system is considerably more efficient than a regular bus during peak periods, thereby improving levels of service and attracting people to use public transport rather than private cars operating in mixed traffic. Some cities have economic instruments such as parking fees, fuel taxation or congestion charging to disincentivise and restrict the use of private cars. The generated funds can be re-invested in sustainable modes, like public transport or bike share systems. • Improve – Cities have the option to improve the efficiency of vehicle technology and reduce the energy used per vehicle kilometre travelled, by promoting cleaner fuels or incentivising electric mobility. Globally, cities have experimented with various measures to achieve sustainable mobility. For example, improvements to public transport and active mobility, congestion pricing or parking regulations, pedestrianisation and TOD. Cities in Africa and beyond offer abundant experience which supports the identification of how specific policy levers influence mode share, inclusiveness and greenhouse gas emissions. This section outlines several actions and investments driven towards achieving inclusive, low-carbon mobility in alignment with the ASI approach above. It provides insight into the positive and negative aspects of these sustainable mobility levers drawing from global case studies and research initiatives. Although studies indicate that both urban passenger transport and surface freight transport play a major role in decarbonising the transport sector (1), this section focuses on urban innovations as key drivers to achieving Sustainable Development Goal 11.2. 6 AFRICA URBAN MOBILITY OBSERVATORY – POLICY AND PLANNING INSIGHTS REPORT 2.2.1 Car Use Restriction Oslo (Norway), Paris (France), Madrid (Spain), Delhi (India), and several other cities have made headlines for plans to ban cars from certain urban areas (4). Car use regulations come in many forms. The United Kingdom uses Vehicle Excise Duty (VED) or “car taxâ€, an annual tax paid based on vehicle type. In March 2001 the UK reformed the VED provisions to incentivise fuelefficient, low-carbon vehicles (5). The provision has been revised several times in recent years, with the most recent change linking the VED to vehicle retail price and a revised emissions testing method (6). The system is a major source of revenue for the government and is helping to fund the shift to electric vehicles. Santiago (Chile) and Mexico City (Mexico) both have rising private vehicle ownership and use registration plate numbers as a basis for restricting car use in certain areas, to address air quality concerns (7). Several other Latin American cities have since adopted similar measures, including Bogota. Typically, cars with an even number (0, 2, 4, 6, 8) at the end of their license plate number may only drive on even-numbered days of the month, while those with odd numbers (1, 3, 5, 7, 9) may only drive on odd-numbered days. Severe fines are typically levied for non-compliance (8). Determining the methodology and area of restriction can be challenging, as restrictions limit the choice of movement, making them unpopular with private citizens and businesses accustomed to open access. Without affordable and reliable public transport, good land use planning and safe mobility for people that walk and cycle, restrictions can result in significant challenges to movement. This type of measure is particularly challenging in the context of COVID-19, as physical distancing requirements limit carpooling or public transport usage (9). Such restrictions can encourage increased car ownership. In Bogota, after the licence plate-based restrictions were introduced, acquisition of a second car or motorcycle became more common (as this would ensure drivers had access to vehicles with both odd and even numbers) (7). Despite the challenges, urban spaces without cars are safer, more inclusive and healthier. Restrictions can be flexible, depending on the needs of city dwellers and levels of air pollution. In Mexico City, the mayor ordered 2 million cars off the roads for a fixed period to reduce pollution (10). In Delhi (India) where air quality levels are at critical levels, local authorities introduced the licence plate-based restrictions to improve air quality (9). In Bogota, the Mayor’s Office has allowed for exemptions with an annual fee of USD 1,250. It is predicted that up to 60,000 car owners would be willing to pay the fee (7). Although this would result in more vehicles entering the restricted zones, this money has been earmarked for transport projects. The increased levels of traffic and air pollution in the short term can be phased out using the revenue generated by the exemptions to finance more sustainable options. 2.2.2 Congestion Charging Congestion pricing involves charging drivers a fee for using certain roadways that experience congestion. The main purpose of congestion pricing is to encourage drivers to choose other modes of transportation, use other routes, or change their time of travel. Congestion pricing has been proposed, planned or implemented predominantly in Europe, the United States and Asia (11). It is a high cost and high-capacity intervention (12). Road pricing often takes the form of area licensing, high-occupancy toll lanes or cordon tolls. In Sweden congestion charges are formulated as a national tax (13). Congestion charging is not only closely associated with positive environmental action but also with taxes and so the introduction of a congestion charging scheme is often received with mixed reviews (13). Road pricing requires intensive stakeholder engagement, cooperation from the private sector and third parties, as well as a comprehensive customer relationship management. It is usually categorised into four stages (14); • The Corridor Approach; ï‚š Traditional single road toll schemes, first used in Roman times and until recently, have remained the predominant form of charging; 7 AFRICA URBAN MOBILITY OBSERVATORY – POLICY AND PLANNING INSIGHTS REPORT ï‚š Electronic tolling technologies allow conventional toll roads to play a more significant role in congestion management. Electronic tolls are automatic and typically collect fees via wireless invehicle transponders and roadside transceivers. Vehicles are charged when driving through a gantry during operational hours; • Area Scheme; ï‚š Refers to charging users to drive in an area that has a closely integrated road system. Densely urbanised Singapore pioneered the use of road pricing to successfully manage congestion. The arealicensing scheme (ALS) opened in 1975; ï‚š The Singaporean scheme has reduced total peak period traffic by 45% and the number of cars by 70%. It works with pay-and-display labels; • National and Transnational Systems; ï‚š Charged area extends to a wider road network, rather than an individual zone; ï‚š Systems are generally geared towards road user pricing nationwide for trucks or vehicles with heavy loads; • Integrated system; ï‚š A future vision where road users can make informed choices at every step of their journey across transport modes on a national basis. Although effective at reducing congestion, there is a lack of research on the true equity impacts of congestion charging (15). In Stockholm, for example, high income males were found to be most impacted by congestion charging. It is suggested that revenue generated through congestion charging should be used to improve public transport, as this would yield benefit to women and other disadvantaged groups, who typically are more reliant on shared mobility (13). Since the actual effects of congestion charging are highly localised, it is difficult to measure the impact at a network scale. Regardless, improved public transport is an essential policy prerequisite to congestion charging. The perceived business losses and technology and operational costs (especially for electronic tolling) are initially quite significant (11). However, congestion charging has the potential to lessen traffic, improve air quality and increase transport revenue to deliver on better services and facilities (15). Interventions are also often cited to improve travel speeds and journey times (11). Gothenburg, London, Milan, Rome, Singapore and Stockholm demonstrate the feasibility and usefulness of the policy (13). However, the decision to employ congestion charging in the regions was taken over many years, with rich datasets, robust public transport alternatives and intensive stakeholder engagement, together with strong political will. 2.2.3 Low Emission Zone (LEZ) A Clean Air Zone or Low Emission Zone (LEZ) is an area to which access by polluting vehicles is restricted. They are popular in many European cities including London, Berlin and Milan and are ordinarily led by environmental and transport authorities (16). The introduction of LEZs in Europe is partly due to increased environmental awareness of the impacts of poor air quality, congestion and vehicle emissions. These policies promote a “low-carbon pathway†– decoupling economic growth from transport emissions. European Emission Standards typically inform authorities on which vehicles to ban (17). Cities and countries have utilised several implementation techniques. In Germany (where LEZs are known as Umweltzonen), stickers are issued by the State or official bodies – the colour indicates the vehicle’s Euro emissions compliance standard (18). In Germany, where the implementation of LEZs is spearheaded at a national level, there are 58 low-emission zones (across more than 70 cities). Initially, access restrictions limited freight carrier operations, and consequently logistics companies sold their polluting vehicles to countries where there were no restrictions, thereby shifting the problem elsewhere (17). In London, where localised traffic restrictions were introduced in several phases, cameras linked to a national database capture licence plate numbers of vehicles entering LEZs (17). The city recently introduced an UltraLow Emission Zone (ULEZ) which, aside from Christmas day, operates 24 hours a day, 7 days a week (16). Non- 8 AFRICA URBAN MOBILITY OBSERVATORY – POLICY AND PLANNING INSIGHTS REPORT compliant vehicles are billed a daily charge. The aim of the ULEZ is to reduce harmful Nitrogen Dioxide by around 30% across London. All revenue generated is reinvested into improving the transport network (16). Figure 2: Map depicting London's ULEZ (Blue) and Congestion Charging zones (red) LEZs are a powerful tool for local authorities to enact climate, accessibility and air quality policies. Introducing LEZs allow cities to implement actions more quickly in a priority area and measure success (19). The revenue generated can be used to finance more sustainable forms of transport, including walking, cycling and public transport. A failure to clearly communicate the benefits and parameters of an LEZ can lead to resistance, from local businesses especially (19). Challenges for logistics can be addressed through the sharing of infrastructure or micro distribution hubs for last mile connectivity in LEZs (17) (20). It is important to engage and inform citizens on timing of upcoming restrictions or charges (16). 2.2.4 Walking and Cycling Policy – Complete Streets Many cities in Africa have high shares of walking and cycling – however, this is largely not by choice and instead due to the lack of affordable and accessible alternatives (21). Despite high levels of reliance on NMT, cities are not designed for NMT. Vienna, Paris and Copenhagen have realised that street designs that focus on vehicle movement rather than mobility for people undermines quality of life and the character of public spaces (22). Building safe and inclusive walking and cycling infrastructure is crucial to reducing road injuries and mortality, as well as cementing the role of these modes in mobility futures. While there are many innovations in walking and cycling with proven success, the trajectory of Ethiopia is particularly unique and more comparable to the contexts of the cities involved in the AUMO project. Ethiopian authorities and partners have taken significant strides to build on the government’s focus to better design and implement policies and make investment decisions prioritising the needs of pedestrians and cyclists (23). The East African country has recently developed an NMT Strategy both for Ethiopia and Addis Ababa along with a five-year implementation plan for 69 cities and towns. There are also harmonised street design guidelines and efforts to guide investments towards safer facilities for walking and cycling. The Strategies emphasise the need to consider all residents in the plans and budgets, including women, children, and persons with disabilities. 9 AFRICA URBAN MOBILITY OBSERVATORY – POLICY AND PLANNING INSIGHTS REPORT Championed by Ethiopia’s Minister of Transport, H.E. Dagmawit Moges, car-free days and ‘placemaking’ events helped to build public support for walking and cycling, promoting a shift to sustainable mobility focusing on the needs of vulnerable road users (23). Political willingness, the formation of a national NMT steering and technical committee as well as policy on a national and local level has cemented the priority of people in the future of Ethiopia. A second source of inspiration that displays a positive mobility pathway in terms of walking and cycling together with highlighting the importance of stakeholder engagement and collaboration is the development of the NMT policy in Nairobi. The Kenya Alliance of Residents Association (KARA) successfully lead a collaboration with the city, United Nations Environment Programme (UNEP), University of Nairobi and other key actors to develop and pass through the county assembly an NMT policy 2017 (24). KARA has worked consistently with the Nairobi County, linking the government authority to residents and their concerns. Efforts to implement NMT infrastructure are currently spearheaded by Nairobi Metropolitan Services (NMS). 2.2.5 Modernising Informal Transport and Paratransit Although on appearance paratransit can seem disorderly, they are often very intricate systems involving large groups of stakeholders. Paratransit has the advantage of responding to the demand for motorised mobility from a large percentage of urban residents, satisfying a need for travel that cannot be met by walking. With thousands of vehicles in a city and minimal regulation of routes, paratransit is highly responsive to changes in demand. This demand could be as a result of ordinary daily and seasonal changes, or longer-term changes brought about by competing forms of transport, and/or changes in mobility patterns. In Kenya, for example, paratransit is characterised by flexibility and demand responsiveness, lack of schedules, fluctuating fares, poor working conditions, competition, formation of cartels and unpredictable stops and routes (25). The challenge for most transport planners and innovators in developing cities is that the public transport is mainly dominated by the informal sector commonly referred to as Paratransit which has proved hard to monitor and regulate. When public transport services are not well structured, challenges arise. These include informal organisations fighting for territory, drivers speeding to maximise revenue from passenger fares, or vehicles being old, polluting, poorly maintained and inaccessible (26). However, as demonstrated in Deliverable 4, informal paratransit services perform a critical function in all cities included in this study. 2.2.6 Parking Management Effective street parking management enhances efficiently and safety (27). According to research by ITDP (28), cities with higher parking fees have more public transport rides per capita than cities with lower fees. The revenue generated from parking can be used to fund public transport improvements. Many African cities are yet to adequately charge for parking. Parking fees are typically very low, or free, and management and enforcement is seldom digitalised. Many local governments in African cities are still pushing for more parking on streets and in buildings, hoping that this will reduce congestion. However, the opposite is true, with more parking leading to increased congestion, air pollution, road safety concerns and negatives impacts on urban life. While large sums of public funds are spent on constructing multi-level parking, NMT facilities and public transport continue to deteriorate. This is the situation in Nairobi and Addis Ababa, where parking policies make private car use convenient, but fail to manage traffic, thereby exacerbating congestion and pollution (28). IBM’s parking survey of 2011 indicates that people in Nairobi spend on average half an hour to find parking (29), decreasing private vehicle efficiency further. Both cities are planning to increase parking supply, but this will likely on increase congestion. Many cities around the world have recognised that parking is an important mechanism to control the use of cars and have started introducing performance-based pricing for on-street parking or setting maximum parking standards in new private developments (30). All these measures aim to control the supply of parking, especially in transit-oriented neighbourhoods, thereby encouraging a shift towards public transit for longer distances and walking and cycling for short distance trips. 10 AFRICA URBAN MOBILITY OBSERVATORY – POLICY AND PLANNING INSIGHTS REPORT In Mexico City, in 2017 the mayor introduced a parking reform and abolished parking minimums required of new developments and introduced parking maximums instead (31). The outdated parking regulation required developers to build large parking facilities for residential and commercial buildings, regardless of factors such as car ownership, proximity to transit, and market demand. 2.2.7 Bus Rapid Transit Many developing and developed countries are grappling with ways to provide efficient, effective and financially sustainable public transport. Although light rail has often been promoted as a popular solution, BRT systems have emerged as an affordable and attractive alternative in many African cities (32). Unlike traditional bus systems, BRT buses operate in exclusive use lanes, and often have greater capacity, with unique ticketing systems, and systems which provide real-time information to passengers (33). The first official BRT system in the world was the Rede Integrada de Transporte (RIT, "Integrated Transportation Network"), implemented in Curitiba, Brazil in 1974 (34). RIT is the result of 35 years of continuous upgrades to bus service, which ultimately led to the creation of the BRT concept and lent structure to Curitiba's urban development (35). Most of the elements that have become associated with BRT were innovations first suggested by Curitiba Mayor Architect Jaime Lerner. Initially the network comprised dedicated bus lanes in the centre of major arterial roads. In 1980 a feeder bus network and inter-zone connections were added. In 1992, off-board fare collection, enclosed stations, and platform level boarding were introduced. Other systems introduced further innovations, including platooning and passing lanes in Porto Alegre and express service in São Paulo (36). BRT has since migrated to the African continent. Since 2008, when the first African (light) BRT system started operation in Lagos (Nigeria) (37), other cities including Johannesburg, Cape Town, Dar es Salaam and Accra, followed closely behind. The most ambitious BRT system in Africa might be the Dar es Salaam Rapid Transit (DART), operating in the third most rapidly urbanising city in Africa; a city with uncontrollable horizontal growth, severe traffic congestion and low levels of vehicle ownership (33 vehicles per 1000 persons) (38). DART includes six phases and the future completion of 137 km of dedicated roadway and is expected to serve 400,000 passengers per day. The system was launched in 2016 and the first phase comprising 21 km is complete. It has since reduced travel time for some commuters by more than half – from a two-hour commute to 45 minutes per direction (39). DART has been recognised for its high-quality infrastructure and NMT integration for first and last mile connectivity (40). When implementing BRT in African cities, the local contextual conditions such as population density, travel demand, level of affordability, and the structure of the existing paratransit operators, must be considered. A centralised transport authority is also highly advantageous, as demonstrate by the Dar Rapid Transit Agency (Dar es Salaam) and the Lagos Metropolitan Area Transport Authority (LAMATA) (Lagos). While BRT can be cost-effective if implemented at the right scale, and in the right context, there are concerns regarding levels of equity and inclusion. In South Africa, BRT has been associated with high costs and requirement for high levels of subsidy (41). Klopp et al (41) highlight that the first phase of BRT in African cities has inspired more critical thought regarding minibus upgrading and hybrid systems, along with land-use interventions, rather than leapfrogging directly to BRT. According to their research, an alternative, more incremental approach to public transport reform may be advisable. 2.2.8 Digital Innovation The role of digital Innovation has become increasingly important in urban development and specifically mobility. Information and Communication Technologies – including the internet of things, sensor networks, machine-to-machine communication, robotics, artificial intelligence etc. – are influencing the emergence of smart cities, new mobility services, and the management of transport systems in cities and human settlements. Mobility as a Service (MaaS) is becoming popular as a concept as it integrates various transport services into a single mobility service accessible on demand. New mobility services offer the opportunity to increase the affordability and accessibility of goods and services and improve the overall quality of life of its 11 AFRICA URBAN MOBILITY OBSERVATORY – POLICY AND PLANNING INSIGHTS REPORT residents. They offer new ways for citizens to make mobility decisions and facilitate information flows between governments and citizens. As a result, local and national governments are increasingly integrating Information Communication Technologies (ICT) into planning and decision making. Examples include truck platooning and autonomous vehicles, Intelligent Transport Systems (ITS) supporting improved traffic management and coordinated use of transport networks, and increased use of shared mobility platforms (including bicycle and car sharing). The main objective of Public Transport digitalisation should be to encourage modal shift to sustainable urban mobility, by improving quality and convenience. Digitalisation can have a revolutionary impact on planning for public transport and NMT. In Nairobi, Kenya digital innovation was used to come up with a people-centred approach to the planning of the BRT corridors. The Digital Matatus project – carried out as a joint venture by the University of Nairobi, Massachusetts Institute of Technology (MIT), Columbia University, and Groupshot Design Consultancy – deployed mobile phones to create an open-source data set for Nairobi’s semi-formal bus system. The data, which were initially transformed into a popular paper map, are now searchable in Google Maps as a transit option, making it possible for anyone with a smartphone to navigate the city using a matatu (42). The project demonstrated that mobile technologies, particularly mobile phones, which are increasingly prevalent in developing countries, can indeed be used effectively to collect and deliver data in a modified GTFS (General Transit Feed Specification) format, for semi-formal transit (43). The survey results of the matatu routes (semi-formal buses) were then used to create proposed mass transit routes within the city, which were then integrated into the development of the proposed BRT scenarios. 2.2.9 Electrification of vehicle fleets Climate change, energy security and local air pollution are some of the key issues of the 21st century, particularly in hotspots of economic development, energy consumption and global greenhouse gas emissions. Electrification provides an opportunity for reshaping energy use, providing access for all, creating business opportunities and developing innovations that can make a direct contribution to a low-carbon development through e-mobility. Electrification should be viewed holistically in the transport system, by being addressed as an intermodal intervention that can assist in the wider transition to sustainable mobility. Successful implementation of e-mobility needs a collective focus on technologies, regulations, institutional settings, the economic system, interests, influence and power structures, behavioural patterns, and social norms of the respective locality. This approach ensures that e-mobility innovations are integrated with existing transport systems and networks and into the wider frameworks of Sustainable Urban Mobility Plans (SUMPs), local air quality plans and National Urban Mobility Programmes as well as business operations and industry development strategies. Under SOLUTIONSplus, UN-Habitat and the Urban Electric Mobility Initiative are supporting the electrification of two and three wheelers in Kigali (Rwanda) and Dar es Salaam (Tanzania). In addition to these two cities, there are other e-mobility interventions in Hanoi (Vietnam), Pasig (Philippines), Lalitpur/Kathmandu (Nepal), Quito (Ecuador), Montevideo (Uruguay), Madrid (Spain), Nanjing (China) and Hamburg (Germany). SOLUTIONSplus brings together highly committed cities, industry, research, implementing organisations and finance partners and establishes a global platform for shared, public and commercial e-mobility solutions to kick start the transition towards low-carbon urban mobility. SOLUTIONSplus is built on the premise that electrification of vehicle fleets that have traditional Internal Combustion Engines can accelerate transformational change towards sustainable urban mobility through innovative and integrated electric mobility solutions. The project supports demonstration actions in Kigali and Dar es Salaam on electric twoand three wheelers that are part of a shared fleets, also aiming at enhancing first- and last-mile connectivity to public transport. 2.2.10 Climate resilient transport Through the adoption of the 2030 Agenda for sustainable development and the sustainable development goals, the global community has set SDG 11 to “Make cities inclusive, safe, resilient and sustainable†and SDG 13 to “Take urgent action to combat climate change and its impactsâ€. According to the UN, global emissions of carbon dioxide (CO2) have increased by almost 50% since 1990 (44). Although greenhouse gas emissions were 12 AFRICA URBAN MOBILITY OBSERVATORY – POLICY AND PLANNING INSIGHTS REPORT projected to drop due to travel bans and economic slowdowns resulting from the COVID-19 pandemic, this improvement is only temporary. It has been observed that once the global economy begins to recover from the pandemic, emissions are expected to return to higher levels (45). To counter the rise in greenhouse gas emissions, there is a need to shift towards carbon neutrality. SDG 11 and SDG 13 provide a good approach to reducing carbon emission in cities and human settlements. SDG 13, Target 13.2 states, “Integrate climate change measures into national policies, strategies and planning†and 13.3 states, “Improve education, awareness-raising and human and institutional capacity on climate change mitigation, adaptation, impact reduction and early warningâ€. Within SDG 11, target 11.2 is to provide access to safe, affordable, accessible and sustainable transport systems for all, improving road safety, notably by expanding public transport, with special attention to the needs of those in vulnerable situations, women, children, persons with disabilities and older persons. Against these international frameworks, it becomes obvious that transport infrastructure and services have to be made resilient. Also, in case of a climate related hazard such as a flooding, public transport has to play a key role, as it has the potential to evacuate a city much faster than private transport. Bangladesh is one of the countries expected to be worst affected by Climate Change (46). The combination of frequent natural disasters, high population density and low resilience to economic shocks make Bangladesh highly vulnerable to climatic risks. Ensuring infrastructure is well-maintained, fit for purpose and able to withstand climate change impacts is one of the six pillars of the country’s Climate Change Action Plan. A lack of road infrastructure planning increases the risk of flooding and erosion, ultimately leading to waterlogging and sedimentation (47). Moreover, non-resilient infrastructure is more likely to be washed away by floods and other climate-induced hazards – as is the case in some of the AUMO cities (48). Cyclones and storms are the leading disaster types in Bangladesh, claiming 60% of total death counts due to disasters globally. Flooding is the second most damaging disaster, totalling almost 75% of natural hazard-related disasters affecting Bangladesh. Bangladesh aspires to achieve 100% readiness for disasters by year 2041, using the strategic guidelines provided by Bangladesh’s eighth Five-Year Plan (July 2020-June 2025) (49). This Five-Year Plan addresses strategies and specific objectives and targets for rural road development, operation, maintenance, and strategic priorities for rural road networks in Bangladesh. Bangladesh provides a good case for a government building better roads to create climate resilient transport sectors throughout the country. 2.2.11 Road safety innovation In recognition of the importance of road safety, United Nations (UN) Member States launched two Decades of Action for Road Safety (2011-2020 and 2021-2030) (50). Road safety is also recognised as important in the United Nations’ 2030 Agenda for Sustainable Development, which incorporates two explicit SDGs and associated targets (targets 3.6 and 11.2) on road safety (51). The underlying Safe System approach puts people at the centre and understands that people are fragile and will at times make mistakes that can lead to crashes. With that understanding, the road system pays attention to safe roads, vehicles, speeds, people and post-crash care (52). Making roads safe requires infrastructure, services and policy solutions. Public transport, cycle paths, sidewalks and crossings should be planned and built with the whole community in mind, not just drivers. Resources are needed for infrastructure and law enforcement, however road safety is also political. Often funds, data, and capacity for improvement projects are available to decision-makers, however there is little political capital in executing such projects. In a study carried out by the Overseas Development Institute (ODI) and the World Resources Institute (WRI) (to identify the challenges to improving road safety in low- and middle-income countries, learn from stories of progress, and provide a series of strategies that can help decision makers and practitioners working on road safety reform in Nairobi, Mumbai and Bogota), it was identified that in all three cities, pedestrians account for more than 50% of fatalities, with working-age males making up between 65% to 80% (53) (54). Complete streets that cater for pedestrians and cyclists are therefore a key road safety intervention on the continent. Regrettably, research conducted by World Health Organisation (WHO) indicates that Africa registers more road accidents when compared to the rest of the world, with 26.6 deaths per 100,000 population, as of 2018 13 AFRICA URBAN MOBILITY OBSERVATORY – POLICY AND PLANNING INSIGHTS REPORT (55). This is followed by Asia, with 20.7 deaths per 100,000 population. Europe and the United States of America are registering 9.3 and 15.6 deaths per 100,000 population, respectively. Digital technology and innovation can be used to advance road safety. Autonomous vehicles, including lane keep assist, smart traffic light and traffic control systems, artificial intelligence, the use of vehicle telematics and automotive technology can reduce the number of road accidents. Mobile network and fast data transmission solutions can be used to collect vehicle data to determine road conditions, as well to provide real-time weather information and warnings. Although valuable, advanced vehicle technologies such as these are not necessarily viable at scale in the LIC cities highlighted in this report due to the cost of new vehicles. DRC has complied with just two of 10 recommended UN Vehicle Safety Regulations, namely regulation of the importing of used vehicles and limiting the age of imported vehicles (56). An example of the successful adoption of roads safety technology, in 2013 Kinshasa (DRC) installed intelligent robot cops along its major roads, to improve pedestrian safety while crossing roads (57). These intelligent robots are equipped with cameras that can record incidents under all lighting conditions through infra-red technology (54). Road fatalities in South Africa are between 13,000 and 14,000 per annum (58). The main cause of these accidents is speeding. To address this challenge, the authorities have installed static and average speed detection cameras, issuing fines to those who exceed the speed limit (59) (54). 2.2.12 Bike share Schemes In recent years, the world has experienced a surge in bike share systems. Over 2,900 bike share systems are operational, ranging from station-based, dockless, to hybrid systems, both publicly and privately operated (60). While these systems have become popular in cities across Europe and North America, they have been less successful in Africa. Marrakech was the first African city to introduce a bike-sharing system, with the launch of Medina Bike at the COP22 meeting in 2016. Other Africa cities are following, such as Addis Ababa, which developed a bike sharing feasibility study in 2021 (61), and Kigali, which entered into a partnership with Guraride Rwanda (62). Cairo has also been planning a bike sharing system since 2017 (63). Bikeshare systems have transformed cities globally, as they offer the convenience of cycling, without the burden of ownership, as well as the flexibility of one-way trips (64). They have improved first- and last mile connectivity to public transport, and have proven to be a healthy, safe, zero carbon mode of transport. In recent years, electric bike sharing schemes have become a valuable alternative to lower the barrier to cycling further by improving comfort and access for different types of user groups (65). The electrified option could be particularly interesting for African cities with hilly topographies such as Kigali, where a start-up called Guraride is already working on a pilot e-bike initiative under the SOLUTIONSplus project. 2.2.13 Personal Safety Public transport services are an important gateway to access essential services and opportunities. Investment in safe and well-designed transport infrastructure can increase economic empowerment, by improving mobility and access to jobs, education and healthcare (66). However, the perceived and actual risk of violence and harassment on public transport systems can reduce especially women and girls’ freedom of movement and equal access to markets and services (66). Surveys have shown that passengers often experience threatening and unwelcome behaviour while using public transport. Crowded public transport systems can increase Gender Based Violence and Harassment (GBVH) risks due to close proximity between passengers, transitory environments, and anonymity. Women transport workers often experience high levels of violence and harassment by colleagues and supervisors, as well as the public, partly as transport is traditionally a male dominated sector, the work involves regular contact with the public, and workplaces are often mobile and isolated (67). In Kenya a toolkit for gender sensitive public minibus transport providers (Matatus), developed by UN-Habitat in partnership with the Flone Initiative, is used to train minibus operator and employees, and proposes to develop a Customer Service Charter to improve safety for women passengers (68). Details are provided about how to register a complaint, with their charter displayed in buses and bus stations (67). 14 AFRICA URBAN MOBILITY OBSERVATORY – POLICY AND PLANNING INSIGHTS REPORT Persons with disabilities include those who have long-term physical, mental, intellectual or sensory impairments. They experience various and different barriers, including access to the physical environment. The lack of inclusive mobility system can deny persons in vulnerable situations, including persons with disabilities, the opportunity to access school or university, jobs, health care services, and engage in public life. In Dakar, the Humanity and Inclusion’s program, which has run since 2014, has lobbied for increased access to employment for persons with disabilities, including by improving safe and accessible urban mobility (69). Successful engagement carried out by the program, in collaboration with local disabled persons’ organisations, public bus transport has gradually become more accessible to persons with disabilities. Dakar’s largest bus operator increased the number of buses with ramps and priority seats for persons with disabilities, and to train bus operator staff on the different needs of passengers with disabilities. The bus company hired 25 persons with disabilities to sell bus tickets (70). Another example is the Dar es Salaam BRT system, with universal design features at stations, such as at-grade crossings. 2.2.14 Transit-Oriented Development TOD is a recognised mechanism ensuring optimal reach of public transport by urban residents through land use planning. It is argued that TOD results in public transport being considerably more convenient, and can thereby minimise the reliance on private cars (71). Developing compact, mixed use, high density and walkable development around transit stations benefits not only ridership and financial viability of mass transit, but also ensures improved access to opportunities for urban residents (72). TOD approaches have been known to decrease CO2 emissions by up to 43%, and experience shows that private car use can be reduced by around 50% (73). Curitiba (Brazil) demonstrates how shifting an urban planning strategy from conventional layouts towards TOD, in which land-use and transport planning are integrated, can help to substantially reduce a city’s carbon footprint, while improving the quality of urban life (73). Successful TOD is reliant on an active role by government. In Curitiba, this was critical in establishing the direction of the TOD model through a Master Plan, which mapped the city’s transport planning and growth to discourage car use. In addition to mass transit infrastructure, the city managed to direct investments to expand the integrated transport network and build affordable housing. This was supported by regulations in relation to land use, building density and height (73). To implement successful TOD in African cities, the concept needs to be adapted to the local context and should be based on a thorough assessment of the spatial and socio-economic factors. There have been some TOD initiatives in Africa, such as the Corridors of Freedom in Johannesburg (74). In addition to the aim to reduce car dependency, South African cities are promoting TOD as a mechanism to overcome the deeply entrenched and widespread socio-spatial inequality of apartheid spatial planning (75). Although there were benefits to attempts at TOD in Johannesburg, there were challenges, such as limited confidence of private sector financiers and developers, due to inadequate, unreliable, and unsafe public transport. In addition, the TOD approach in South Africa did not adequately emphasise affordability, with a lack of subsidised housing provision around the stations (76). 2.3 Negative Mobility Pathways – and the need to end the “Car Focus†In view of the rapid urbanisation taking place in Africa, the continent’s cities are faced with various challenges. These include increasing levels of traffic congestion and associated GHG emissions, as well as air and noise pollution. Although transport policy in Africa is beginning to recognise the need for sustainable mobility, many cities are still heading towards a negative/unsustainable mobility pathway. They risk missing an opportunity to leapfrog towards more sustainable forms in which public transport is central to planning. Prioritising cars is costly and dangerous. It is estimated that traffic congestion costs cities such as Cairo as much as 4% of their national GDP (77). Some 650 people are killed each day in road accidents throughout Africa, making it one of the most dangerous continents in the world in terms of road safety (78). Although a large majority of trips in many African cities are taken on foot or bicycle by compulsion, rather than choice, little thought is given to NMT infrastructure, resulting in an unacceptable burden from road crashes. People, 15 AFRICA URBAN MOBILITY OBSERVATORY – POLICY AND PLANNING INSIGHTS REPORT particularly the poor, spend hours travelling to and from places of work. In Cape Town, many spend up to 43% of their income on transport (79). Public transport is often informal, unsafe and poorly managed. Having limited access to safe and convenient alternatives, people opt to shift to motorised transport and private cars as soon as their financial situation improves, thereby adding to the rapidly increasing motorisation rate in African cities (21). The majority of countries have below 50 passenger vehicles per 1,000 people and are therefore starting from a very low base (80). Sales of vehicles (new and used imports combined) are however growing at high rates, of around 10% per annum. While the modal share of private cars is currently low (for example only 13% in Nairobi), a lot of investment has been dedicated to car-focused infrastructure (81). This trend is in part due to transport infrastructure planning aimed at accommodating the ever-increasing numbers of cars, rather than focusing on accessibility. Global experience illustrates that this approach results in induced demand, attracting even more cars. While urban highways may temporarily relieve congestion, reduce travel times, and even decrease emissions, research has shown that over time they induce more demand for cars. According to the Institution for Transport and Development Policy (ITDP) (82), urban highways sacrifice liveable neighbourhoods to facilitate car traffic, and lead to growth that is ecologically and financially unsustainable, while subsidising sprawled development that destroys agricultural land and natural habitat, and encourage people to drive, worsening air pollution and risk of climate change. The negative impacts of urban highways have led many cities (particularly in high-income countries) to stop further development of highways, including American cities such as New York and San Francisco (82). Another example is in Seoul (South Korea), where the authorities opted to demolish a major highway and restore the Cheonggyecheon River, to improve the environmental quality of the downtown area. This transformation encouraged transit use and active mobility over private car use and is evidenced by a decrease of vehicle volumes by 45%, an increase of pedestrian activity by 76%, and bus and subway ridership by 18% between 2003 and 2008 (83). To date, unfortunately, many African cities, including those involved in this study, still follow this unsustainable pathway of car-oriented infrastructure. Over the last few years, various African cities constructed large scale infrastructure including expressways for cars, such as in Nairobi, Kampala and Cairo. These investments are often linked to large loans from external financiers, and are often not the most costeffective, equitable or sustainable solution available. Figure 3: Passenger Capacity of different types of roads (39) 16 AFRICA URBAN MOBILITY OBSERVATORY – POLICY AND PLANNING INSIGHTS REPORT Evidence from cities on the African continent indicates that highway development, combined with inadequate development control and land-use planning, along with high demand for housing, has led to low density cities and metropolitan regions, generating increased demand for cars (41). Nairobi is currently constructing a Sh62-billion expressway in its city centre, and the designs have limited considerations of Mass Rapid Transit and NMT. Critics worry that it will not achieve the intended goals of decongestion (84), as has been seen with the earlier Thika Highway, which is already traffic-choked after a few years of implementation. Also in Cairo, the government is building expressways at a large scale to link the new cities to the city centre. According to The Economist (85), the transport minister announced in August 2020, that “130bn Egyptian pounds ($8.3bn) had been allocated to complete 1,000 bridges and tunnels by 2024â€. However, the history of Cairo’s transport planning reveals that highways are not going to solve the congestion issue, but rather what is required is an efficient and integrated mass rapid transit system. 17 AFRICA URBAN MOBILITY OBSERVATORY – POLICY AND PLANNING INSIGHTS REPORT 3. Blantyre, Malawi Malawi has a population of approximately 19.1 million, across an area of around 94,280 square kilometres (86). The population is largely rural but the rate of urbanisation in cities and town centres is growing at an estimated rate of 5.2% per annum. There are four main cities, they are Lilongwe, Blantyre, Mzuzu and Zomba. According to the World Bank, Gross National Income (GNI) per capita was $580 in 2020, one of the lowest per capita income levels in the world (87). As a landlocked agrarian country with a high concentration in a small number of primary products, the economy lacks diversification. The status quo makes it particularly vulnerable to fluctuating terms of trade. The country is also poorly integrated in the region, both in terms of trade and physical infrastructure (88). A contributing factor to the mobility investment landscape is the fact that the economy is currently at a recovery stage after a major recession in 2013. In addition to the world economic downturn, unfavourable weather conditions (which affect agricultural production) has impacted macroeconomic growth (World Bank, 2016). There are a number of other factors affecting the growth of Malawi. Business is adversely impacted by the high-interest rates and the high cost of utilities. The power and infrastructure deficit severely affects productivity. These limitations have limited economic growth (World Bank, 2016). 3.1 National Policy frameworks Urban governance and management in Malawi have been shaped by development policy and interaction with international urban players (89). The National Planning Commission (NPC) is responsible for urban planning. Established through an Act of Parliament in 2017, the NPC coordinates the development of long- and medium-term national development plans for Malawi and oversees the implementation of those plans. The NPC is a corporate body with perpetual succession, and a separate legal entity from that of the Central Government. The NPC comprises of a Board with a Chairperson appointed by the President. The Commission facilitated the development and launch of the Malawi 2063 (MW2063) Vision. MW2063 aims to transform Malawi into an inclusively wealthy and self-reliant industrialised upper middle-income country by the year 2063. The NPC issued its first Strategic Plan in 2021 (90). The main transport agency is the Ministry of Transport and Public Works (MoTPW). Along with MoTPW subagencies and departments, other external agencies such as the Directorate of Road Traffic and Safety Services (DRTSS), the Malawi Roads Authority, development partners, district and city councils, and the private sector are involved in the planning and operation of the sector. Until recently, there was a strong centralisation of local decision-making within the Malawi government. Malawi is now in a process of decentralisation (89). Ninety percent of goods and 70% of passengers in Malawi are transported by road (91). National data provided by the NTMP reveals that of the 8.7% of national road network classified as urban, 26% of this network is paved (92). 82% of the paved road network is in good or fair condition but there is also a large number of unclassified roads. The Roads Authority is responsible for the management of the main, secondary and tertiary roads while local authorities are responsible for the management of district and urban roads within their jurisdictions. However, due to capacity challenges in most local authorities, the management of district and urban roads is currently being supported by the Roads Authority (92). Mobility Policy and Planning is coordinated at a national level. The national transport policy framework is guided by the National Transport Policy (NTP) and the National Transport Master Plan (NTMP). These two documents are the main policy levers in transport decision making. In February 2016, the Government of Malawi commissioned WS Atkins, a British multinational engineering, design, planning, architectural design, project management and consulting services company to carry out a study and prepare a National Transport Master Plan (NTMP). The NTMP guides the development of an integrated multimodal transport sector over the period 2017-2037 (92). Three strategic objectives have been set to support the vision and guide the development of the NTMP. They are: 18 AFRICA URBAN MOBILITY OBSERVATORY – POLICY AND PLANNING INSIGHTS REPORT • Make transportation costs affordable in all modes; • Improve mobility safety through the provision of transport infrastructure and services; • Guide passenger and freight transport into an improved and sustainable system. In 2019, the Government of Malawi revised the NTP to improve the transport sector as directed by the Malawi Growth and Development Strategy (MGDS) III. The NTP aims to “ensure the development of a coordinated and efficient transport system that fosters the safe and competitive operation of viable, affordable, equitable and sustainable transport and infrastructure services†(93). The policy is designed to encourage the development of strategies to increase private sector participation. It provides opportunities for different stakeholders to contribute to development in the provision, management and operation of the country's infrastructure and services (93). In terms of urban transport the policy has five main strategies: • Improve urban road network; • Incorporate NMT standards for infrastructure development, as well as increase NMT new infrastructure; • Enhance institutional capacity by establishing Urban Areas Transport Authorities; • Ensure suitable urban planning together with management in urban transport; • The provision of private transport services in all modes in an efficient and equitable manner. The government should ensure a policy framework that guides, regulates, and supervises the transport sector. According to MoTPW, the current problems surrounding the institutional framework of the transport sector in the country are irregular or corrupt practices, centralisation of local decisions; gaps in funding, organisational capacity, technical and management skills, and strategic planning and programming competencies as well as limited joint work. There is also limited information sharing and joint policy formulation. The key issues surrounding the urban transport system are: • Daily commuting by road users poses a safety hazard as there are limitations in road maintenance and road design standards. This also affects the coverage of minibus services as there are many roads that are inaccessible; • There is heavy congestion at peak hours due to lack of road capacity in certain areas; • Public transportation consists mainly of unregulated bus routes. This affects the coverage and quality of service throughout the urban area; • Unregulated minibus fares mean that users have fares that vary according to demand; • Through traffic and local traffic in the city are mixed due to the lack of bypasses or relief roads, causing congestion and traffic accidents; • NMT does not yet have adequate infrastructure especially for pedestrians, which discourages the development of urban micro-urban mobility. The Government of Malawi allocates an average of approximately US$41 million to the transport sector a year. Most of these funds are dedicated to the road sector (91). For the financial year 2020/21 some of the funds were specifically set aside for Information technology and communication in the transport sector. Japan International Cooperation Agency (JICA) estimates that in order for the NTMP to be successfully implemented over the next twenty years, the contributions need to amount to approximately US$137 million. The major development partners in the transport sector are the World Bank, the African Development Bank, the European Investment Bank and the Japan International Cooperation Agency. China has contributed to the sector as well as the Organisation of the Petroleum Exporting (OPEC) Fund, Arab Bank for Economic Development in Africa (BADEA), Saudi Fund and Kuwait Fund. Malawi was part of the World Bank supported Sub-Saharan Road Maintenance Initiative (RMI) which was launched to facilitate policy and institutional reforms that could result in sustainable management and financing of public road services. In response to the findings and recommendations of the RMI, the National Roads Authority Act in was enacted 1998. It created the National Roads Authority (NRA), an autonomous body to manage the public road network – and a dedicated Roads Fund, managed by the NRA itself. The NRA was governed by a Board with a majority of private sector representatives which was reporting to the 19 AFRICA URBAN MOBILITY OBSERVATORY – POLICY AND PLANNING INSIGHTS REPORT Ministry of Transport. In 2006 NRA was reformed to address the organisational weaknesses. The National Roads Authority Act was repealed, and two pieces of legislation replaced it. The RFA (Road Fund Administration) was established by the Roads Fund Administration Act No.4 of 2006. It is responsible for raising, administering funds for road construction and maintenance. The Act was enacted to separate implementation functions from the financing functions. Malawi faces some constraints in conducting large-scale surveys or data analysis exercises. This limits the capacity of decision makers at national and local levels to establish and implement policies in a coherent and coordinated manner. The NTMP seeks to address the challenges through improvement of the institutional framework and the creation of the National Transport Committee. It aims to strengthen the MoTPW to include data collection, storage and analysis functions for transport monitoring, research and technology (92). The NTP aims to establish the necessary environment to move from a tightly controlled transport sector towards a more liberal market-orientation (93), in which private participation is encouraged to provide transport services to the general public. Just as NTMP seeks to encourage public transportation with the development of a strong mass transit network. The mass public transport proposal is to equip the system with BRT and larger buses with exclusive lanes. It is expected that these interventions will reduce travel times, cost per passenger, make more efficient use of road space, and pursue fuel efficiency and air quality (92). Although Malawi actively engages in planning – including the development of master plans that provide an overview of spatial and infrastructural intentions – the plans are often not recognised by the public in urban jurisdictions, and often lack effective implementation mechanisms (94) . 3.1.1 Climate Change and air quality Malawi is particularly vulnerable to floods, droughts, and strong winds associated with tropical cyclones. The country has recently experienced unprecedented floods and droughts (95). In response, Malawi has developed Nationally Appropriate Mitigation Actions (NAMAs), a National Climate Change Response Framework (NCCRF) and National Adaptation Plans (NAPs). The environment and climate change are integrated into socio-economic development policies through MGDS III and Malawi 2063. Emissions from fossil fuel use in transport accounted for 11% of the total CO2 emissions in 2017 (95). Compared to other countries within the region, Malawi has very low per capita emissions attributed predominantly to the agricultural economy and relatively low fossil fuel consumption rates (95). However, emissions in energy use are expected to rise significantly in the next few years. 20 AFRICA URBAN MOBILITY OBSERVATORY – POLICY AND PLANNING INSIGHTS REPORT Table 3: Transport measures in Malawi NDC Implementation Plan (Malawi Updated NDC July 2021) NDC Measure Line Ministry (focal point) Adaptation and Resilience Co-benefits Modal shift: private to passenger transport Increasing the share of passenger transport from around 10% at present to around 30% in 2040, reducing GHG emissions from gasoline and diesel use. MOTPW, MOLG (Department of Road Traffic and Safety Services) Increased resilience of transport infrastructure. Improved health and reduction of harmful local air pollutants, enhancing resilience of population to disease and adverse climate impacts. Modal shift: road to rail freight Increased use of rail under the National Transport Master Plan, resulting in reduced diesel consumptions and GHG emissions from road freight transport. MOTPW (Department of Rail and Public Transport) Increased resilience of transport infrastructure. Improved health and reduction of harmful local air pollutants, enhancing resilience of population to disease and adverse climate impacts. Increasing ethanol blending with gasoline as a transportation fuel Achieving an average national blend rate of 20% ethanol, resulting in reduced GHG emissions from gasoline consumption in road transport. MOTPW, MOE (Department of Energy Affairs) Decreased dependence on imported fossil fuel energy products. Improved health and reduction of harmful local air pollutants, enhancing resilience of population to disease and adverse climate impacts. Blending biodiesel with diesel as a transportation fuel Commercial production of biodiesel fuel reaching 55 million litres and resulting in reduced GHG emissions from diesel consumption in road transport. MOTPW, MOE (Department of Energy Affairs) Decreased dependence on imported fossil fuel energy products. Improved health and reduction of harmful local air pollutants, enhancing resilience of population to disease and adverse climate impacts. The NTMP emphasises that transportation data should include climate change considerations by working in concert with relevant agencies and explicitly reporting on climate variables (92). The NTMP estimates investments and planning for climate change adaptation and mitigation activities. The mitigation of climate change by the transport sector relies greatly in the strategy of promoting intramodality between NMT and low-carbon public transport. For this strategy, the NTMP refers to the extension of the road network including infrastructure with adequate standards for the NMT. Among the NTMP´s proposals for NMT are cycle paths, public transport cycles, bike sharing, bicycle commuting campaigns, pedestrian facilities, footways, curb ramps, adequate crossings, and pedestrian priority measures. In 2019, Malawi introduced carbon tax on local and foreign motor vehicles (96). The main sources of air pollution in southern Africa include industry, forest/savannah fires, biomass burning, waste burning and transportation emissions (97). The Environment Management Act, (No. 19 of 2017), which repeals the 1996 legislation, prescribes environmental quality standards that pertain to air quality and contains regulations on air pollution. It makes provision for criteria and procedures for the measurement of air quality and the development of emission standards for various sources. 3.1.2 Accessibility and Safety Malawi is one of the 10 worst countries globally in terms of road traffic fatalities (98). In 2016, the estimated annual number of road traffic fatalities was 31 per 100,000 inhabitants. Fifty percent were pedestrians and 19% cyclists or riders of motorised 2- and 3-wheeled vehicles. Malawi has not signed and ratified the African Road Safety Charter, but does have some localised policy levers dedicated to ensuring safer streets. The National Road Safety Council of Malawi (NRSCM) collects data on road fatalities. However, the database has been cited as being unreliable due to significant underreporting. Those who die enroute and upon arrival at hospitals are not reported, together with other cases where the police are not directly involved (99). In a workshop with local and national officials from Blantyre, stakeholders indicated that it is often a challenge to find reliable information on road fatalities and injuries. 21 AFRICA URBAN MOBILITY OBSERVATORY – POLICY AND PLANNING INSIGHTS REPORT The Directorate of Road Traffic and Safety Services (DRTSS) is an arm of the Ministry of Transport and Public Works established by an act of parliament, Road Traffic Act 1997. DRTSS is responsible for the regulation of the road transport industry through traffic law enforcement, development of polices, standards and practices; and provide civic education on road safety to all road users. Malawi has ratified the Convention on the Rights of Persons with Disabilities (CRPD). Further, 83.3% of legal frameworks that promote, enforce and monitor gender equality with a focus on violence against women are in place (100). The NTP echoes its sentiments and outlines the need to improve social inclusion. The text includes explicit consideration of minorities of gender, age, ability, ethnicity and social class. The NTP recognises that it is essential that collective and specific measures be adopted to meet the needs of the various social groups (92). Despite long standing policy directives, access to public transport remains a challenge, especially for poor women and those with disabilities (66). There is also a lack of comparable methodologies and regular monitoring for issues related to physical and sexual harassment (92). 3.2 Blantyre Mobility Landscape Blantyre, the city selected for this study is one of the four main cities of Malawi located in the Shire Highlands. It has a population of 800,264, with a growth rate of 2.0%, and a density of 3,334 per km2 (101) The city is one of Malawi's commercial and industrial centres, which, together with Lilongwe, contributes to 31% of the national GDP (92). As one of the two largest urban centres, Blantyre offers many work opportunities. Employment is driven by the core private sector (42%) and the self-employed (36%) (92). Currently the city lacks the capacity to meaningfully implement its strategies and provide the necessary basic social infrastructure and urban services required for economic development. Over 65% of the population lives in informal settlements, which occupy about 23% of the land in Blantyre (101). The city has been built up rapidly in a manner that is comparable to other African cities, including the Dakar metropolitan area in Senegal, Nairobi city in Kenya, and Harare city in Zimbabwe (94). Land in Blantyre is owned by the central government, the Malawi Housing Corporation (MHC), the private sector, and the Blantyre City Council is for commercial development, and the rest is residential, of which 42% is planned residential area, 22% is unplanned, and 20% is rural (92). Only the middle and upper-income classes have access to serviced land for housing (102). Blantyre has a participatory and democratic system of governance. Councillors are elected by city residents while the mayor is elected from among the councillors. The Blantyre City Council is mandated to govern the City of Blantyre and provide municipal services in tandem with the Local Government Act (2010). Blantyre's mobility planning and policy is framed by the 2017-2037 Master Plan (92). The city is yet to develop a local strategy parallel to the national transport goals. However, the main interventions of the NTMP specified for Blantyre are: • Maintenance of the road network; • Introduction of new roads; ï‚š Blantyre Inner relief Road, a two-lane new road of 10 km; ï‚š Blantyre elevated expressway, a new of 8 km above and existing highway; • Introduction of segregated Non-Motorised Transport (NMT) lanes to protect active mobility. In a study conducted in 2011, it was noted that some of the major challenges facing governance in Blantyre included a lack of security of tenure and land governance, capacity gaps, corruption as well as lack of transparency, paired with low revenue collection (102). Great strides have been taken to address some these challenges in recent years. The Blantyre City Council has worked closely with The Tilitonse Foundation and other stakeholders to develop a Service Charter for the city (103). The Charter is “a social pact between Blantyre City Council and City residents to improve accountability and efficiency of service delivery.†The Service Charter includes some transport related commitments from local authorities. For example, the council ensures that damaged streetlights and traffic signs are replaced within 48 hours, and potholes, and 22 AFRICA URBAN MOBILITY OBSERVATORY – POLICY AND PLANNING INSIGHTS REPORT other related damages, are repaired within seven days of appearing (103). The city also has a set of by-laws that regulate street vending (104). 3.2.1 Urban Mobility Trajectory According to MoTPW, NMT is the major mode in all urban areas, where walking is the predominant mode. Walking trips range from 0.39 to 0.54 trips per person per day, and big buses serve inter-district routes (92). Regarding motorised transport, it is observed that minibuses fulfil an important role as a form of informal paratransit, with a share of approximately 28% of all motorised trips. Private car use is limited, with a mode share of just 1%. Other supplementary modes are, sedan taxis (both formal and informal), three-wheeler taxis, motorcycle taxis, bicycle taxis, and pickup trucks (92). It is anticipated that the Chinese government will provide loans for the construction of a 97 km bypass road in Blantyre City. The project is expected to cost US$41 million for the first phase (35.6 km). The project, which passes through a number of trade centres, will be supported by Government of Malawi funding (91). The average peak hour traffic speed observed in the Central Business District (CBD) area of Blantyre records approximately 19 km/h (12 mph) (92). It is understood that users and the urban economy are affected by such low speeds. However, to measure the exact impacts of road congestion in detail, data collection is needed. While there are some challenges, since 2019, Local Governments for Sustainability (ICLEI) Africa’s Reflecting Cities project has supported dialogue between national and local government stakeholders in Malawi, to understand transport challenges in Blantyre and Lilongwe. ICLEI co-produced sustainability roadmaps with Blantyre so that all lessons could be institutionalised at a city level. The “Keep Blantyre Clean and Green†initiative aims to turn Blantyre into a green and clean city. The campaign has attracted significant funding. Petroleum Importers Limited, for example, donated K10 million to line the streets with bins (105). According to the City Council’s website, under that campaign, almost all traffic circles in the city have been adopted by the corporate citizens. The traffic circle adopters, in accordance with a Memorandum of Understanding signed with the Council, have the responsibility of taking care of them, together with the surrounding 50 m stretch of the roads leading to them, in exchange for the right to erect and display advertisements. Table 4: Summary of Urban Mobility Actions in Blantyre Mobility Action General Status Activity Although Malawi actively engages in planning—including the development of master plans that provide an overview of spatial and infrastructural intentions—the plans are often not recognised by the public in urban jurisdictions and often lack effective implementation mechanisms. There has been a significant loss of green spaces due to unplanned settlements and illegal developments. These unplanned settlements are prone to multiple hazards such as floods and landslides, which have increased in frequency and intensity in recent years. Road infrastructure in Blantyre, especially on the urban periphery in low-income areas is of poor quality. Plans are underway for the construction of a new Blantyre bus terminal and passenger rail services are also being investigated. However, at present, accessibility to public transport remains low in Blantyre at 15.38%. Safety Malawi has a lead road safety agency. The Directorate of Road Traffic and Safety Services, which operates under the Ministry of Transport and Public Works is funded in the national budget. There is a road safety strategy which is partially funded. However, road fatalities remain unacceptably high. Many minibus taxis are unroadworthy and unsafe, contributing to the unacceptably high number of fatalities in Malawi. There is also very little compliance to the UN Vehicle Safety Regulations. 23 AFRICA URBAN MOBILITY OBSERVATORY – POLICY AND PLANNING INSIGHTS REPORT Mobility Action General Status Structure Despite NMT modes being dominant, there is a general lack of NMT facilities in Blantyre, resulting in unsafe mixing of pedestrians and motorised traffic. Paratransit users in Blantyre who are in fact “choice users†rather than “captive usersâ€. However, the few paratransit and minibus facilities that do exist are in poor condition, and lack pedestrian infrastructure, shelter, or seating. As there is no regulation of fares, queue marshals often have the power to dictate fares drivers may charge and they are usually late. Fuels and vehicles Malawi is Africa’s second country to adopt carbon tax, however, the impact is unclear. The country’s NDC (Nationally Determined Contributions) also indicates an intention to use biodiesel technologies in order to meet emission targets. Malawi imposes no restrictions on used vehicle imports, with the average age of imported used petrol and diesel vehicles being nine years and 18 years respectively. There are also no vehicle emission standards. The NTMP estimates that by 2025 50% of new vehicles manufactured globally will be electric however, electricity in Blantyre is expensive and unreliable, with frequent power outages. 3.2.2 Barriers to Sustainable Mobility Solutions There are a number of barriers to sustainable mobility policy implementation in Blantyre. According to MoTPW, the key issues for road transport infrastructure include lack of road coverage in some areas and lack of all-weather road capacity. There is also limited capacity of relevant organisations to adequately design, manage and implement transportation infrastructure. During one-to-one consultation with both local and national government authorities involved in the AUMO project, the following challenges were outlined: • Rising urban poverty; • Minibus taxis are inconvenient and lack dedicated patterns of movement; • People are more comfortable using private vehicles; • Lack of reliable evidence to inform infrastructure planning; • Cities are inaccessible to pedestrians and cyclists; • Vehicle congestion; • Misconception that adding more roads will solve congestion challenges; • Need for capacity development; • Lack of collated data sources; • Available data contains averages. It does not have the level of granularity required to support holistic decision making; • Weak enforcement of laws; • Cities are not compact; • People living in “townships†have to travel very long distances to conveniently access goods and services; • Unplanned settlements; • Lack of transparency in data availability. 3.2.3 Recommendations and Insights Although there are a number of actions that have been taken by both the national and local authorities in Malawi and Blantyre respectively including the development of comprehensive visioning documents, policies that drive sustainable transport, a carbon tax and efforts to improve road safety, there are some urgent gaps that need to be filled in order to ensure a sustainable mobility pathway. Beyond the policy recommendations elaborated on in Deliverable 4, the following non-exhaustive list includes some actions that could strengthen the pathway to sustainable urban mobility together with a greater focus on transit-oriented development: Develop a city level action plan in line with the NTMP 24 AFRICA URBAN MOBILITY OBSERVATORY – POLICY AND PLANNING INSIGHTS REPORT Institutional structures, policy continuity, and implementation are vital aspects of low carbon mobility (1). Blantyre is yet to tailor its own path towards sustainable mobility in the frame of the national vision. In the national scope, the limited coordination with relevant government agencies and related limited in-house capacity is one of the main challenges faced by MoTPW in providing sustainable mobility. The NTMP addresses cross-cutting transportation issues in terms of physical infrastructure improvements as well as necessary changes in the regulatory, policy, and institutional framework. According to the Ministry of Transport and Public Works, the plan seeks to promote a transport system that can be resilient to current and future challenges, a major one being climate change (92). Improve conditions for people that walk and cycle Despite the fact that non-motorised transport is the primary mode in all urban areas, Blantyre does not provide effective infrastructure to support this mode. As mentioned above the urban transport mode share is predominantly driven by walking. Dedicating clear responsibilities for NMT infrastructure within the transport department might accelerate efforts on NMT. Improve data collection processes and ensure transparency The lack of transparency in data availability and the challenges in collecting detailed data make it difficult to ensure inclusive and comprehensive policies and action plans. A comprehensive data collection strategy that connects different government agencies and ensures the flow of information from one to another would enable better and more sustainable decision-making processes. This data could be used to identify priority areas of investment. Furthermore, data collection that specifically focus on paratransit will identify the gaps and opaque mobility needs that are being addressed by minibus taxis. Develop a traffic management system Proper traffic management can ensure fair access for different transport modes. It can also encourage more sustainable modes, assist with traffic flow and ensure that streets are safe for all users including pedestrians and cyclists. 25 AFRICA URBAN MOBILITY OBSERVATORY – POLICY AND PLANNING INSIGHTS REPORT 4. Gaborone, Botswana Botswana has an estimated population of 2.254 million, comprising 1.088 million males and 1.166 million females, spread over 581,730 km2 (106). Botswana is rapidly urbanising. In 2011, 64% of the population lived in urban areas. This is projected to reach 80% by 2026 (106). Approximately 25% of the land in Botswana is set aside for conservation (107). Diamonds are the mainstay of the Botswanan economy, and the country possesses a number of natural resources (107). Earnings from minerals and customs and excise revenue accounted for over 50% of government revenues in the 2020/2021 national budget (106). Vision 2036 emphasises a desire to move away from resource driven growth to a future where growth is based on high productivity, innovation and competitiveness (107). The Southern African country has transformed itself from one of the world’s poorest countries into an uppermiddle-income country. However, it remains one of the 10 most unequal countries in the world (106). An exogenous variable in urban and mobility planning is high levels of poverty. While poverty rates have fallen in recent years, levels are still high. 4.1 National Policy Frameworks In Botswana, sectoral policies align with overarching national policy. In 2015, The Ministry of Presidential Affairs and Public Administration led the development of “Vision 2036: Achieving Prosperity for all†with a Presidential Task Team together with the National Strategy office and the Botswana Institute for Development Policy Analysis (107). It aims to transform Botswana from an upper middle-income country to a high-income country by 2036 and is focused on economic prosperity. The vision aligns with the national and global agenda for sustainable development as well as the principles of Africa 2063. The delivery of the vision is guided by the National Transformation Strategy (NTS). National Development Plans, including District and Urban Development plans are the vehicles for executing the NTS. Botswana is currently implementing National Development Plan (NDP) 11, 2017 – 2023 (108). NDP 11 focuses on six broad-based national priorities: • Developing Diversified Sources of Economic Growth; • Human Capital Development; • Social Development; • Sustainable Use of Natural Resources; • Consolidation of Good Governance and Strengthening of National Security; • Implementation of an Effective Monitoring and Evaluation System. 26 AFRICA URBAN MOBILITY OBSERVATORY – POLICY AND PLANNING INSIGHTS REPORT Figure 4: Pillar 3 of the Botswana Vision 2036 (Sustainable Environment) According to Vision 2036, Infrastructure goals are geared towards diversification of the economy and international trade opportunities as well as supporting the micro and small enterprise community. In terms of transport, generally, national goals are tied to logistics services and ambitions are geared towards Botswana acting as a regional corridor (107). According to Statistics Botswana, in 2020, the total road network measured 32,563 km. Of this length,18,507 km (56.8%) was under the care of the Central Government while 14,056 km (43.2%) was managed by Local authorities (109). The government has initiated several studies under the Botswana Integrated Transport Project (BITP). The project seeks to modernise and improve the transport system, to enhance mobility within the country and the Southern African Development Community (SADC) region. As part of this World Bank project, the Greater Gaborone Multi Modal Transport Study was conducted and completed in 2011. The aim of this study was to formulate a transport plan for Gaborone for the next 24 years, to improve mobility and reduce traffic congestion (110). 27 AFRICA URBAN MOBILITY OBSERVATORY – POLICY AND PLANNING INSIGHTS REPORT Several of the major cities in Botswana lack an integrated, multimodal transportation network that accommodates dedicated lanes for public transport vehicles and provision of cycle tracks, tram lanes and pedestrian walkways. Further, public transport is unreliable and inefficient (110). The Ministry of Transport and Communications manages the transport mandate in Botswana. It was established to drive the development and utilisation of ICT and integrated transport services in Botswana. The Ministry is charged with providing a safe, secure and accessible Transport and Communication infrastructure as well as reliable, affordable and sustainable Transport and Communications services (111). The Ministry is comprised of the following departments: • Department of Road Transport and Safety; • Department of Information Technology; • Department of Roads; • Central Transport Organisation; • Department of Telecommunications and Postal Services; • Botswana Integrated Transport Project; • Directorate of Accident Investigation; • Corporate Services. The Department of Road Transport and Safety is responsible for the provision of an efficient road safety transport system in Botswana. It regulates road transport through policy formulation and implementation of the Road Traffic Act and Road Transport Permit Act. The Department of Roads is responsible for road infrastructure. During the implementation period of NDP 10, a Draft National Integrated Transport Policy was developed with planned implementation during Plan 11 (108). A number of roads where designed, constructed and completed during this period too. Like in many other countries, the COVID-19 pandemic strained government revenues and spending (106). Vision 2036 emphasises the role of information and communication technology and its role as an enabler of efficient service delivery. The document includes ambitions to improve and enable digital access through developing the relevant regulatory frameworks (107). Although NDP 10 included significant investment in ICT, many parts of the country are without mobile connectivity (108). Both the ICT and transport sectors are currently undergoing sector reforms through revised policies, legal and regulatory frameworks to adapt to trends in technology and services (108). 28 AFRICA URBAN MOBILITY OBSERVATORY – POLICY AND PLANNING INSIGHTS REPORT Figure 5: Pillar 1 of the Botswana Vision 2036 (Sustainable Economy) 4.1.1 Climate change and air quality Climate-driven aridity is adversely affecting Botswana’s water resources and thus livelihoods, agriculture, ecotourism activities, public health, and the cost of doing business (106). Renewable energy innovations are limited by funding, existing policy frameworks, technical capacities, and research and development. On a policy level, Botswana has committed to enhancing energy efficiency and minimising the emission of greenhouse gases (107). Up until recently, mainstreaming of climate change in policies and plans was lagging due to a lack of technical capacity and expertise (110).However, the government has put forward a number of technical and policy interventions in an Integrated Transport Policy (106). The Botswana National Climate Change Strategy, developed in 2018 with support from UNDP, identifies transport as a key mitigation sector. The strategy outlines the need to reduce the prevalence of private motorised vehicles, increase public and multi-modal transport, enable fuel-switching, and improve fuelefficiency as well as streamlining climate resilience into transport infrastructure (112). One of the strategies includes developing an Integrated Public Transport Network (IPTN) framework and plan for Botswana’s three most populated cities, including a focus on safety, operational standards and options for regularising and 29 AFRICA URBAN MOBILITY OBSERVATORY – POLICY AND PLANNING INSIGHTS REPORT formalising informal public transportation if feasible. The text includes aims to lower GHGs emissions within the transport sector though a relevant taxation system based on GHG emissions by vehicle and use (112). Air pollution in urban areas is an increasing concern. Traffic management techniques have evolved in tandem with the shifts in people’s behaviours and numbers of motor vehicles. As a result, traffic congestion continues to affect air quality, mobility, and physical space in areas such as Gaborone and Francistown (106). Air pollution is regulated under the Atmospheric Pollution Prevention Act but to date, Botswana imposes no restrictions on used vehicle imports, and the average age of imported used vehicles is unknown. The integration of pollution mitigating measures forms part of the National Development Plans (110). It is also emphasised in the National Climate Change strategy that Botswana aims to operationalise an Air Quality Monitoring System (AQMS) in locations of heavy transport activities (112). 4.1.2 Accessibility and Safety Although performing better than most African countries, the latest WHO Global Status Report on Road Safety indicates that Botswana has a recorded death rate of 20.1 per 100,000 population as against the global death rate of 17.4 per 100,000 population (113). Pedestrian casualties in 2020 were 977, a 26.1% decrease from 1,322 casualties in 2019 (109). In 2020, the number of accidents per 1,000 vehicles went down from 31.6 in 2019 to 26.0 (109), however, it is unclear at this stage what the contributing factors are for the decline. The National Road Safety Committee (NRSC), which is funded in the national budget has a road safety strategy which is fully funded (114). During NDP 10, The Road Traffic Act was reviewed. Fines for offending motorists were raised in an attempt to address issues such as drunken driving and violation of speed limits (108). There were some other initiatives planned around vehicle inspections and what is referred to as “children’s traffic schoolsâ€, but due to limited resources, several projects were shelved (108). Botswana has also not signed and ratified the African Road Safety Charter. In terms of safety from crime and sexual harassment, in 2020, Botswana had the second highest number of rape cases in the world, at 92.9 per hundred thousand people (115). According to an analysis conducted by the United Nations in partnership with the government of Botswana, gender inequality is pervasive and deeprooted (106). A survey conducted in 2012 indicated that 6% of women had at that time experienced sexual harassment while using public transport (66). When it comes to accessibility more generally, Botswana is working towards achieving a future where people living with disabilities, the elderly and other marginalised groups will have equal access to services and socioeconomic opportunities (107). However, Botswana has not signed and ratified the Convention on the Rights of Persons with Disabilities nor other similar international treaties. It also does not have any disability specific legislation and individuals with disabilities face significant transport barriers (116). 4.2 Gaborone Mobility Landscape: Gaborone is both the largest and Capital city of Botswana, with 11.6% of the population living here. The city has a population of 231,626 people with a density of 1,400 per km2 (108). Expansion of the city is limited due to its geographical position. The Gaborone City Development Plan indicates that “Gaborone City is helmed in, with no available land for future spatial expansionary needs of the city.†As a result, development plans are geared towards optimising the use of available land to meet existing and future needs of the city (117). The city is the economic hub of Botswana. In 2009, government spending in Gaborone was estimated at 40% of the Gross Domestic Product (GPD) (117). The Ministry of Local Government and Rural Development oversees 16 local authorities and semiautonomous local authorities, categorised into City, Town and District Councils, inclusive of tribal administrations. The Department of Local Government Technical Services provides technical advice to local authorities on matters related to the development of infrastructure. The Gaborone City Council (GCC) is an autonomous government agency that operates within this framework (108). Comprised of Councillors who are elected after every five years, and headed by the Mayor, GCC is responsible for maintenance of local roads and streetlights, amongst other things. GCC is active on social media and updates citizens via a Facebook page (118). 30 AFRICA URBAN MOBILITY OBSERVATORY – POLICY AND PLANNING INSIGHTS REPORT 4.2.1 Urban Mobility Trajectory In 2020, the total road network maintained by Local Authorities was 14,056 km. This is a 3.3% increase from the 13,608 km in 2019. Local Authorities are in charge of access roads (10 km total) and all the internal roads (109). According to the Ministry of Local Government and Rural Development, Gaborone has 41 km of earth roads, 153 km of gravel, 445 km tar and 22 km comprised of interlocking bricks (totalling 660 km in 2020). The City Council has recently undertaken several projects to lay asphalt and reconstruct a bus rank, and there are ambitions to continue working on road infrastructure projects in the city until June 2022 (118). The South East Regional Master Plan (SERMP) is the guiding document for spatial and economic developments within the area covering the urban districts of Gaborone, Lobatse and Jwaneng and the rural districts of Southern, Kweneng, South East and Kgatleng. The National Settlement Policy (NSP) provides a framework to guide equitable distribution of investments to ensure balanced development across the country. It was introduced to counteract the bias of investments to particular towns and cities like Gaborone (117). Rapid urbanisation is a significant challenge for urban governance strategies (106). The Gaborone City Development Plan (1997 – 2021), prepared for the Department of Town and Regional Planning and Gaborone City Council, was finalised in 1997, and approved in 2000. In 2009, recognising that the city was in a state of flux, the plan was revised to better suit the emerging challenges which were not included in the original structure (117). According to the plan, the road network system in the city had reached its optimal capacity at the time of revision. The city experienced chronic traffic congestion and bottlenecks at intersections and there were severe parking problems in the city centre. The surge of private vehicles in the city and the related challenges related to congestion have not yet been resolved (119). In terms of transport planning and urban mobility, the plan sets out the following strategies and suggestions among others: • Development of walking trails along the Segoditshane River Valley system; • Priority in shaping new developments redirected from the needs of vehicular transport to those of pedestrians and cyclists (non-motorised transport); • Provide long-distance cycle and pedestrian routes that offer good continuity; • The introduction of variable or flexible work hours; • A parking policy and strategy for Gaborone City; • Ensure that public transport networks efficiently serve their catchments and destinations. Nationally, a total of 10,398 vehicles were registered for the first time by the second quarter of 2021. Out of these vehicles, 81.6% were used vehicles (120). There has been a rapid increase in in private vehicle ownership in Gaborone over the past two decades, leading to increased traffic congestion and longer trip durations (119). The city of Gaborone and Mogoditshane village account for the majority of vehicles registered in the entire country yearly. Mogoditshane village borders Gaborone and is residential area for the majority of people working and studying in Gaborone (119). A few years ago, a non-motorised transport project was piloted in Gaborone with support from United Nations Development Programme (UNDP). The project aimed at promoting the use of bicycles in the city. However, the uptake was low partly due to the lack of cycle lanes or walkways along the main roads (110). The Gaborone City Development Plan emphasises that walkways should provide a choice of routes and be safe and accessible for all. A 400 m walking distance should be applied to access community facilities, public and recreational open spaces. All new developments in the city should demonstrate that they achieve the connectivity principle (117). Despite this, there is little to no provision for sidewalks, or infrastructure for pedestrians and cyclists to safely, comfortably and conveniently move from residential areas to the city centre or commercial and industrial areas within the city (119). 31 AFRICA URBAN MOBILITY OBSERVATORY – POLICY AND PLANNING INSIGHTS REPORT Table 5: Summary of urban mobility actions in Gaborone Mobility Action General Status Activity Despite the existence of some land management tools, cities and peri-urban villages have continued to sprawl. Botswana has not yet conducted any data collection for SDG 11.2. Safety Botswana has a National Road Safety Committee (NRSC). It is funded in the national budget, and also has a road safety strategy which is also fully funded. It recently reviewed the Road Traffic Act. There is, however, low compliance to the UN Vehicle Safety Regulations and Botswana has not signed and ratified the African Road Safety Charter. Structure There is a chapter in the national policy on walking and cycling. While there is evidence of the development of a pedestrian facility improvement plan, at present, segregated sidewalks can be found along primary roads, although there are no cycling facilities. There are limited NMT facilities in residential areas. Way-finding signage for pedestrians does not exist, and traffic lights typically do not have pedestrian signals. Since public transport is unreliable and inefficient, private cars are the dominant means of transport for those who can afford it. Fuels and vehicles Together with Malawi, Botswana imposes no age restrictions on used vehicle imports, except for some border inspections on milage regulations, and the average age of imported used vehicles is unknown. There are initiatives geared towards the development of a National Electric Mobility Promotion Strategy for Botswana and the construction of local electric vehicles. Currently only 2% of Botswana’s electricity is generated from renewable sources of energy. Climate policies include aims to lower GHGs emissions within the transport sector though a taxation system based on emissions by vehicle and use. 4.2.2 Barriers to Sustainable Mobility Solutions Policy decisions and infrastructure investments and coordination make up a low carbon strategy (1). Generally, there is poor service delivery and slow implementation of major government projects in Botswana (107). The previous NDP was also marked by silo planning by relevant subsectors which resulted in lost opportunities to take advantage of the synergies (108). In terms of ICT connectivity, landlocked Botswana faces high costs to access international undersea cables due to transit costs charged by operators from neighbouring countries. Central, Kgalagadi, Kgatleng, Kweneng, Ngamiland and Southern Districts are not connected to the national fibre network. Thus, provision of mobile broadband and government services to these areas is a challenge (108). Some of the other factors which contribute to the high cost for citizens includes anti-competitive structures in the market and non-sharing of infrastructure by service providers. Further, due to their age and diminishing reliability, existing Data Centre and Information Technology Systems do not meet current needs (108). Further challenges include a surge in private vehicle use (119), large urban block sizes that are not easily linked, often providing poor choice of routes, lack of adequate street lighting as well as vandalism of telecommunication infrastructure and the fact that most roads are not up to standards, especially in unsurfaced roads in low income areas of the city. The uncoordinated development of settlements, as well as the under resourcing and lack of capacity of local authorities, magnifies the urban planning and design challenges (110). 4.2.3 Recommendations and Insights Although there are a number of actions that have been taken by both the national and local authorities in Botswana and Gaborone respectively including the formation of a NRSC, the review of the Road Traffic Act and a commitment to improving non-motorised transport and public transport accessibility, there are some urgent gaps that need to be filled in order to ensure a sustainable mobility pathway. Beyond the policy 32 AFRICA URBAN MOBILITY OBSERVATORY – POLICY AND PLANNING INSIGHTS REPORT recommendations elaborated on in Deliverable 4, the following non-exhaustive list includes some actions that could strengthen the pathway to sustainable urban mobility together with a greater focus on transit-oriented development: Greater focus on travel within cities for vulnerable groups (walking and cycling) Both Vision 2036 and the National Development Plan 11 have a strong focus on regional integration and transport logistics. Although these are important for integration in the region and achieving economic targets, it is important to ensure that movement within cities is a priority too. There is limited inclusion and participation of civil society in decision making (106) and a weak policy framework for people with disabilities. A greater focus on the inclusion of vulnerable group in the development of policies could result in more inclusive and vibrant communities. Improve the availability of statistics (Focus on ICT accessibility) The Government of Botswana has already recognised the importance of ensuring reliable data for decision making in NDP 11 and has plans to address the data gaps. It has a number of surveys planned for the implementation period and is working towards greater collaboration. However, a strategy developed across agencies for the administration of the National Statistical System (NSS), and a platform which displays relevant data clearly and accurately, could greatly benefit the administration, and can be done within budget constraints in collaboration with Statistics Botswana (who already collect extensive data on transport and infrastructure) (109). Botswana is not yet in a position to fully take advantage of mobile data collection due to limited network and digital accessibility, but this could be a priority area for the future. More sustainable mobility could be achieved through ICT enabled public transportation, which could attract private vehicle users and retain existing public transportation users (119). Continue to Prioritise Road Safety Many of the plans related to improving road safety have been delayed or have not materialised. With the onset of the Second Decade of Road Safety, a focus on the safe movement of people is paramount. Botswana implemented the Botswana National Road Safety Strategy (2011-2020). A second comprehensive strategy which is developed from the learning of the first would support the realisation of safer, better roads and since 72% of road crash fatalities and injuries occur in the economically productive age groups of 15 to 64 years (114), it would be beneficial for the economic goals to protect people on the move. Develop a SUMP to ensure integrated transport planning While it is noted that there are some mobility documents currently being drafted in Gaborone specifically, more sustainable transport planning may be achieved by implementing a SUMP. Better coordination and integration between different transport modes may also assist in achieving better inclusion of needs of different user groups. The aim of integrated transport planning is to provide citizens with a high-quality, easily accessible articulated network (1). 33 AFRICA URBAN MOBILITY OBSERVATORY – POLICY AND PLANNING INSIGHTS REPORT 5. Kigali, Rwanda Rwanda’s population was estimated at 11.23 million in 2015 (95). The National Institute of Statistics of Rwanda projects the population to increase to 17.6 million by 2035 and to double to about 22.1 million people by 2050 (121). Rwanda comprises of 4 provinces (Eastern, Western, Northern and Southern Provinces) and the City of Kigali. They are subdivided into 30 districts, 416 sectors, 2,148 cells and 14,816 villages. The industrial sector has grown at an average of 9.4% per annum since 2009. Construction has consistently been the largest part of the sector, representing 7% of the GDP in 2019 (121). Socio-economic development is dependent on the environment and natural resources and biodiversity (122). City officials engaged during an AUMO project consultation highlighted that it is important for sustainable mobility to be a driver of economic success. 5.1 National Policy Frameworks There has been a variety of development phases in Rwanda. Starting from the post-genocide period, where the country’s strategy focused on recovery, to the early 2000s, where Vision 2020 led the East African State towards economic development. Post 2010 was a period that included intensive investment in human capital, developing basic infrastructure and expanding access to various services (121). Vision 2050, “The Rwanda we want†builds on the legacy of Vision 2020 and aims to ensure the efficient and sustainable use of land across sectors through the implementation of the National Land Use and Development Master Plan. Vision 2050 also aims to strengthen the relationship between construction and the country’s GDP through, amongst other things, expansion linked to the mass transit in Kigali city, secondary cities, and other urban areas (121). Rwanda’s transport sector is dominated by land transport. The existing road network is comprised of national roads (2,749 km), district roads Class 1 (3,906 km) district roads Class 2 (9,706 km) and other unclassified roads (122). Transport planning falls under the National Ministry of Infrastructure (MININFRA). The Rwanda Transport Development Agency (RTDA) (reports to reports to MININFRA) is responsible for all national and regional road infrastructure. The main mission of RTDA is: • To implement Government policy on roads, railways, cable cars as well as roads and waterways transport infrastructure; • To manage and control national road network with a view of achieving road safety and maintenance; • To manage and control waterways transport infrastructure with a view of ensuring their value added; • To develop railway and cable car infrastructure in Rwanda; • To develop public transport services within the country on roads and waterways. The updated National Transport Policy and Strategy was prepared by the Ministry of Infrastructure and ratified by the Cabinet in April 2021 (123). The National Transport policy recognises that the high cost of transport at national and international levels, as well as insufficient affordable and accessible transport systems in both urban and rural areas, constitute a major constraint to national economic development (124). The Rwanda Green Fund (FONERWA) invests in sustainable wealth creation and poverty reduction. It aims to build a strong climate resilient and green economy (122). FONERWA has committed investments of just under USD 40 million to 35 projects and the Investments have reduced the equivalent of 18,500 tonnes of carbon dioxide emissions (125). Financing can be accessed by government ministries and agencies, districts, and civil society organizations, including academic institutions and the private sector. Rwanda is committed to becoming a data-driven economy (121). As a member of the SMART Africa Initiative, it has taken active steps to develop SMART cities. RTDA also recently rehabilitated its Network Infrastructure, and a road asset management system (RAMS) is under procurement (126). 5.1.1 Climate Change and Air Quality Rwanda is the 29th most vulnerable country to climate change (126). It is prone to droughts, floods, landslides, and windstorms. There have already been reports of destruction of road infrastructure due to climate change (126). Consequently, authorities have employed a variety of both adaptation and mitigation initiatives (122). 34 AFRICA URBAN MOBILITY OBSERVATORY – POLICY AND PLANNING INSIGHTS REPORT In 2011, the Green Growth and Climate Resilience Strategy (GGCRS) was adopted. The strategy aims to guide the process of mainstreaming climate resilience and low carbon development into key sectors of the economy. GGCRS is embedded in the recently developed National Strategy for Transformation (NST) (2018 – 2024). The NST frames the country’s local government and sector plans and includes specific projects or actions. Rapid population and economic growth have already led to intense increases in demand for mobility in Rwanda (12). One of the several innovations in shifting to sustainable mobility is the full adoption of electronic fare collection on the city bus system. This has allowed for real-time updates of public transit routes (127). The National Environment and Climate Change Policy developed by the Ministry of Environment, provides strategic direction on environment and climate change in Rwanda, bearing in mind important linkages with socio-economic development (128). Policy statement two is geared towards strengthened mitigation mechanism in planning and implementation. In line with the Rwandan NDCs relevant policy actions are: • Enforce air pollution emission standards and regulation; • Promote the use of alternative forms to biomass fuel (e.g.: gas and electricity) in urban and rural areas; • Promote resource efficient technologies to reduce energy consumption in processing industries; • Promote renewable energy to achieve universal access to electricity. The policy outlines a green city concept which prioritises policies and investments in public, non-motorised and low-emission transport as well as the modernisation of cities, towns and rural settlements that are inclusive of well-designed transport facilities and services. In terms of air quality, acute respiratory infections are the leading causes of death in Rwanda (122). To reduce pollution levels from the transport sector, the government has committed to reducing the number of imported used cars and prioritising electric vehicles as part of its e-mobility program (122). As noted in Deliverable 4, the Cabinet formally approved an e-mobility adoption strategy in April 2021. 5.1.2 Accessibility and Safety Statistics from the Rwanda National Police (RNP) Department of Traffic and Road Safety indicate that at least 465 people died in road accidents in 2018, while 654 others sustained injuries in the same period (129). In the same period, 77 traffic Police officers were dismissed for taking bribes, while 160 drivers were also arrested for giving bribes. As part of RNP’s efforts to improve service delivery standards in the Strategic Plan (2018/2019-2022-2023), the institution has committed to the development and operationalisation of an integrated e-services portal with capacity to provide online services such as application for Provisional Driving License assessment tests, eregistration for Driving License assessment tests; e-payment for traffic offenses and other services offered by department of Traffic and Road Safety. In 2019, Rwanda initiated a road safety campaign entitled “Gerayo Amahoroâ€, meaning “arrive safelyâ€, was conducted. The main objective was to develop and implement sustainable road safety strategies and programs to contribute to the realization of overarching SDG targets, especially target 3.6.1 (126). The National Transport Policy emphasises the importance of having suitable measures in place to improve road safety for all users. Enhancing safety is set to focus on: transport infrastructure improvements; awareness activities such as safety education and campaigns; updating import standards and ensuring strict vehicle inspection; standardised driver-training curriculum, introduction of computerised theoretical and practical driving testing and the introduction of road safety cameras on selected routes nationwide. Vision 2050 aims for a future in which there are modern and efficient transport systems, and where 90% or more of the population can access public transport within a 500 m radius of their homes and places of work/activity (121). 35 AFRICA URBAN MOBILITY OBSERVATORY – POLICY AND PLANNING INSIGHTS REPORT Gender equality features prominently in Rwanda, and impressively, currently ranks ninth out of 153 countries in the Global Gender Gap Report (121). According to the RTDA, Gender is mainstreamed in all ongoing transport infrastructure projects, with equal representation in manual-labour works (126). AUMO data collected in Kigali indicates that the instances of sexual harassment are low (see Section 9), however, in a study conducted by UN Women in Kigali, 55% of women reported concerns about using public transport after dark (127). 5.2 Kigali Mobility Landscape While 1.5 million people currently live in Kigali, the city is expected to experience a significant growth by 2030, reaching a number of 3.8 million urban dwellers (123). The city is a major economic driver in the country, representing about 0.58 million employment opportunities. Twenty three percent of Rwanda’s population lives in urban areas – of which the capital Kigali is the largest (122). If this urbanisation is properly managed and coupled with industry and services, it can be an instrument for wealth creation. The City of Kigali (CoK) is responsible for district and feeder road infrastructure in the city as well as the urban planning. The city has taken great strides in developing a comprehensive and accessible policy framework. Transport and mobility related decision making is linked to a variety of strategy and policy documents, and these include but are not limited to: • Public Transport Policy and Strategy for Rwanda (MININFRA – 2012); ï‚š Aims to assess public transport challenges, culminating in reports outlining potential policy remedial measures on short, medium and long-term bases (has been replaced by the 2021 version); • Kigali Conceptual Master Plan (National Government – 2013); ï‚š Aims to develop a conceptual transport master plan, infrastructure and land use planning and environmental management strategy for the entire city; • Fleet Policy of Government of Rwanda (National Government – 2014); ï‚š Aims to reduce capital cost, maintenance and running costs as well as minimise waste and abuse of public facilities; • National Feeder Road Policy and Strategy (MININFRA – 2017); ï‚š Aims to enable and stimulate rural socio-economic development, providing an institutional framework in feeder roads operations as well as an efficient use of means and resources; • National Transport Policy – Vision 2020 (MININFRA – 2018); ï‚š Aims to strengthen institutional and legal frameworks to support the creation of a favourable environment for transport sector development; • Kigali Transport Master Plan 2013 – 2020 and 2020 - 2050 (National Government and Surbana International Consultants); ï‚š Provides a framework for the long-term development and expansion of existing transport systems that will support the City of Kigali in a smart and a sustainable manner; ï‚š The Master Plan, Transport Plan and Traffic Reports are all available on an easily accessible online platform dedicated to the city’s urban reform; ï‚š This document was updated in 2020, targeting the 2050 horizon. It operates on a principle of transitoriented development and includes goals that are relevant to air pollution: â–ª Develop a high-quality mass-transit system; â–ª Develop a road network that supports mass transit system; â–ª Integrate non-motorised Transport Infrastructure including cycle lanes into the road network; â–ª Establish green transportation network and pedestrian-friendly streets in Kigali; â–ª Provide seamless intermodal transport connectivity; ï‚š Master plans are also being developed for the six secondary cities that are likely to contain similar principles; • National Transport Policy and Strategy for Rwanda (MININFRA – 2021); 36 AFRICA URBAN MOBILITY OBSERVATORY – POLICY AND PLANNING INSIGHTS REPORT ï‚š Document aims to promote the sustainable development of an integrated transport infrastructure network, enhance the quality of transport services and reinforce capacity building in the transport sector to address cross-cutting issues. Figure 6: Proposed Zoning in the Kigali Master Implementation Plan for 2050 5.2.1 Urban Mobility Trajectory As noted in Deliverable 4, there are a number of sustainable mobility initiatives in Kigali. The city has been implementing the “City Development Plan 2013-2018†and is aiming to become a city of green transport (130). E-mobility is a priority area. Amongst other things, Kigali is promoting e-mobility by testing the use of electric motorbikes and formulating strategic documents on the adoption of e-mobility. There are a number of startups, including Ampersand and Guraride, that are currently testing and rolling out innovative e-mobility concepts for two-wheelers. NMT, car free zones and car free days are also prioritised. Kigali Car Free Day takes place on every first and third Sunday of the month, where some roads are closed for motorised vehicles, and where only walking and cycling is permitted. The initiative is financed locally and supported by volunteers. The first car free zone of Kigali is located on Road KN4 Avenue. There are also permanent car free zones including the village Gitega sector of the Nyarugenge district in Biryogo (131). The focus on NMT is significant beyond ensuring general accessibility and last mile connectivity. Kigali has bicycle taxis that provide a means of employment for thousands of young men (127). ITDP together with UN-Habitat are currently supporting with drafting a street design manual for NMT. Kigali has also started the implementation of cycles lanes, for instance in the Central Business District and in Kicukiro; further lanes are planned for deployment to support the high reliance on NMT (123). More than half of GHG emissions in Kigali can be attributed to the transport sector (12). As a consequence, TOD is a priority. There are continued efforts towards public transport optimisation (electric feasibility studies 37 AFRICA URBAN MOBILITY OBSERVATORY – POLICY AND PLANNING INSIGHTS REPORT are under way), and efficient road safety management. There are also specific smart city initiatives in transport including a city parking management system and smart traffic lights. Officials are also working with JICA to understand congestion patterns and route mapping. During stakeholder consultations, CoK officials indicated that most of the mobility data that the city has collected is in the form of feasibility studies (such as the BRT feasibility study). The city has acknowledged that there is a gap in data collection management. Kigali authorities are exploring the possibility of setting up a data bank. In terms of urban planning, FONERWA is financing a pilot initiative called The Green City Kigali. The new neighbourhood in Kigali’s Kinyinya Hill will provide housing for the lower- to middle-income population of Kigali, but also for households and individuals that cannot afford a decent home at any price. The Green City Pilot Project is expected to set standards for adequate housing and sustainable urban development in Rwanda and in Africa and strengthen government institutions and other stakeholders’ capacity to apply appropriate and urban development principles (132). Table 6: Summary of urban mobility actions in Kigali Mobility Action General Status Activity Kigali has contributed to data collection for SDG 11.2. Accessibility to public transport is high compared to the rest of the region. The city has 50,33% accessibility. However, around 5.4 million people in rural areas are not connected through all-season roads and there is a lack of facilities for pedestrians and cyclists. Safety The National Road Safety Committee is funded in the national budget, and has a road safety strategy which is partially funded. The National Transport Policy and Strategy sets out the importance of ensuring safety and health of all transport users. Rwanda has some compliance to the UN Vehicle Safety Regulations and has not signed the African Road Safety Charter. Structure The National Transport Policy and Strategy document released in 2021 indicates a clear prioritization of NMT and public transport accessibility. It aims to expand city bus services to provide fleets of at least 50 buses per 100,000 population, promote gender sensitive public transport and ensure that streets and NMT facilities are accessible to all. Car Free Zones are currently implemented across the city, in connection with public engagement events. There is a comprehensive and easily accessible policy framework on the future of the set. Fuels and vehicles Rwanda aims to provide incentives for electric mobility users and early adopters. Incentives can include a reduction of import duty on specific components and attractive electricity tariffs for charging stations. 5.2.2 Barriers to Sustainable Mobility Solutions According to FONERWA, Rwanda faces some transport challenges impacting economic and social accessibility. These include: • High-density urban areas, contributing to congestion and emissions (7% increase per annum) with growing private vehicle use; • High costs of transport (fuel), impacting commuter mobility and the costs of doing business; • Mountainous terrain, necessitating complex infrastructure to transverse and ensure resilience against extreme weather events; and • Land-locked geography, creating dependence on reliable connectivity with neighbours. During stakeholder consultations with both local and national government officials engaging with the AUMO project in Kigali, air pollution, traffic crashes, noise pollution, emission of greenhouse gases, and over 38 AFRICA URBAN MOBILITY OBSERVATORY – POLICY AND PLANNING INSIGHTS REPORT dependence on fossil fuels, as well as externalities and shocks (such as COVID-19) were outlined as key challenges. The National Transport Policy and Strategy for Rwanda developed in April 2021 highlights key barriers to achieving sustainable mobility. They include: • Inadequate public transport; • Lack of facilities for pedestrians and cyclists; • Poor road safety; • Lack of rural access; • High cost and slow travel times for intercity goods movement; • Climate change vulnerability; • Growing emissions of local air pollutants and greenhouse gases; • Lack of gender equity and equality; • Inadequate capacity; • Data Management; • Transport sector worker health and well-being. 5.2.3 Recommendations and Insights Although there are a number of actions that have been taken by both the national and local authorities in Rwanda and Kigali respectively including the development of a comprehensive, cross sector policy framework, the development of e-mobility strategies and the prioritisation of people that walk and cycle, there are some gaps that could be addressed in order to secure a sustainable mobility pathway. Beyond the policy recommendations elaborated on in Deliverable 4, the following non-exhaustive list includes some actions that could strengthen the pathway to sustainable urban mobility: Establish a robust data bank and data management strategy Rwanda has an ambitious vision to reduce GHG emissions and air pollution. However, the implementation will require continuous data and analysis (12). The city of Kigali uses a number of different data sources including household surveys. According to stakeholder engagements with key officials in Kigali, sourcing reliable data is a challenge. A lot of decisions are based on short term data as decision makers do not have access to 10- or 20-year projections that can support their work. This makes it difficult to identify trends. There is no consolidated database which collates the data and displays it temporally. There is no link between ministries and organisations that collect data that may be useful for multiple sectors. It is also challenging to collect the data at regular intervals. The development of a comprehensive database as well as RAMS could assist in ensuring better informed mobility decision making. Continued commitment to Complete Streets A continued prioritisation of the movement of people through the transport orientated approach outlined in the Kigali Master plan is key to the sustainable mobility future of Kigali (12). “Complete streets†make cities more accessible to all types of users and to make urban spaces more environmentally friendly by reducing motorised transport (133). Within existing street networks, city officials have the ability to re-design and allocate more spaces for walking, cycling and the promotion of public space. Continue to enable start-ups and entrepreneurs with innovative mobility solutions Rwanda’s start-up ecosystem seems to be growing in the last few years. The government could continue to provide additional support for start-up acceleration programmes and develop enabling policy and regulatory frameworks for entrepreneurs that propose innovative ideas addressing access to sustainable mobility in the informal transport sector or electric mobility. 39 AFRICA URBAN MOBILITY OBSERVATORY – POLICY AND PLANNING INSIGHTS REPORT 6. Kinshasa, DRC According to research conducted by JICA in support of the development of the Kinshasa City Transport Master Plan, no national census survey has been conducted in DRC since 1984 (134). It is unclear how many people live in the DRC but estimates indicate that the population was 87 million in 2016. Most of the urban population is in Kinshasa. The rest live in small cities with fewer than 500,000 inhabitants (135). The DRC’s urbanisation path is peculiar in that migration to cities has been induced by push factors (avoiding conflict or inadequate rural services) rather than the pull of better employment and opportunities in cities (135). Since the end of the conflict in 2003, policy documents and strategies suggest that rehabilitation of the national road network is a core priority. The DRC has experienced increased economic growth for the past ten years through the mining, transport, and telecommunication sectors (134). However, it is urbanising at much lower income levels than elsewhere in the world and jobs in the informal sector are most common (135). 6.1 National Policy Frameworks DRC, Africa’s second largest country by area, has five economic regions. Each of these regions are urbanising at different rates. Many of the cities are characterised by high levels of poverty and poor levels of service delivery (135). Generally, land management lies outside the jurisdiction of cities and communes, and is managed by the provincial and state authorities. This is because all land is state owned. Generally speaking, urban planning laws, documents and regulations are largely outdated (135). Table 7: Main Stakeholders in Urban Development and Management in DRC (135) State Ministries (divisions and services) Decentralised Entities Utility Companies Infrastructure and public works Province REGISDESO: Régie de Distribution de l’Eau (local water company) Town planning and housing City SNEL: Société Nationale d’Eau et d’Electricité (National Utility for Water and Electricity). Land tenure Communes OVD: Office de Voirie et de Drainage (Office for Roads and Drainage) Environment - - Finance and budget - - Overall infrastructure provision is low in the DRC, hampering the benefits of urbanisation (135). However, there are some initiatives aimed at improving the status quo. The PNSD is currently being finalised. Funded by the UNDP for 2017 to 2021 – it is the national vision for economic development by 2030. There are some World Bank projects dedicated to improving connectivity, but most are tied to ensuring regional connectivity to support national economic integration of the DRC and the strengthening government capacity (136). The road network is approximately 153,200 km (134). However, it is largely deficient (135). Areas built during the colonial period follow road plans while in expansion areas only main roads follow regulations (135). Some challenges remain to be met in the modernisation of the overall road system. These challenges include: • The scope of deterioration; • A shortage of road maintenance; • The absence of structured road transportation companies; 40 AFRICA URBAN MOBILITY OBSERVATORY – POLICY AND PLANNING INSIGHTS REPORT • The inadequacy of technical vehicle inspection organisations; and insufficiency of road administration capacities (137). The roads are managed by the following authorities: • Ministry of Infrastructure, Public Works and Reconstruction (MIPTR), under the management of the Road Agency (OR); • Office of Roads and Drainage (OVD); • Ministry of Rural Development, under the management of the Directorate of Agricultural Roads (DVDA). Figure 7: Transport Infrastructure in the Democratic Republic of the Congo (135) Due to weak policy and institutional capacity, as well as limited financial resources allocated to the sector, the transport system has not been significantly upgraded since colonial times (136). However, there has been some recent activity in the region aimed at developing capacity and strengthening policy frameworks. The national vision for economic development by 2030 is guided by the National Strategic Development Plan PNSD. The DRC formulated the document with support from the United Nations Development Programme (134). The plan is focused on stabilisation, reconstruction and governance. It emphasises the importance of macroeconomic growth to accelerate employment. In addition to national planning, in almost 12 provinces, UNDP and the Ministry of Planning are developing Provincial Development plans based on the needs of each province and developing a plan adapted to the realities of the provinces. The DRC also plans to develop sectoral plans in the four areas of culture and the arts, human rights, youth and transport (138). The National Integrated Transport Master Plan (PDNIT - Le Plan Directeur National Intégré des Transports) is currently being formulated with finance from the African Development Bank. The PDNIT is an integrated national transport master plan for the whole of DRC (134). Several urban transport sector issues are identified by the PDNIT. They are: 41 AFRICA URBAN MOBILITY OBSERVATORY – POLICY AND PLANNING INSIGHTS REPORT • Insufficient supply of urban infrastructure to be restructured, maintained and developed; • Sub-standard public transport services to be structured and reinforced; • Current unsatisfied and constrained travel demand to be served by transport modes; • Inefficient transport organizations to be restructured in line with urban development; • Governance dysfunction requiring more local and more integrated management of transport. The eight operational objectives of the PDNIT are to: • Prioritise, restructure and complete the urban road network in order to improve reliability and support urban development; • Reinforce maintenance of urban roads to be served; • Strengthen the capacity of traffic flow management in order to smooth traffic and optimise network usage; • Structure supply of urban feeder public transport services by supporting drivers and owners; • Reinforce or create an urban public transport system for local needs and contexts; • Organise multi-modal transport hubs (or “Les pôles d’échangesâ€) to be integrated into the urban environment; • Provide urban planning and project implementation tools; • Organise key persons to enable them to effectively implement urban transport policy. 6.1.1 Climate Change and Air Quality Studies indicate that there is an increase in the likelihood of extreme events, such as intense rainfall due to climate change. The complex ecosystem surrounding the Congo Basin is sensitive to these climatic changes (48). There is a high vulnerability to climate change in the areas of food security and health (139). In the DRC’s 2020 Voluntary National Review, the country indicated that on the environmental front, several climate change mitigation and adaptation projects have been initiated, but that they required more sectoral synergies. A lack of reliable climate data; weak technical capacity and institutional and legal support hampers progress (140). The DRC is a member of the Climate and Clean Air Coalition. The Ministère de l'Environnement et Développement Durable (Ministry of Environment and Sustainable Development) (MEDD) has a number of ongoing activities related to improving air quality, however, data on air quality status is sparse, however, research conducted on Annual mean PM2.5 indicated that it is 4 times the WHO recommendations (141). The MEDD has also worked closely with UNDP to update the country’s NDC (142). The DRC’s NDC is a commitment to a 17% reduction in emissions from 2021 to 2030. However, this is conditioned on external financing estimated at $21.6 billion (139). There is also a NAP 2006, a NAP for climate change (2014) and other national institutional arrangements including a National Climate Change Committee. The priority area for most of these texts is agriculture and climate resilience for rural and urban communities. However, the NDC does indicate that the total amount needed to address adaptation needs in energy and transport is US$7.35 billion (143). 6.1.2 Accessibility and Safety There is a National Program for Road Safety (CNPR). The Ministry of Transport and Communication Channels, which is funded in the national budget, has a road safety strategy which is partially funded. There are however no known road safety targets (56). In Kinshasa Province, the number of fatalities increased by 1.8 times in the 15 years between 2001 and 2016 (134). According to research conducted by JICA, issues in ensuring traffic safety include inadequate traffic signals at locations with a high risk for traffic accidents, a lack of education regarding an awareness of traffic safety, traffic discipline and, amongst other things, inadequate infrastructure for pedestrians and cyclists. The Congo’s National Development Plan acknowledges that “substantial upgrading efforts are required to keep Congo abreast of the new challenges involving climate change†and road safety (137). 42 AFRICA URBAN MOBILITY OBSERVATORY – POLICY AND PLANNING INSIGHTS REPORT There are few opportunities for effectively participating in local decision-making processes and development decision making. Spatial segregation also aggravates social exclusion (135). 6.2 Kinshasa Mobility Landscape: The capital and the largest city of the DRC, Kinshasa is now one of the world's fastest-growing megacities (135). The core of Kinshasa, originally built for a colonial citizenry, grew to 400,000 inhabitants in the 1960s with no planned urban development to absorb additional people. As a result, the area is incredibly densely populated (135). From 1995 to 2005, 30% of the urban expansion was along erosion-prone areas (slopes). 50% was along more than 1 km of the major transport axis, in non-buildable areas – many people live in the unserved outskirts of the city, increasing their vulnerability to climate-related risks (135). Kinshasa has experienced multiple flash floods – in January 2018, flooding and landslides induced by struck nine communes of Kinshasa, affecting more than 15,700 people and claiming 51 lives (48). The population of Kinshasa City has increased from around 2.6 million in 1984, to 10.6 million in 2013, at an average annual growth rate of 4.9%. The city is expected to reach around 26 million in 2040, with an average growth rate of 2.7 % between 2030 and 2040 (134). Kinshasa is subdivided in 24 communes. Twenty-one communes in Kinshasa City are urbanised in terms of land use as CBD, commercial, industrial, or residential areas. Although only 13% of the DRC's population lives in the city, Kinshasa accounts for 85% of the Congolese GDP (134). Despite rapid urbanisation infrastructure development, 80% of the total road length is unpaved. The authority that manages this is the Office des Voiries et Drainage. Kinshasa does not have its own transport authority. A Strategic Master Plan for the Kinshasa Metropolitan Area was developed in 2014 and approved in 2016. Schéma d'Orientation Stratégique de l'Agglomération Kinoise (SOSAK) was developed with the support of the French Development Agency. SOSAK is tasked with promoting the planned urban development of Kinshasa City through an Urban Transport Master Plan in parallel with urban development (134). Several programs have been proposed for the urban transport system in Kinshasa City such as development and maintenance of urban roads, improvement and management of intersections, multi-modal transport hubs (or “Les pôles d’échangesâ€), and public transport network development, including buses and BRT (134). 6.2.1 Urban Mobility Trajectory In Kinshasa, fast population growth has not been complemented by planned investments in infrastructure (135). There is a high dependence on NMT. (134). According to an analysis by the World Bank, in Kinshasa, 80% of trips are made on foot (135). Transport services and infrastructure appear to be deteriorating (144). Traffic volumes have increased significantly in recent years (134), however, traffic volumes are lower than other comparable low-income countries (135). Congestion is a consequence of poor land use planning, suboptimal layouts and management of the main intersections rather than an influx of cars (144). Residents in Kinshasa are severely impacted by the high cost of transport. It is estimated that the poorest in Kinshasa allocate 31% of their budget to commuting costs (135). Major sources of air pollution include vehicle exhaust, earth dust from unpaved roads and ground surface, smoke from unregulated waste burning, and smoke from waste collection points (134). Kinshasa has a lower paved road density than other cities in Sub-Saharan Africa (135). 43 AFRICA URBAN MOBILITY OBSERVATORY – POLICY AND PLANNING INSIGHTS REPORT Figure 8: Summary of urban mobility actions in Kinshasa Mobility Action General Status Activity 49.6% of all trips in the city are made by walking and cycling. Despite this considerable mode share, pedestrian facilities are generally very poor, and bicycles facilities are non-existent. Kinshasa has contributed to data collection for SDG 11.2. There is only a 17,42% accessibility to public transport. Safety There are several challenges regarding traffic safety in Kinshasa City. These include speeding, dangerous passing, drunk driving, busy intersections without traffic signals, a lack of traffic signs, illegally parked vehicles, and overloading of goods and passengers. Drivers are accustomed to not using seatbelts or not wearing motorcycle helmets. Drunk driving enforcement is not done on a regular basis, partially due to traffic police not having sufficient alcohol test kits. Structure Locations closer to main roads and transport infrastructure have higher prices. Poorer communities settle in unconnected, underserviced neighbourhoods, or in slums. Urban planning laws, documents and regulations are largely outdated. According to JICA, with minimal improvement to public transport, the consumption of transport fuel per capita will increase, as well as greenhouse gas emissions by the transport sector. Fuels and vehicles DRC imposes a maximum age limit on used vehicle imports of 9 years. However, technical vehicle inspection organisations are generally considered to be inadequate. There are few electric mobility innovations in the city at the moment. 6.2.2 Barriers to Sustainable Mobility Solutions The two civil wars (1996 to 1997 and 1998 to 2003) have significantly impacted urban planning and development (135). The lack of structured urban planning is largely responsible for the proliferation of slums. There are significant flood risks in Kinshasa. The daily cost of flood disruption to commuters’ trips in Kinshasa is estimated at US$1,166,000 (48). Accessibility to jobs and opportunities risks being severely impacted by urban flooding. Research conducted by JICA has identified several issues on road development, maintenance and management and drainage. These include identifying places with frequent traffic accidents and their causes, improving non-motorised traffic facilities, inadequate parking policy and management, including policy and management regarding stopping vehicles and budget shortage and low capacity for road development (134). There is also no general strategy for improving accessibility and mobility (135). Responsibilities for urban transport planning, program implementation, and road maintenance are not clearly defined. Between the Ministry of Transport and Communication, the Ministry of Public Works, and the government of Kinshasa there are a lot of overlapping competencies and blurred responsibilities (135). 6.2.3 Recommendations and Insights Despite the challenges, there are a number of actions that have been taken by both the national and local authorities in the DRC and Kinshasa respectively including intelligent robot cops and consistent efforts to improve policy implementation. However, there are some urgent gaps that need to be filled in order to ensure a sustainable mobility pathway. Beyond the policy recommendations elaborated on in Deliverable 4, the following non-exhaustive list includes some actions that could strengthen the pathway to sustainable urban mobility together with a greater focus on transport orientated development: Develop comprehensive urban planning frameworks and policy documents As Kinshasa develops its Transport Master Plan, it is fundamental that the document is climate sensitive, inclusive and integrated into urban planning mechanisms. The transport strategy should include (145): 44 AFRICA URBAN MOBILITY OBSERVATORY – POLICY AND PLANNING INSIGHTS REPORT • A broad vision; • A set of basic objectives; • A set of principles to guide the efforts to meet these objectives; • An assessment of the adequacy of existing arrangements in the sector in relation to both above; • A set of strategies for addressing shortcomings and meeting the objectives in accordance with the policy principles, and within the funding and institutional constraints that are expected to prevail; • A set of prioritised actions—plans—that are key steps in implementing the strategies; • A set of monitoring procedures to be used to check whether the strategies and plans are implemented in accordance with the policy principles, defining the level of involvement of central government at the subnational level (regions, cities, and so on). It is important to integrate the needs of local communities by ensuring the inclusion of informal governance structures. For example, slums and informal settlements have developed “autonomous†informal zones, where the lack of formal governance is substituted by informal systems of self-regulation (135). 45 AFRICA URBAN MOBILITY OBSERVATORY – POLICY AND PLANNING INSIGHTS REPORT 7. Lagos, Nigeria Nigeria has the largest population and economy in Africa. It covers a total area of 923,769 square kilometres (146). In 2016, the population was estimated at around 193 million, while estimates for 2020 were 204 million, with an urban population of 57% (24). Nigeria is a member of the Economic Community of West African States (ECOWAS), a well as the OPEC. In the first quarter of 2021, the economy stood at US$105.5 billion. The oil sector accounts for 9% of the real GDP and is currently the largest source of government revenue (146). 7.1 National Policy Frameworks Nigeria’s federal system of government is based on three levels: Federal, State and Local Governments. In response to the oil shock (2014 – 2016) the Nigerian Government prepared the Economic Recovery and Growth Plan. The 2020 Economic Sustainability plan along with the Medium-Term Economic Growth Acceleration Plan 2021 – 2025 which sets out the country’s response to economic downturn. The recession in 2017, and subsequent shocks experienced as a consequence of the COVID-19 pandemic, have slowed projected growth, and resulted in severe economic impacts (146). The Nigeria Economic Stability Plan (NESP) has been developed to stimulate the economy and drive the country out of the economic situation it currently finds itself in. Agenda 2050, currently being prepared, aims to make Nigeria a socio-economically advanced nation. The plan is focused on digital connectivity and a diversified and inclusive economy (146). It sets out the intention to be a low-carbon, climate-resilient and high-growth economy that reduces the current levels of emissions by 50% (146). The agenda introduces a circular economy and gender equality as new priority areas. There is also the Medium-Term National Development Plan 2021-2025 which is intended to improve inclusive, holistic development and competitiveness. It aims to, amongst other things, grow the GDP and stimulate growth in non-oil sectors. The Plan is structured around seven cluster areas including (147): • Economic Growth and Development; • Infrastructure; • Public Administration; • Human Capital Development; • Social Development; • Regional Development; • Plan Implementation. The plan focuses on improving national transport networks and makes no mention of walking and cycling or NMT, paratransit or public transport. It does, however, make reference to ensuring a safe, efficient and effective road network. Currently there are weak links between urban planning, land use, urban infrastructure and urban transport planning. At the Federal level, there are several agencies involved in urban transport management. Some of them include (24): • Federal Ministry of Power, Works and Housing (FMoPWH); ï‚š Has several statutory responsibilities among which are the construction and rehabilitation of federal highways, highways planning and design, monitoring and maintenance of federal roads and bridges and the provision of engineering infrastructure; • Federal Ministry of Transportation (FMoT); ï‚š Lead agency for transport policy, planning and investment at the federal level in Nigeria. Parts of its responsibilities include promoting and coordinating the development of an integrated, efficient and sustainable transport system. It is also responsible for coordinating responses to Federal, State and Local Government transport policy reform initiatives; • National Inland Waterways Authority (NIWA); 46 AFRICA URBAN MOBILITY OBSERVATORY – POLICY AND PLANNING INSIGHTS REPORT • Integrated Transport Policy Coordination Committee (ITPCC); ï‚š Independent body to provide advice to Government on the implementation of integrated transport policy, to monitor developments across transport, environment, health and other sectors; • National Transport Commission (NTC); ï‚š Created in 2018, it will promote the implementation of the National Transport Policy and will be responsible for regulating public transit operation in the states; • Federal Road Safety Commission (FRSC); ï‚š Paramilitary organization and lead agency in road traffic administration and safety management; • Nigeria Ports Authority (NPA); • Traffic Unit (TU) of the Nigeria Police. Nigeria’s transport sector contributes approximately 3% to national GDP (147). FMoPWH has adopted a Public Private Partnership methodology to improve the Federal Roads Network. The Draft National Transport Policy of 2017 is currently awaiting approval from the Federal Government. It seeks to establish a framework to guide the sustainable planning and development of an integrated transportation system for the social and economic development of Nigeria. The Draft National Transport policy has a chapter on urban transport which contains the following goals: • To develop an efficient, affordable, self-sustaining and reliable multimodal public transport system that meets the needs of the growing population of Nigerian cities; • To develop a National Urban Transportation Policy for detailed provisions on urban transportation for uniform and ease of implementation; • To improve the infrastructure and institutional framework for public transport service delivery; • To develop an affordable, accessible, attractive and efficient public transport and non-motorised transport (NMT) system. 7.1.1 Climate Change and Air Quality Nigeria has a department of climate change dedicated to ensuring that Nigeria develops in harmony with the environment. The Climate Change Department (CCD) was created to implement the Climate Convention and protocol activities. It also coordinates the activities of the Inter-ministerial Committee on Climate Change. Nigeria’s climate ambitions are set out in the National Climate Change Policy for 2021 – 2030. It also has a National Adaptation Strategy and Plan of Action for Climate Change Nigeria (2011). The national policy aims to promote low-carbon climate resilient and gender responsive sustainable socio-economic development (146). Nigeria has also begun the development of a long term, low emission development strategy (LT-LEDS) and has introduced a Clean Energy Transport Scheme which involves the use of compressed national gases for public transport buses. According to Sustainable, Low Carbon Transport (SLOCAT), Nigeria recently reformed its fossil fuel subsidy framework, saving the government at least US$2 billion a year (127). In July 2021, The Federal Government submitted an updated NDC. It indicated that in 2018, the energy sector was the largest source of GHG emissions followed by transport and electricity generation (148). Nigeria’s updated NDC, was developed in consultation with over 40 stakeholder groups and more than six development partners. The document is more consistent with the 1.5°C pathway than the previously submitted NDC (2015) (149). Despite progress made on a policy level for climate and transport, Lagos continues to have the worst traffic congestion and pollution levels in the country (24). In terms of air quality, emission sources include household energy use, transport, oil and gas, agriculture, heavy industry and the waste sectors. In 2019, Nigeria approved the National Action Plan to Reduce short-lived Climate Pollutants (SLCP). Implementation of the measures across all relevant sectors could reduce exposure to air pollution across Nigeria by 22% in 2030. The transport related measures are indicated in Table 8. 47 AFRICA URBAN MOBILITY OBSERVATORY – POLICY AND PLANNING INSIGHTS REPORT Table 8: SLCP Transport Measures in the Nigerian 2019 SLCP Plan SLCP Abatement Measures Target 1. Renewal of urban bus fleet in Lagos 2. Adoption of CNG (compressed natural gas) Buses in Nigeria 3. Introduction of low sulphur Diesel and Petrol 4. Elimination of high emitting vehicles that do not meet vehicle emission standards 5. Reduction of vehicle journeys by car through transport modal shifts 5000 new buses in Lagos complete and Danfo buses fully replaced by 2021 25% all Buses converted to CNG by 2030 50 ppm diesel fuel introduced in 2019; 150 ppm petrol introduced in 2021 Euro IV limits met by all vehicles by 2030 500, 000 daily journeys shifted from road to rail & waterways 7.1.2 Accessibility and Safety The WHO’s estimated fatality rate per 100,000 is at 21.4 (150). The Federal Road Safety Corps, funded in the national budget, has a road safety strategy which is also fully funded. Federal Road Safety Corps is statutorily placed under the Presidency with the Office of the Secretary to the Government of the Federation (SGF) as the Supervising Authority. The Governing Board has the responsibility of policy making and Administration. The Mission of the Corps is to regulate, enforce and coordinate all road traffic and safety management activities through sustained public enlightenment, promotion of stakeholder’s cooperation, robust data management, improved vehicle administration, prompt rescue services, and effective patrol operations. The FRSC publishes regular statistical digests on offences, finances, vehicle administrations and the number of people injured on the roads amongst other things. The infrastructure and speed management investment required is $3.77 billion, however the economic benefits of doing so are in excess of $112 billion (150). Apart from Lagos, cities in Nigeria do not have reliable funds dedicated to urban transport initiatives (24). Research conducted by the Africa Development Bank in 2009 indicated that household expenditure on transport is higher in the Democratic Republic of the Congo than in Nigeria. However, the urban poor population do not have adequate access to transport, as programs aimed at improving NMT conditions are still limited (24). Paratransit modes, for the time being, appear to be a solution to urban poor dwellers inclusion, however, the needs of people with disabilities or the elderly are still not integrated into the transport planning process, and there are significant mobility limitations (24). The mobility frameworks are also not responsive to the needs of women. There have been some recent policy innovations to address these challenges. The 2021 NDC update, for example, commits to mainstreaming gender across all sectors, building on the National Action Plan on Gender and Climate approved by the Federal Executive Council in 2020. While there is a “whole society approach†indicated, there are no specific transport related initiatives highlighted in the energy and transportation segment of the gender mainstreaming section of the NDC. The 2021 – 2025 development plan highlights the responsibility created by the recent enactment of the Discrimination Against People with Disabilities (Prohibition) Act (2018) and the lack of availability of inclusive infrastructure. While the Plan recognises that there is limited data regarding the needs of people with disabilities, it does set ambitious targets to ensure inclusive socio-economic growth. While none of the objectives and targets related directly to mobility and there is no mention of road safety generally, the Plan does include a commitment to adopting an inclusive lens in policy making. There is a robust civil society presence in Nigeria with organisations developing Sustainable Urban Mobility Courses, advocating for open streets in Abuja and contributing to policy and strategy development. 48 AFRICA URBAN MOBILITY OBSERVATORY – POLICY AND PLANNING INSIGHTS REPORT 7.2 Lagos Mobility Landscape Lagos is one of the most rapidly urbanising metropolitan areas of the world. In light of the unregulated growth, the city has experienced rapid expansion and the creation of slums. The Lagos Metropolitan Area consists of 16 local government areas out of the twenty Lagos State’s local government areas. Roughly 85% of the states’ population lives in the Lagos Metropolitan Area (24). Lagos is the commercial and economic powerhouse of Nigeria. It has a varied economy that comprises of manufacturing, transport, construction, wholesale, and retail trade. It contributes 62% to national non-oil GDP (151). Transport decisions related to roads, bus services, rail, safety and non-motorised transport rest with the Lagos Metropolitan Area Transport Authority (LAMATA) and the Lagos State Ministry of Transportation. The framework for the establishment of LAMATA was developed in 1996. It sets out LAMATA’s role including its core functions, organisational structure, resource requirements and relationship with stakeholders (152). Established as a semi-autonomous corporate body with perpetual succession, and an independent board, it was created by a State Act (LAMATA Law) signed into law in 2002. Recognising changing needs, the LAMATA law was amended in 2007 to ensure that it had the authority to coordinate the transport policies, programs, and actions of all agencies (152). LAMATA has the power to facilitate the discharge of its statutory functions, including the power to levy and collect user charges in connection with the provision of its services and to collect any other tariffs, fees and road taxes as may be authorised by the Governor. While LAMATA’s reform has resulted in some benefits, the organisation has not been able to address the key issues of overall inefficiencies and lack of adequate regulatory frameworks to tackle the challenges of Lagos urban transport system (24). Lagos has several documents guiding the implementation of transport projects. It has, for example, an NMT Policy and an NMT Committee (153). The policy was developed together with the Lagos Ministry of Transportation, The UN Environment Programme and the Institute for Transportation and Development Policy. It incorporates a vision, paired with time-bound, measurable goals, principles and standards for street design, standards for built environment, provisions for street management that prioritise NMT users, measures to enhance funding for NMT improvements and infrastructure, a stronger institutional framework for project implementation, communications initiatives to build support for NMT initiatives and gather public input during the planning process; and performance measures to monitor the effectiveness of the policy (151). The city development also relies on the Lagos State Strategic Master Plan which was developed by LAMATA. In 2002, the Lagos Urban Transport Project, was launched to revamp and modernise public transport. The World Bank project comprised of institutional reform, road rehabilitation, and bus operations improvements. It also included the introduction of a dedicated busway corridor, known as the BRT Lite. 7.2.1 Urban Mobility Trajectory Lagos residents rely predominantly walking together with informal paratransit and buses regulated by LAMATA and Lagos Bus Services Limited (151). However, private car ownership is growing at an annual rate of approximately 7% (24). Table 9: Summary of urban mobility actions in Lagos Mobility Action General Status Activity Nigeria intends to increase the share of walking and cycling to at least 50% of all trips, and to maintain this level (or greater) over a 15-year period. LAMATA has supervised the provision of pedestrian walkways in some parts of the city. The existing mobility system does not serve women, the disabled and the elderly, however there are ongoing efforts to improve the status quo. LAMATA has proved to be a relatively successful endeavour to consolidate related transport mandates to one authority and 49 AFRICA URBAN MOBILITY OBSERVATORY – POLICY AND PLANNING INSIGHTS REPORT Mobility Action General Status challenges in connecting urban planning, land use, urban infrastructure and urban transport planning may soon be addressed. According to data collected by UN-Habitat, accessibility to public transport is at 38.11% in Lagos. Other cities in Nigeria like Oyo and Gombe have lower ratings. The recently updated NDC and the National Action Plan on Gender and Climate set a strong focus on policy level for better inclusivity. Safety The federal Road Safety Corps is funded in the national budget and has a road safety strategy. There is no mention of road safety in the National Development Plan 2021-2025. Structure Slums are estimated to house 75% of the city's population. There is an absence of effective land use management and housing policies. Lagos State still struggles with institutional capacity and funding for the management of transport infrastructure. Over a third of all trips in the city are made by NMT modes. Lagos has a strong commitment to NMT, with an official NMT policy that aims to support increased walking and cycling, by creating a safe and comprehensive network of footpaths, cycle tracks, greenways, and other NMT facilities. Fuels and vehicles Namibia and Nigeria are among the countries using fiscal measures or tougher fuel economy measures in an effort to reduce fuel consumption. However, vehicle imports are the second largest import category in Nigeria, and growing rapidly 7.2.2 Barriers to Sustainable Mobility Solutions Nigeria’s transport infrastructure is limited by a lack of comprehensive funding, an unclear regulatory framework, and a lack of multimodality (147). According to the African Transport Policy Program (SSATP), institutional shortcomings in the transportation system in Lagos could be attributed to (24): • Absence of a well-articulated and adopted policy and strategic framework for the transport sector; • Inappropriately mandated and under-resourced institutions leading to the inefficient provision of underregulated services; • Fragmentation and duplication of institutional responsibilities among the various bodies and levels of government; • Lack of inter-agency coordination among the various bodies; • Absence of standard procedures for the technical and economic evaluation of programs and projects. 7.2.3 Recommendations and Insights Despite the challenges, there are a number of actions that have been taken by both the national and local authorities in Nigeria and Lagos respectively, including the development of relevant policies for walking and cycling, a dedicated road safety agency, and the Clean Energy Transport Scheme. However, there are some urgent gaps that need to be filled in order to ensure a sustainable mobility pathway. Beyond the policy recommendations elaborated on in Deliverable 4, the following non-exhaustive list which is comprised of an analysis of the mobility situation, as well as insights from a study conducted by the Africa Transport Policy Program, includes some actions that could strengthen the pathway to sustainable urban mobility, together with a greater focus on transport orientated development: Clarification of government mandates and functional roles There is plethora of organisations working on transport at all three levels in Nigeria and Lagos. A clarification of mandates and functional roles has the potential to foster cooperation and deepen the already existing synergies (24). The National Transport Policy could be supported through the institution of a common urban public transit strategy to help align planning and implementation across relevant Federal, State and Local departments and agencies both in transport and urban planning. These efforts could also better align 50 AFRICA URBAN MOBILITY OBSERVATORY – POLICY AND PLANNING INSIGHTS REPORT transport activities with those of the Ministry of Lands, Survey and Urban Planning. The experience of LAMATA demonstrates the possible impact of merging appropriate planning, regulatory and implementation responsibilities in a single organisation. The development of a new regulatory framework in line with the National Development Plan could aid this clarification process. Create platforms of engagement for coordination between Government agencies and civil society Platforms of engagement and communication can bring decision makers closer to the needs of people who walk and cycle or rely on public transport. When there are mechanisms in place to elevate the voices of transport system users, it becomes easier to address the needs of vulnerable groups including women, children, the elderly and people with disabilities. Lagos could draw inspiration from KARA recently worked with the Nairobi City County to pass the Nairobi City County Community and Neighbourhood Associations Engagement Act which sets out a formal framework of cooperation between resident associations and the city to deliver services (24). Establish an urban mobility data collection and analysis observatory Reliable and regularly collected data is an essential component of evidence-based urban transport planning and management. The establishment of a mobility data collection and analysis observatory is not only a core output of the AUMO project but also a suggested intervention of the Africa Transport Policy Program. This data will assist in city spatial and settlement planning including zoning schemes and TOD frameworks. Prioritise non-motorised transport and public transport Infrastructure for NMT is nearly non-existent in city centres, despite the majority of the population (particularly the poor) being reliant on NMT. Lagos has already shown initiative by beginning the process of creating a NMT Policy, aimed at increasing accessibility, by prioritising the use of walking, cycling, and public transport. 51 AFRICA URBAN MOBILITY OBSERVATORY – POLICY AND PLANNING INSIGHTS REPORT 8. Maseru, Lesotho Lesotho has a mostly young population of about 2.1 million (154). The small mountainous country is landlocked (surrounded by South Africa). The country is divided into the lowlands, highlands, Senqu river valley and the foothills. Fifty eight percent of the population live in the rural parts of the country (155). Lesotho‘s nominal GDP per capita is US$1,118 (154). Generally classified as a lower-middle-income country, its economic growth has been slow in recent years and is very closely tied to South Africa’s economic progress. Although unemployment levels are high, inequality and poverty have decreased from 2002 to 2017 (154). Lesotho’s main natural resources are water and diamonds (155). Available reports suggest that over a million people (57.1% of Lesotho’s population) live below the national poverty line, and a large portion of the population are impacted by HIV and AIDS (156). For this reason, reducing poverty, ensuring food security, and addressing the HIV and AIDS pandemic are national development priorities. 8.1 National Policy Frameworks Lesotho is constitutional monarchy. It is ruled by a king and a Prime Minister as Head of Government. It is governed by a 33-member Senate and a 120-member National Assembly. Lesotho is divided into 10 districts, namely: Berea, Butha-Buthe, Leribe, Mafeteng, Maseru, Mohale's Hoek, Mokhotlong, Qacha's Nek, Quthing, and Thaba-Tseka. The districts are further subdivided into 80 constituencies, which consist of 129 local community councils. In recent years, policies, plans and development strategies have been centred on Lesotho Vision 2020 and the Lesotho’s NSDP I. The latter aimed to provide infrastructure that will support private sector development, inclusive growth, service delivery, job creation and also enhance trade between districts. It set out to build climate resilience by developing climate-proof transport systems, however, extreme weather events undermined infrastructure development, and the limited amount of infrastructure continues to result in the isolation of a large part of the population (155). The country has had some political instability owing to several election cycles and coalition government structures (155). Institutional bodies for transport and urban planning in Maseru are fragmented. They face challenges characterised by overlap, duplication and a lack of coordination (157). The leading agencies are: • The Ministry of Public Works and Transport (MoPW&T); ï‚š Legal and regulatory issues about transport in general. Within the ministry, the Department of Planning is responsible for the overall strategic transport planning of the ministry; • The Ministry of Local Government and Chieftainship (MoLG&C); ï‚š Land allocation in coordination with traditional chiefs. Aim to promote, deepen and consolidate a sustainable and effective system of local governance for improved service delivery and enhanced quality of life; • The Department of Lands, Surveys, and Physical Planning (LSPP) and the Deeds Registry; ï‚š Planning and registering land in Lesotho; • The Traffic Department; ï‚š Issuing driving licenses, vehicle registration, and road transport permits; regulating public transport operations; licensing of public transport vehicles and drivers; authorising routes and fares; enforcing regulations and operations, and conducting other such activities as provided for by the Road Transport Act; • The Department of Traffic and Transportation (DTT); ï‚š In charge of urban transport policy and regulations, including: developing transport legislation, developing transport plans, policies, and codes, regulating fees and licensing, developing and promulgating road safety policies, and coordinating safety; • The Roads Fund (Ministry of Finance); ï‚š Independent body administering dedicated financial resources, financing, and audits for major roads construction and maintenance; 52 AFRICA URBAN MOBILITY OBSERVATORY – POLICY AND PLANNING INSIGHTS REPORT • The traffic police are in charge of enforcement and traffic management; • The Lesotho Land Administration Authority and LSPP; ï‚š Responsibility for land use planning. Due to contradictions between land planning and local government/land development legislation and given historical responsibilities for planning, the lines of authority and responsibility between the LSPP and the MCC are blurred. Nationally, 26% of the total road network (total is 6,906 km) is paved (1,799 km) – the majority of the unpaved network lacks regular maintenance (157). Maintenance is funded through the Road Fund, whilst upgrading and new roads are financed under the capital budget and donor funds. There was some progress in the implementation of NSDP I. 231 kms of roads were upgraded, 18 footbridges and seven drainage structures were constructed, and more than 14,200 jobs were created for unskilled labourers (155). The second plan, NSDP II (draft), identifies Four Strategic Super Goals, which include promoting inclusive and sustainable growth, strengthening human capital, building enabling infrastructure and strengthening governance and accountability. These Super Goals have the mainstreamed themes of climate change, environment and gender. There are a number of strategic objectives and interventions outlined in NDSP II. They are indicated in Table 10. Table 10: Sustainable Quality Transport Network Strategic Objectives set out in Lesotho's Draft NSDP II Strategic Objective Intervention / Actions Enhance an enabling environment for road infrastructure development (a) Review Roads Act of 1969 and its subsidiary laws (b) Develop Road Infrastructure Asset Management Policy (c) Develop the Road Infrastructure Financing Policy & Strategy (d) Review and update the Lesotho Design Standards (e) Formulate the Construction Industry Development policy and enact the Construction Bill and develop Axle Load Control Policy (f) Harmonise land allocating legislation to observe the road reserve. (g) Develop an early warning system to provide for a reliable detection and response plan (h) Improve the M&E systems for infrastructure development. Maintain existing roads and access routes (a) Rehabilitate and maintain the existing transport infrastructure (main arterial roads) as asset recovery to climate-proof standards (b) Construct new infrastructure that conforms to environmental, clean mobility and climateproof standards (c) Introduce performance and output-based maintenance contracting system on all primary roads Improve Access to Main Towns, Key Border Posts and Productive sectors (a) Design, upgrade and construct main corridors that conform to environmental, clean mobility and climate-proof standards to key productive sectors (b) Build/or upgrade new roads to connect main towns, border posts and communities Improve Urban & Rural Transportation Systems (a) Design major intersects along main arterial roads (b) Construct climate-proof footbridges and rural roads from earth to gravel Improve management of Government physical assets (a) Develop an information management system for government assets (b) Develop a government buildings maintenance plan 53 AFRICA URBAN MOBILITY OBSERVATORY – POLICY AND PLANNING INSIGHTS REPORT Strategic Objective Intervention / Actions Improve systems and legal frameworks in Traffic and Transport Sub-sector (a) Review and enforce traffic and transport legislation. (b) Automate the services and processes for vehicle and driver licensing, including permit procedures (c) Develop the national transport master plan and a traffic management plan. (d) Develop the cross-border policy and associated laws (e) Develop targeted enabling policies and legal frameworks to empower and support the population, in particular women and youth. Improve air transport to support international trade and tourism (a) Revamp air transport services and rehabilitate strategic airstrips to support agriculture, health, manufacturing, trade and tourism development. (b) Establish a Civil Aviation Authority to enhance the sub-sector’s institutional capacity for effective operation and regulation. (c) Upgrade Moshoeshoe I International Airport infrastructure and facilities to meet ICAO standards and make it climate change resilient and carbon neutral. Improve road safety (a) Develop road safety audit and inspection guidelines (b) Develop strategies for road safety and install/renovate quality road safety signs. (c) Set and enforce standards and specifications for the importation of vehicles. (d) Review existing legislation on Vehicle Modification and Conversion to ensure safe operation of such vehicles. (e) Implement a road accident data management system to improve systematic recording and reporting of road accidents, (f) Strengthen capacity of the Road Safety officers and the National Road Safety Council to effectively discharge their mandates. (g) Raise awareness on road safety Although Lesotho was quick to respond to the urgency of the pandemic, COVID-19 is expected to lead to an increase in poverty levels and a reduction in human capital accumulation (154). The country faces a severe lack of funding for maintenance, rehabilitation, and expansion of urban transport. The cost of road maintenance in the country is also amplified by poor construction quality (157). Lesotho has not participated in the development of TechHubs across Africa, and no such structure is present in the country. ICT use is still very low among the general population, particularly in relation to Internet access (156). However, it aims to establish data centres and hubs to attract data locally and internationally and improve the use of ICT more generally (155). Lesotho has a high mobile network coverage. Most areas can access information and services through use of internet or internet-based applications, however, 3G and LTE infrastructure is underutilised, and internet speed is low (155). The Lesotho Data for Sustainable Development Project is a new project of the Government of Lesotho. 8.1.1 Climate Change and Air Quality Lesotho is among the countries that are already facing the severe consequences of climate change effects (155). In February 2021, a state of emergency was declared after heavy rains across the country damaged roads, bridges and houses (154). During NSDP II, the Government of Lesotho has committed to building climate change resilience by developing climate-proof economic and social infrastructure, and transport systems. The National Climate Change Policy 2017-2027 (NCCP), approved in 2018, is the main policy lever in addressing climate change related challenges. The main ambitions of the Lesotho Climate Change Policy are to: 54 AFRICA URBAN MOBILITY OBSERVATORY – POLICY AND PLANNING INSIGHTS REPORT • promote climate-resilient, social, economic and environmental development; • explore low-carbon development opportunities, nationally and internationally, in order to promote the sustainable use of resources; • strengthen a framework that promotes climate change governance, international cooperation, capacity building, research and systematic observations, clean technology development, transfer and use, education, training and public awareness. While like the DRC, most policy priorities and actions are geared towards agriculture, policy Statement 11 of the Climate Change Policy, however, is a commitment to the promotion of low carbon and climate resilient transport systems. The key principles are indicated as identifying the needs for efficient transport systems as the fundamental basis for the amelioration of the quality of air, reduction of GHG emissions and promotion of clean energy sources; and recognising the need for advocacy of legal and regulatory measures related to emissions from transport system (158). Some of the interventions indicated in order to achieve these objectives are highlighted below: • Conduct studies and research on vulnerability to the impacts of climate change and contribution to the global GHG emissions of the transport system; • Establish disaggregated transport data collection and management systems; • Strengthen the roads standards in order to climate-proof roads infrastructure; • Improve fuel efficiency and adopt green technologies in the transport sector with the objective of mitigating GHG emissions; • Improve and encourage the use of public transport; • Encourage use of motorcycles and bicycles; • Establish an institutional and regulatory framework to monitor and regulate GHG emissions from the transport sector. Information on the status of air quality policy formation and actions in Lesotho is difficult to source. Currently, the Environment Act 2008 (No. 10 of 2008) regulates pollution. The legislation makes reference to environmental action plans on local and national levels and taking action to reduce existing sources of air pollution. 8.1.2 Accessibility and Safety Lesotho has high fatality rates in densely populated districts, and many road accidents in the mountainous terrains (155). Lesotho’s annual fatality rate is 28.9 per 100,000 people (154). The Road Safety Department conducts annual campaigns on speed management, drinking and driving, and the use of seat belts. Lesotho’s lead road safety agency, the National Road Safety Council (2018) is funded in the national budget. NSDP II specifically highlights the patriarchal structure of Lesotho’s society. In 2016, it ranked 57 out of 144 countries on gender inequality. NSDP II aims to ensure that gender is mainstreamed in public policy and implementation (155). The draft plan states that focus will be given towards mainstreaming gender and disability in infrastructure projects to ensure gender-responsive and non-discriminatory practices. Currently as set out in the NSDP II, “there are no systematic inclusion procedures for transport either in terms of training of professionals, the participation of users or the design and planning of systems, services and equipment for the disabled people in Lesotho.†The Climate Change Strategy, however, identifies the need to promote participation of gender, youth and vulnerable groups in climate change related planning and decision making (158). It also emphasises the importance of gender-responsive policies and plans as a key objective. 8.2 Maseru Mobility Landscape Walking is the most common travel mode in Maseru. It is estimated that over 50% of workers in low-income areas walk to work for distances of three to five km daily. However, footpaths are not fully developed, and in general, drainage is not adequate on urban roads (159). 55 AFRICA URBAN MOBILITY OBSERVATORY – POLICY AND PLANNING INSIGHTS REPORT It is predicted that by 2030 the Maseru Planning Area and its surrounding population will double (155). Rapid population increases and urban development is leading to low density settlements (1,650 per km2 ). This is likely to make sustainable urban transport investment more expensive and difficult to achieve (157). There are 4 levels of local government structures which are namely – District, Municipal, Urban and Community Councils. The Maseru City Council was declared as a local authority in 1989 under the Urban Act of 1983. Its work in terms of mobility is informed by the Maseru City Council Strategic Plan, the Maseru Development Plan and several other documents developed by the Lesotho Housing Development Corporation and others. However, MoPW&T is the primary authority responsible for overseeing transport related matters in the city. Both the Department of Lands, Surveys and Physical Planning (LSPP) and the Maseru City Council have authority in developing planning and investing in transport modes. Responsibility for urban and district roads lies with Local Assemblies who report to the Ministry of Local Government and Rural Development. However, due to limited capacity and coordination challenges, most district roads are managed by the Ministry of Transport and Public Works (159). Several plans have been prepared in order to improve mobility and land use planning in Maseru, but they are outdated, and status of implementation is unclear. This may be due to the fact that the plans did not follow the correct legal procedures and approval mechanisms. Recent reviews indicate however that none of these plans have been implemented as result of a lack of political will, administrative and financial support, and as lack of institutional capacity, at almost all levels of government (160). Table 11: History of Development Plans in Maseru Plan Date Developed Adopted Revision Maseru Development Plan 1989 1994 None Maseru CBD West Local Plan 1994 NA None Maseru CBD East Local Plan 1994 NA None The Maseru Urban Planning and Transport Study 2010 NA None This table is adapted from a paper prepared for presentation at the “2019 Land Governance in Southern Africa Symposium†Coordinated by the NUST-NELGA Hub Conference. The Paper “Land Governance in Lesotho is written by R.C Leduka, M Ntaote and S.N Takalimane from the National University of Lesotho. The Maseru Urban Planning and Transport Study (MUP&T Study) was conceived under the auspices of the Ministry of Public Works and Transport. Although it has never been legally approved, it has been cited as a fundamental tool in addressing the planning challenges in Maseru (160). Maseru Master Plan Readiness Study has been completed. This study has highlighted the need for the development of a National Urban Policy and the National Spatial Development Framework. With the current urbanisation rate, these frameworks will be important in guiding the spatial distribution of people, resource, as well as the use and consumption of land. 8.2.1 Urban Mobility Trajectory Generally speaking, land use planning in Maseru, together with transport planning is without coordination and systematic financing. As a result of poor planning the major settlement problem in Lesotho is haphazard urban sprawl (160). Urban expansion has surpassed the city administrative boundaries. There is no established agency on a city level with overarching responsibility for urban transport and no dedicated department of transport in the city government structures (145). Overall, there has been little emphasis on pedestrian access and the role of public transport. Where measures for bus travel have been introduced, they are not properly managed (145). Table 12: Summary of urban mobility actions in Maseru 56 AFRICA URBAN MOBILITY OBSERVATORY – POLICY AND PLANNING INSIGHTS REPORT Mobility Action General Status Activity Although Maseru has a number of planning documents for several areas of the city, there is little evidence that they have been actioned. There is no data for SDG 11.2 in Maseru. Safety Lesotho has a lead transport agency which is funded under the national budget. However, Lesotho’s fatality rate is 28.9 per 100,000 people and it has not signed the African Charter for Road Safety. Structure Despite walking being the primary mode of transport in the city, there is little dedicated NMT infrastructure, resulting in pedestrians having little choice but to share roads with motorised traffic Fuels and vehicles Lesotho imposes a maximum age limit on used vehicle imports of five years. The average age of imported used vehicles is unknown. The Lesotho draft Renewable Energy Policy of 2013 recommends the introduction of a range of incentives to encourage the transition to electric vehicles. 8.2.2 Barriers to Sustainable Mobility Solutions According to the National Climate Change Policy, the major challenges and barriers to sustainable mobility and low carbon transport are: • Inadequate access to and dissemination of information about clean energy based transport; • Lack of efficient public transport system that will reduce GHG emissions; • Lack of disaggregated data; • Lack of efficient transport technologies; • Lack of climate proofed road infrastructure to withstand extreme weather events. 8.2.3 Recommendations and Insights Policies, regulations and implementation methodologies across agencies in Lesotho are unclear and outdated. In order to make the most of the new development policies, there are some urgent gaps that need to be filled to ensure a sustainable mobility pathway. Beyond the policy recommendations elaborated on in Deliverable 4, the following non-exhaustive list, which is comprised of an analysis of the mobility situation as well as insights from a study conducted by the World Bank, includes some actions that could strengthen the pathway to sustainable urban mobility, together with a greater focus on transport orientated development: Meet the needs of the poor Due to the lack of accessible transport and spatial expansion, a large portion of the population lives far away from formal job opportunities (145). An integrated land use planning, housing and mobility strategy is required, with a realistic implementation process to connect the urban to the rural and address urban sprawl. Improve institutional management of urban transport systems The procedures and regulatory frameworks in Lesotho have stunted the implementation of development policies. Further, there are unclear intergovernmental roles and responsibilities and a lack of cooperation between the different tiers of government. There is an urgent need to improve interagency coordination through capacity development and the alignment of goals and targets. Even though many of the provisions and goals geared towards sustainable urban mobility are strong, weak governance will impede their success (144). Partner with other cities or international organizations to improve capacity development on clean transport 57 AFRICA URBAN MOBILITY OBSERVATORY – POLICY AND PLANNING INSIGHTS REPORT As Lesotho relies mostly on clean energy sources there is an opportunity to leapfrog to electric mobility. However, a precondition to this step is a focus on efficient modes like walking, cycling and public transport. Establish an urban mobility data collection and analysis observatory. The exact status of urban mobility in Lesotho is largely unknown. Reliable and regularly collected data is an essential component of evidence-based urban transport planning and management. The establishment of a mobility data collection and analysis observatory would greatly assist in the development of contemporary plans and strategies. This data will assist in city spatial and settlement planning including zoning schemes and TOD frameworks. 58 AFRICA URBAN MOBILITY OBSERVATORY – POLICY AND PLANNING INSIGHTS REPORT 9. AUMO City Analysis This research has revealed that there have been multiple efforts to address the mobility challenges in the cities selected for this study. It has also highlighted, however, that collecting accurate, comparable and reliable data on the status of mobility performance and thus the mobility pathways enumerated in the various policy levers, remains a challenge. There are few consistent methodologies or up to date data sets. For this reason, amongst others including differences in typography, history and institutional set-ups, comparison and benchmarking both in, and between these cities, is a challenge (3). Although the data is at this stage limited, the AUMO project is a first step in transforming the role of data in decision making for the selected cities. It has the potential to empower local and national authorities to make decisions for the constituents that they represent through comprehensive policy and action informed by real needs and demands. As noted in the Paratransit report, the desired sample size has not yet been reached in each of the AUMO cities. Therefore, the results considered below should not be interpreted to be reflective of the entire population of the city but instead as an opportunity to understand how this form of data collection and presentation has the potential to support pathways to sustainable mobility if applied at scale. This is significant, since there are several ongoing efforts by local and national governments to integrate comprehensive data sets and ICTs with planning and decision making. For the financial year 2020/21 in Malawi, for example, funds were specifically set aside for information technology and communication in the transport sector. In Botswana, both the ICT and transport sectors are currently undergoing sector reforms to adapt to trends in technology and services. Rwanda has also committed to becoming a data-driven economy (121). The next segment of this report highlights some data collected in the first phase of the AUMO project. The intention here is to do an initial benchmarking, analyse on a microscale and to illustrate the potential comparability when applied at scale. With regard to public transport in the AUMO cities, while they lack formality, high levels of comfort (Figure 9) and standardised levels of service, informal transport supports the majority of daily trips and can be modernised incrementally. The perception data below indicates that in cities like Kigali (312/357) and Kinshasa (601/762), individuals feel that the comfort level experienced in public transport vehicles is generally “acceptable.†While in Blantyre (168/455), more people feel that the comfort level is poor. This data assists in determining policy priorities in modernising the fleet should city officials choose to. Figure 9: AUMO Data collected on perceived level of comfort of public transport vehicles. The data sets enable granular information. This is specifically useful for mode share during specific times. Consultation with city officials in Malawi indicated that this form of information is incredibly valuable in determining intervention points and priority areas in addressing traffic congestion and pollution. This is vitally 0 100 200 300 400 500 600 700 Lagos Gaborone Maseru Kigali Kinshasa Blantyre Number of Respondents AUMO City Public Transport Comfort in AUMO Cities Excellent Acceptable Poor 59 AFRICA URBAN MOBILITY OBSERVATORY – POLICY AND PLANNING INSIGHTS REPORT important in instances where there are limited funds and the need to ensure measurable impact. The data displayed below (Figure 10) provides detailed information on the mobility patterns during peak and off-peak periods in the surveyed area. In the surveyed area in Gaborone, 3,65% of people walk during peak periods while 1,07% do so during off-peak. In all of the surveyed areas in every city except Kigali and Maseru, the levels of cycling are very low during both peak and off-peak times. In Kigali, up to 12,56% of people cycle during peak hours in the surveyed area. This data indicates that it is possible that in the area surveyed in Lagos, Kinshasa or Gaborone there is no supportive cycling infrastructure or it is not a common cycling route. Figure 10 also illustrates the effectiveness of the BRT in Lagos – which appears to be higher during off peak rather than peak travel times. Figure 10:AUMO data collected on mode share during peak and off-peak periods The AUMO data collected in the first phase is also an important learning and methodology development exercise. In the first set of data collection, survey respondents were asked to state whether they had witnessed or personally experienced sexual harassment while travelling on public transport. While the majority of respondents indicated that they had never experienced or witnessed sexual harassment, a considerable number of indicated that they had (see Figure 11 below). More data collection and analysis is needed in order to understand this mobility experience in the AUMO cities in full as other sources consulted in this analysis indicated higher levels of gender based violence and insecurity both generally and on public transport (66). However, it is a clear methodology for identifying problem areas in for example, Blantyre and Lagos. 0% 10% 20% 30% 40% 50% 60% 70% 80% 90% 100% Peak Off Peak Peak Off Peak Peak Off Peak Peak Off Peak Peak Off Peak Peak Off Peak Kinshasa Gaborone Blantyre Kigali Lagos Maseru Mode Share per City (Peak and Off-Peak) in AUMO cities Walking Cycling Private Transport Bus Minibus Taxi Sedan / MPV Taxi Motorbike/Tricycle Taxi BRT Ferry 60 AFRICA URBAN MOBILITY OBSERVATORY – POLICY AND PLANNING INSIGHTS REPORT Figure 11: AUMO Data collected on witnessed and experienced levels of sexual harassment while travelling on public transport It is also noteworthy that there is a lack of existing data on the mobility experience of people with disabilities or added layers of vulnerability such as age or gender. AUMO data enables comparison across gender and ability in order to understand the unique mobility experiences of these usually marginalised groups. Figure 12 indicates that more men than women in every city in this study except for Blantyre, have experienced crime while on the move. This indicates that while intervention is necessary in all surveyed areas, urgent intervention may be needed in the surveyed area in Blantyre. Figure 12: Perceptions of crime by gender in the AUMO cities 0 100 200 300 400 500 600 700 800 Lagos Gaborone Maseru Kigali Kinshasa Blantyre Number of Respondents AUMO city Witnessed and experienced levels of sexual harassment while travelling on public transport in AUMO cities often More than once Once Never 0% 10% 20% 30% 40% 50% 60% 70% 80% 90% 100% Male Female Non-Binary Male Female Non-Binary Male Female Non-Binary Male Female Non-Binary Male Female Non-Binary Male Female Non-Binary Blantyre Gaborone Kigali Kinshasa Lagos Maseru Perceptions of crime (by gender) in AUMO cities Never Once More Than Once Often 61 AFRICA URBAN MOBILITY OBSERVATORY – POLICY AND PLANNING INSIGHTS REPORT The data collected is also a good insight into the mobility patterns of different socio-economic groups and can be useful in mapping priority routes (Figure 13). In Maseru, Gaborone and Kinshasa for example, the data indicates that those with no education are travelling the furthest. This may be because they live outside of the city and need to commute from satellite settlements or the periphery for job opportunities. Figure 13: AUMO Data collected on average distance travelled per city by education level Overall, the data collected for the AUMO seeks to reveal a more comprehensive picture of the mobility systems in each of the cities. While more data is needed in order to benchmark citywide performance and determine the most important or relevant policy levers going forward, the initial information does give good insights into actionable tasks for local authorities in the areas surveyed. 0 5 10 15 20 25 30 No Education Primary School Secondary School College/University/Technical No Education Primary School Secondary School College/University/Technical No Education Primary School Secondary School College/University/Technical No Education Primary School Secondary School College/University/Technical No Education Primary School Secondary School College/University/Technical No Education Primary School Secondary School College/University/Technical Blantyre Gaborone Kigali Kinshasa Lagos Maseru Average distance (km) travelled per city (by education level) in AUMO cities 62 AFRICA URBAN MOBILITY OBSERVATORY – POLICY AND PLANNING INSIGHTS REPORT 10. Mobility Analysis The most effective initiatives towards low carbon and inclusive mobility include a combination of qualitative improvements to walking, cycling, ridesharing, and public transport services together with incentives to discourage carbon-intensive modes plus integrated transport planning and land use development (1). These measures create more compact and better-connected communities, ensuring a multitude of co-benefits and synergies. However, in many African cities, due to financial, capacity and political constraints, the development and implementation of sustainable mobility actions simultaneously is not always possible, and some trade-offs are made. Achieving the goals set by the SDGs, the New Urban Agenda and the Paris Agreement requires effective multisector implementation and coordination in order to achieve the desired the desired transformative outcomes related to inclusive urban prosperity. This is because New Urban Agenda is not only confined to the urban core of Goal 11. It is also directly related to Goals 1, 4, 7, 10, 12 and 16, as well as Aspiration 1 and Priority 4 of Agenda 2063, since African cities will contribute to the continent’s transformation agenda through modern infrastructure and services in the areas of shelter, water, sanitation, energy, public transport and ICT (161). Figure 14: Implementing the New Urban Agenda for Africa's transformation - Policy and Implementation priorities (161) Although there is significant variability amongst the cities included in this study, all have to some extent dealt with the elements of low carbon and inclusive mobility in varying degrees and methodologies. There are some common trends concerning urban mobility and transport systems and some identifiable positive and negative pathway trajectories. 10.1 Ensuring Positive Urban Mobility Pathways A lack of liveability and walkability, disconnections, low densities, and unbalanced private and public spaces, exacerbate socio-economic segregation, and make it impossible to avoid long and expensive commuting patterns (161). It is important to promote safe, inclusive, accessible, green and quality public spaces, including streets, sidewalks and cycling lanes, squares, waterfront areas, gardens and parks, that are multifunctional areas. Cities that prioritise short travel distances, public space, compact cities and mixed land use are on their way to a sustainable mobility pathway. Learning from Curitiba, Johannesburg and other TODs examples noted earlier, the following key issues should be taken into consideration when implementing TOD in African cities: 63 AFRICA URBAN MOBILITY OBSERVATORY – POLICY AND PLANNING INSIGHTS REPORT • The TOD concept needs to be embedded in the local context, taking into consideration spatial patterns, socio-economic conditions and institutional landscapes; • There is need for a strong central vision for urban transformation and political leadership; • A successful TOD needs adequate institutional capacity to effectively integrate urban planning components and multi-sectoral elements; • Local governments need to provide frameworks and associated strategies through which competing interests can be resolved and through which stakeholders can work towards a joint vision; • A good framework for land value capture opportunities is needed by ensuring the collaboration between public, private and society partners; • There is need for equitable TOD to ensure that the approach achieves inclusion, community support and participation – so that all people are able to experience the benefits of dense, mixed-use, pedestrianoriented development near transit hubs. There is incredible potential for improvement concerning the layout and maintenance of public space based on the needs of people who walk and cycle in urban areas of Africa (144). All of the cities included in the AUMO observatory study have a high modal share of NMT. However, not all have taken active steps to ensure that people who walk and cycle (often because they have no other choice) are prioritised in mobility systems. Kigali and Lagos have taken active policy steps to ensure that people who walk and cycle are protected through policy and could serve as an example in ensuring effective sustainable mobility policy levers in this regard. Although there are some challenges with systematic implementation, both cities, Kigali specifically, have created an enabling environment for people who walk and cycle through national and local policy and infrastructure upgrades. Few cities in Africa have a comprehensive and strong single authority to deal with urban mobility and transport (144). A city level transport authority can plan strategically and react to urgent needs more dynamically. While Maseru and other cities in Africa like Kigali and Lusaka do not have a dedicated transport agency responsible for transport and rely on departments within the city authority, Lagos and other cities like Dakar and Casablanca do. Having one agency (normally at the metropolitan level or city level) that leads the planning and implementation of transport strategy is a way to advance accessibility goals and improve technical and financial capacities and reduce miscommunication of authority (162). While in Lagos, LAMATA does face significant challenges in an ever changing and complex landscape, it along with similar organisations can go a long way in defragmenting the environment in which they function and can deliver localised solutions – particularly when supported and empowered through engagement with community groups and civil society. Affordability, safety and inclusiveness of available urban transport options is a major concern. However, almost all of the cities in this study are taking active steps in policy to establish a more inclusive urban mobility future through comprehensive visioning documents at the national level to policies developed at a more localised scale. These have the potential to ensure inclusive urban development. As highlighted in Deliverable 4, Malawi is Africa’s second country to adopt carbon tax, after the continent’s highest emitter, South Africa. The tax acts as a carbon pricing mechanism to raise funds to drive climate change mitigation and adaptation actions at both the national and community level. This measure together with the vehicle and fuel standards employed by Kigali, Gaborone, Lagos and others assist in ensuring that fuel and vehicle standards are prioritised. Although the modernisation of public transport and paratransit is not discussed in depth in this deliverable, Cape Town, Johannesburg, Accra and Dar es Salaam prove that if properly regulated, the paratransit sector can play a significant role in providing safe, inclusive and reliable transport (144). 10.1.1 Preventing Negative Pathways Despite the formation of comprehensive policies in most of the cities in this study, there are a number of existing negative mobility scenarios, that if not acted upon with urgency, will develop into negative mobility pathways. Thankfully, in recent years there has been a surge in research, policy formation and resource 64 AFRICA URBAN MOBILITY OBSERVATORY – POLICY AND PLANNING INSIGHTS REPORT mobilisation to address the status quo and drive mobility towards being more inclusive and climate conscious. Some of the possible negative pathways are indicated below – however, it must be noted that new policy directives, if implemented effectively do address these core concerns. • One of the most urgent negative impacts of existing transport development pathways in African cities is poor road safety. The majority of persons killed on the roads are young adults, with vulnerable road users – pedestrians, cyclists and motorised 2- and 3-wheelers – constituting more than half of the total number of fatalities (144); • Many of the cities in this study consist of fragmented neighbourhoods that lack reliable transportation (135). African cities are 20% more fragmented than comparable Asian and Latin American ones (163). This is certainly the case for Maseru, Lagos Blantyre, Kinshasa and Gaborone. The metropolitan area of Lagos, for example, now extends beyond the borders of Lagos State into the neighbouring Ogun state in the north (152). Due to the sprawling nature of unplanned urban development, the authorities have had difficulty in meeting the service demands. The metropolitan area of Lagos now extends beyond the borders of Lagos State into the neighbouring Ogun state in the north; • Increasing traffic volumes and congestion in all of the cities involved in this study, contribute to air and noise pollution. All African cities that monitor air pollution significantly above the level recommended by the WHO (144). While there are efforts to improve air quality the lack of reliable data makes it difficult to identify priority areas; • The lack of integrated land-use planning is a considerable threat to efficient mobility and sustainable urban development (144). As is the prioritisation of vehicle movement. In the case of the latter, the common solution to easing improving vehicle flows is to build more road capacity instead of addressing inefficient land development, poor roadway design and non-motorised transport facilities (145). Investing in infrastructure for cars in urban spaces is an expensive environmental, social and economic endeavour (145); • When the lines of authority and responsibility are blurred it limits the possibility of implementing multimodal plans because there is no single authority and approving level for planning, investment, and regulation of all transport modes (145). This is a challenge faced by Maseru as well as other African cities including Lusaka and Harare. In Harare, the responsibility for transport infrastructure and services falls under six different ministries. Identifying appropriate funding mechanisms and the implementation of plans often seems to be where the momentum for sustainable mobility pathways comes to a halt. Many of the plans developed (for example the Nigerian SLCP Plan) are operationalised without existing funding mechanisms. They then rely on future national budgets being committed, domestic resource mobilization and resources from international donors and the private sector. 65 AFRICA URBAN MOBILITY OBSERVATORY – POLICY AND PLANNING INSIGHTS REPORT 11. Conclusions Intra- and inter-city learning and capacity building, particularly in the transport sector can help to leapfrog to sustainable mobility solutions. Although many African countries are among the smallest contributors to climate change, their increased vulnerability means that they will be (and already are) impacted by the consequences of climate change. Further, low-carbon transport strategies can help achieve other economic, social, and environmental objectives. Decarbonising transport requires deliberate strategy and action. This action includes everything from planning, modal shift, innovation in technology, and clean fuels and vehicles. Isolated actions will fall short in delivering on climate and wider sustainable development objectives. While extremely varied, African cities have several shared governance challenges, and all are still in the phase of addressing the critical preconditions for the delivery of urban mobility services. Namely, human-centred, inclusive, and multilevel governance approach, integrated urban development and appropriate legislative frameworks and enforcement mechanisms and coordinated action. Advancing the urban agenda in Africa depends on each country’s specific context and prevailing situations. However, maintaining current shares of low-carbon modes is an important short- to medium-term measure that can be implemented across of all the cities analysed in this study. Global evidence suggests that economic growth can be decoupled from motorisation (car use). Transport policy in Africa is beginning to meaningfully recognise the fundamental role of walking and cycling and integrated mobility solutions in sustainable transport systems. Despite significant differences in mode shares and travel patterns in Blantyre, Gaborone, Kigali, Kinshasa, Lagos and Maseru, the strategies to move toward sustainable urban mobility are similar. It constitutes the balance between different types of interventions focused on land use planning, transport orientated development, climate change and air quality as well as accessibility and safety. Vehicle efficiency improvements and technology shift are of course fundamental and require strong measures by national governments. While it is often said that modal shifts require substantial investments in infrastructure and services, in the case of the cities in this study, modal retention of those already walking and cycling, or using public transport, requires equal investment and prioritisation – if not more. 66 AFRICA URBAN MOBILITY OBSERVATORY – POLICY AND PLANNING INSIGHTS REPORT 12. References 1. Lah O, editor. Sustainable Urban Mobility Pathways: Policies, Institutions and Coalitions for Low Carbon Transportation in Emerging Countries Amsterdam: Mara Conner Acquisition; 2019. 2. UN-Habitat. Regional Representation for Africa 2020-2023 Strategic Plan. ; 2021. 3. Cirolia LR, Harber J, Croese S. Governing mobility in Sub-Saharan African cities. The state of knowledge and research. Gothenburg:; 2020. 4. Bloomberg. Paris Will Ban Through Traffic in City Center. [Online].; 2021. Available from: https://www.bloomberg.com/news/articles/2021-05-13/new-paris-car-ban-will-target-through-traffic. 5. Internaitonal Energy Agency. Vehicle Excise Duty (VED). [Online].; 2017 [cited 2022 February 24. Available from: https://www.iea.org/policies/1683-vehicle-excise-duty-ved. 6. Autocar. Car tax: everything you need to know about vehicle excise duty. [Online].; 2021 [cited 2022 February 24. Available from: https://www.autocar.co.uk/car-news/advice/car-tax-everything-youneed-know-about-vehicle-excise-duty0#:~:text=Vehicle%20Excise%20Duty%2C%20known%20as,central%20coffers%20of%20the%20excheq uer. 7. Bocarejo JP. Congestion in Latin American Cities Innovative Approaches for a Critical Issue Discussion Paper. Paris: ITF; 2020. Report No.: 2020/28. 8. Bonilla JA. The More Stringent, the Better? Rationing Car Use in Bogotá with Moderate and Drastic Restrictions. The World Bank Economic Review. 2019; 33(2). 9. Times of India. The Times of India. [Online].; 2021. Available from: https://timesofindia.indiatimes.com/city/delhi/ready-to-enforce-odd-even-if-neededgahlot/articleshow/87767178.cms. 10. Olivera M. C40 Cities. [Online].; 2017. Available from: https://www.c40.org/news/increased-vehiclerestrictions-are-the-latest-move-in-mexico-city-s-25-year-fight-against-air-pollution/. 11. Ueckermann TM, Venter C. International Experience with Road and Congestion Pricing and Options for Johannesburg. In Proceedings of the 27th Southern African Transport Conference (SATC 2008); 2008; Pretoria: Document Transformation Technologies cc. 12. ICG. From car-free days to pollution-free cities Reflections on clean urban transport in Rwanda. ; 2021. 13. ABD and GIZ. Introduction to Congestion Charging: A guide for Practitioners in Developing Cities. ; 2015. 14. Eggers WD, Samuel P, Munk R. Combating Gridlock: How pricing road use can ease congestion. ; 2003. Report No.: 1-892384-76-4. 15. AbuLibdeh A. Traffic Congestion Pricing: Methodologies and Equity Implications. In Yaghoubi H, editor. Urban Transport Systems.: IntechOpen; 2017. 67 AFRICA URBAN MOBILITY OBSERVATORY – POLICY AND PLANNING INSIGHTS REPORT 16. Transport for London. Transport for London. [Online].; 2021. Available from: https://tfl.gov.uk/modes/driving/ultra-low-emission-zone. 17. Cruz C, Montenon A. Implementation and impacts of low emission zones on freight activities in Europe: Local schemes versus national schemes. In The 9th International Conference on City Logistics, Tenerife, Canary Islands (Spain), 17-19 June; 2016: Transportation Research Procedia. 18. Urban Access Regulations. Urban Access Regulations in Europe. [Online].; 2022. Available from: https://urbanaccessregulations.eu/component/content/article/172-faq/853-how-can-i-buy-a-germansticker-if-i-live-outside-germany?Itemid=101. 19. C40 Cities. C40 Cities. [Online].; 2019 [Implementation Guide]. Available from: https://www.c40knowledgehub.org/s/article/How-to-design-and-implement-a-clean-air-or-lowemission-zone?language=en_US. 20. Department for Transport (UK). Government Response to Call for Evidence: The Last Mile – Delivering goods more sustainably. [Online].; 2019 [cited 2022 February 24. Available from: https://assets.publishing.service.gov.uk/government/uploads/system/uploads/attachment_data/file/7 86879/last-mile-call-for-evidence-government-response.pdf. 21. ITDP. Streets for Walking and Cycling Designing for Safety, accessibility and comfort in African cities. Nairobi:; 2018. 22. Bloomberg. Bloomberg. [Online].; 2020. Available from: https://www.bloomberg.com/news/articles/2020-01-29/use-cultural-attractions-to-boost-car-freetravel. 23. UN-Habitat. UN-Habitat UNRSF Ethiopia Road Safety Project. ; 2020. 24. SSATP. Nigeria - Sustainable Mobility and Accessibility Policy in Urban Areas. Nigeria Federal Ministry of Transport; 2020. 25. Nyachieo GM. T2M: Transport, Traffic & Mobility. [Online].; 2018. Available from: https://t2m.org/exploring-public-road-passenger-transport-in-kenya/. 26. Holt L, Hook W, AnnieWeinstock , Kost C, Bhattacharjee D. Quick Guide to Bus Sector Modernisation. ; 2020. 27. Barter P. On-Street Parking Management: An International Toolkit. ; 2016. 28. ITDP. Demand responsive parking in African cities. [Online].; 2021. Available from: https://africa.itdp.org/demand-responsive-parking-in-african-cities/. 29. Business Daily. Nairobi on list of worst places to park. [Online].; 2011. Available from: https://www.businessdailyafrica.com/bd/corporate/companies/nairobi-on-list-of-worst-places-topark--1993208. 30. GIZ and SUTP. On-Street Parking Management an International Toolkit. ; 2017. 68 AFRICA URBAN MOBILITY OBSERVATORY – POLICY AND PLANNING INSIGHTS REPORT 31. ITDP. How Mexico City Became A Leader in Parking Reform. [Online].; 2017. Available from: https://www.itdp.org/2017/07/26/mexico-city-became-leader-parking-reform/. 32. Hansher DA, Thomas G. Bus rapid transit systems: a comparative assessment. Transportation 35. 2008 March 12;: p. 501-518. 33. Wright L. Bus rapid transit. Sustainable transport: a sourcebook for policy-makers in developing cities. Eschborn: Deutsche Gesellschaft für Technische Zusammenarbeit (GTZ); 2002. 34. Wright L. Bus rapid transit Eschborn: Deutsche Gesellschaft für Technische Zusammenarbeit (GTZ); 2002. 35. Lindau AL, Hidalgo D, Facchini D. Bus Rapid Transit in Curitiba, Brazil. Transportation Research Record: Journal of the Transportation Research Board.. 2010;: p. 17-27. 36. Chengula DH, Kombe K. Assessment of the Effectiveness of Dar Es Salaam Bus Rapid Transit (DBRT) System in Tanzania. International Journal of Sciences: Basic and Applied Research (IJSBAR). 2017;: p. 10-30. 37. SSATP. Lagos Bus Rapid Transit. [Online].; 2009. Available from: https://www.ssatp.org/sites/ssatp/files/publications/SSATP-DiscussionPapers/DP09-Lagos-BRT.pdf. 38. Mchomvu YE. SSATP: Africa Transport Policy Program. [Online].; 2019. Available from: https://www.ssatp.org/publication/dar-es-salaam-bus-rapid-transit-brt-system-implementationoverview-and-challenges. 39. ITDP. Planning Mombasa's Public Transport System. [Online].; 2020. Available from: https://africa.itdp.org/planning-mombasas-public-transport-system/. 40. ITDP. Dar es Salaam, Tanzania Wins 2018 Sustainable Transport Award. [Online].; 2017. Available from: https://www.itdp.org/2017/07/07/dar-es-salaam-wins-2018- sta/#:~:text=Dar%20es%20Salaam%20is%20the%20first%20African%20City,a%20major%20port%20cit y%20on%20the%20Indian%20Ocean. 41. Klopp JM, Harber J, Quarshie M. VREF. [Online].: http://www.vref.se/download/18.45182a5f16a84e95fac6750a/1560236438940/A%20Review%20of% 20BRT%20as%20Public%20%20Transport%20Reform%20in%20African%20Cities.pdf; 2019. Available from: http://www.vref.se/download/18.45182a5f16a84e95fac6750a/1560236438940/A%20Review%20of% 20BRT%20as%20Public%20%20Transport%20Reform%20in%20African%20Cities.pdf. 42. Shulman K. MIT News. [Online].; 2015. Available from: https://news.mit.edu/2015/digital-matatusproject-makes-invisible-visible-0826. 43. Williams S, White A, Waiganjo P, Orwa D, Klopp J. The digital matatu project: Using cell phones to create an open source data for Nairobi's semi-formal bus system. Journal of Transport Geography. 2015;: p. 39-51. 44. United Nations. UN. [Online].; 2020. Available from: https://www.un.org/sustainabledevelopment/climate-change/. 69 AFRICA URBAN MOBILITY OBSERVATORY – POLICY AND PLANNING INSIGHTS REPORT 45. Forster P. Covid-19 paused climate emissions – but they're rising again. [Online].; 2021 [cited 2022 February 24. Available from: https://www.bbc.com/future/article/20210312-covid-19-paused-climateemissions-but-theyre-rising-again. 46. Climate Reality Project. The Climate Reality Project. [Online].; 2019. Available from: https://www.climaterealityproject.org/blog/how-climate-crisis-impactingbangladesh#:~:text=It%20has%20been%20estimated%20that,of%20sea%2Dlevel%20rise%20alone. 47. Moretti L, Loprencipe G. Climate Change and Transport Infrastructures: State of the Art. Sustainability. 2018; 10. 48. He Y, Thies S, Anver P, Rentschler J. The Impact of Flooding in Urban Transit and Accessibility. Policy Research Working Paper 9504. , Global Facility for Disaster Reduction and Recovery; 2020. 49. Sk. Naureen. SOUTH ASIA KNOWLEDGE PLATFORM FOR CLIMATE ADAPTATION AND RESILIENCE. [Online].; 2021. Available from: https://www.adpc.net/capsouthasia/index.php/2021/06/30/transport-in-bangladesh-building-betterroads/#:~:text=Bangladesh%20aspires%20to%20achieve%20100,July%202020%2DJune%202025).&tex t=The%20future%20of%20Bangladesh's%20economy,sectors%20all%20over%20the. 50. WHO. WHO. [Online].; 2021. Available from: https://www.who.int/news/item/28-10-2021-who-kicksoff-a-decade-of-action-for-road-safety. 51. Arora P. Independent Evaluation of the United Nations Road Safety Trust Fund (UNRSF) Secretariat. Syracuse:; 2021. 52. Towards Zero Foundation. Towards Zero Foundation. [Online].; 2022. Available from: http://www.towardszerofoundation.org/thesafesystem/. 53. Overseas Development Institute. https://odi.org/en/. [Online].; 2018. Available from: https://odi.org/en/about/features/road-safety/. 54. Dugbazah J, Glover B, Mbuli B, Kungade C. https://www.nepad.org/. [Online].; 2021. Available from: https://www.nepad.org/blog/arrive-alive-saving-african-lives-using-road-safety-technologies#_ftn11. 55. WHO- Social Determinants of Health. https://www.who.int. [Online]. Geneva; 2018. Available from: http://apps.who.int/iris/bitstream/handle/10665/277370/WHO-NMH-NVI-18.20-eng.pdf?ua=1. 56. GRSF. Global Road Safety Facility. [Online].; 2021. Available from: https://www.roadsafetyfacility.org/country/democratic-republic-congo. 57. Schlindwein S. https://www.dw.com/. [Online].; 2014. Available from: https://www.dw.com/en/intelligent-robots-save-lives-in-dr-congo/a-17717287. 58. Jungu-Omara IO, Vanderschuren MJWA. Ways of Reducing Accidents on South African Roads. In South African Transport Conference ; 2006: ResearchGate. 59. Oluwagbemi O. Reducing Road-Traffic Accidents on African Roads through a Computer Simulation Programming Approach. ResearchGate. 2010. 70 AFRICA URBAN MOBILITY OBSERVATORY – POLICY AND PLANNING INSIGHTS REPORT 60. Galatoulas NF, Genikomsakis KN, Ioakimidis CS. Spatio-Temporal Trends of E-Bike Sharing System Deployment: A Review in Europe, North America and Asia. [Online].; 2020. Available from: https://www.mdpi.com/2071-1050/12/11/4611. 61. ITDP. Feasibility Study for Bikeshare in Addis Ababa. https://africa.itdp.org/publication/feasibilitystudy-for-bikeshare-in-addis-ababa/:; 2021. 62. Taarifa. Kigali launches bicycle ride sharing hailing as city explores green transport. [Online].; 2021. Available from: https://taarifa.rw/kigali-launches-bicycle-ride-sharing-hailing-as-city-explores-greentransport/. 63. Egypt Today. Egypt to adopt bicycle sharing system. [Online].; 2017. Available from: https://www.egypttoday.com/Article/1/10996/Egypt-to-adopt-bicycle-sharing-system. 64. WRI. WOrld Resources Institute. [Online].; 2020. Available from: https://www.wri.org/insights/dockless-bike-sharing-can-create-healthy-resilient-urban-mobility. 65. TUMI. Key steps how to roll out an e-bike sharing scheme in your city. [Online].; 2021. Available from: https://www.transformative-mobility.org/campaigns/key-steps-how-to-roll-out-an-e-bike-sharingscheme-in-your-city. 66. USAID. Gender-Based Violence on Public Transportation A Review of the Evidence and Existing Solutions. Policy Brief. Washington, DC:; 2020. 67. Social Development Direct; the EBRD; CDC; IFC. IFC. [Online].: International Finance Corporation ; 2020. Available from: https://www.ifc.org/wps/wcm/connect/42f9b567-ac8f-4f43-b07de85165f248b7/SectorBrief_AddressingGBVH_Transport_July2020.pdf?MOD=AJPERES&CVID=nddoZh0. 68. Flone Initiative. https://floneinitiative.org. [Online].; 2021. Available from: https://floneinitiative.org/wp-content/uploads/2019/05/Gender-Toolkit.pdf. 69. Humanity & Inclusion. Humanity & Inclusion. [Online].; 2020. Available from: https://www.hius.org/senegal. 70. UITP. SAFE AND ACCESSIBLE PUBLIC TRANSPORT FOR ALL. Brussels:; 2019. 71. Onyango GM, Owino FO. Transit oriented development in medium cities in Africa: Experiences from Kisumu, Kenya. [Online].; 2021. Available from: https://academicjournals.org/journal/JGRP/article-fulltext-pdf/D1F21B867168. 72. Huang CY, Mehndiratta S. Transit-oriented development — What does it take to get it right? [Online].; 2014. Available from: https://blogs.worldbank.org/transport/transit-oriented-development-whatdoes-it-take-get-it-right. 73. ICLEI. Curitiba, Brazil - A model for Transit Oriented Development. [Online].: Urban Leds; 2016. Available from: https://urban-leds.org/wpcontent/uploads/2019/resources/case_studies/ICLEI_cs_190_Curitiba_Urban-LEDS.pdf. 71 AFRICA URBAN MOBILITY OBSERVATORY – POLICY AND PLANNING INSIGHTS REPORT 74. City of Johannesburg. Corridors of Freedom: Re-stitching our City to create a new future. Johannesburg:; 2014. 75. Bickford G. TRANSIT ORIENTED DEVELOPMENT IN THE SOUTH AFRICAN CONTEXT: An analytical review of Johannesburg's recent urban policy and strategy. [Online].; 2016. Available from: https://open.uct.ac.za/bitstream/handle/11427/20406/thesis_ebe_2016_bickford_geoffrey.pdf?sequ ence=1&isAllowed=y. 76. Behrens GBaR. WHAT DOES TRANSIT ORIENTED DEVELOPMENT MEAN IN A SOUTH AFRICAN CONTEXT? A multiple stakeholder perspective from Johannesburg. [Online].; 2015. Available from: https://repository.up.ac.za/bitstream/handle/2263/57751/Bickford_Transit_2015.pdf?sequence=1&is Allowed=y. 77. World Bank. TRAFFIC CONGESTION IN CAIRO - AN OVERVIEW OF THE CAUSES AS WELL AS POSSIBLE SOLUTIONS. ; 2013. 78. United Nations News. Road accidents in Africa among deadliest worldwide. [Online].; 2017. Available from: https://news.un.org/en/story/2017/10/569092-road-accidents-africa-among-deadliestworldwide-un-official-says-urging-more. 79. News 24. Poor Cape Town households spend 43% of income on transport – Mayco member. [Online].; 2019. Available from: https://www.news24.com/fin24/Economy/poor-cape-town-households-spend43-of-income-on-transport-mayco-member-20190821. 80. Clean Technica. Africa’s Low Motorization Levels Present An Opportunity For Another Leapfrog Event. [Online].; 2020. Available from: https://cleantechnica.com/2020/08/07/africas-low-motorizationlevels-present-an-opportunity-for-another-leapfrog-event/. 81. JICA. Transport Master Plan Nairobi. ; 2014. 82. ITDP. Leapfrogging past the Urban Highway. [Online].; 2021. Available from: https://www.itdp.org/2021/04/02/leapfrogging-past-the-urban-highway/. 83. Global Designing Cities Initiative. Case Study: Cheonggyecheon; Seoul, Korea. [Online].; 2022. Available from: https://globaldesigningcities.org/publication/global-street-design-guide/streets/specialconditions/elevated-structure-removal/case-study-cheonggyecheon-seoul-korea/. 84. The Star. Sh62 billion expressway won't decongest city. [Online].; 2021. Available from: https://www.the-star.co.ke/news/2021-01-31-sh62-billion-expressway-wont-decongest-city-expert/. 85. The Economist. Egypt is busily building expressways. [Online].; 2020. Available from: https://www.economist.com/middle-east-and-africa/2020/10/08/egypt-is-busily-buildingexpressways. 86. World Bank. Land area (sq. km) - Malawi. [Online].; 2020 [cited 2021 10 11. Available from: https://data.worldbank.org/indicator/AG.LND.TOTL.K2?locations=MW. 87. World Bank. GDP per capita (current US$) - Malawi. [Online].; 2020 [cited 2021 10 11. Available from: https://data.worldbank.org/indicator/NY.GDP.PCAP.CD?locations=MW. 72 AFRICA URBAN MOBILITY OBSERVATORY – POLICY AND PLANNING INSIGHTS REPORT 88. World Bank Group. Malawi. Systematic Country Diagnostic: Breaking the Cycle of Low Growth and Slow Poverty. ; 2018. 89. Chiweza L. Political Economy Analysis of Urban Governance and Management in Malawi: An Updated Version. Zomba:; 2019. 90. NPC. National Planning Commission Strategic Plan 2021-2030. Lilongwe:; 2021. 91. JICA. Sector position paper: Transport. JICA Malawi Office; 2021. 92. MoTPW. Malawi National Transport Master Plan. ; 2017. 93. MoTPW. National Transport Policy. ; 2019. 94. Mawenda J, Watanabe T, Avtar R. An Analysis of Urban Land Use/Land Cover Changes in Blantyre City, Southern Malawi (1994–2018). Sustainability. 2020; 12(6). 95. Republic of Malawi. Updated Nationally Determined Contributions. Lilongwe:; 2021. 96. Simkonda N. Malawi Revenue Authority. [Online].; 2019. Available from: https://www.mra.mw/pressreleases/amendments-to-the-customs-and-excise-tariffs-order. 97. SADC. South African Development Community. [Online].; 2012. Available from: https://www.sadc.int/themes/environment-sustainable-development/air-quality/. 98. Christophersen AS, Bogstrand ST, Gjerde H, Sundet M M, Wyller EH. Road Traffic Injuries in Malawi - – with special focus on the role of alcohol. Oslo:; 2021. Report No.: 978-82-8406-191-7. 99. Manyozo S, Moodie R. Road traffic collisions in Malawi: Trends and patterns of mortality on scebe. Malawi Medical Journal. 2018 June; 30(2). 100. UN Women. Malawi Country Page. [Online].; 2020 [cited 2022 February 24. Available from: https://data.unwomen.org/country/malawi. 101. National Statistical Office. [Online].; 2008 [cited 2021 July 15. Available from: http://www.nsomalawi.mw/index.php?searchword=blantyre&ordering=&searchphrase=all&Itemid=1 &option=com_search. 102. UN-Habitat. Malawi: Blantyre Urban Profile. ; 2011. 103. Blantyre City Council. Blantyre Service Charter. [Online].; 2017 [Taking the City Back to the People]. Available from: https://bccmw.com/assets/uploads/2019/04/Service-CharterBooklet_compressed.pdf. 104. Blantyre City Council. Local Government (Blantyre City Council) (Sanitary Arrangements) By-laws. [Online].; 2003. Available from: https://bccmw.com/assets/uploads/2018/03/Blantyre-City-Council-ByLaws.pdf. 73 AFRICA URBAN MOBILITY OBSERVATORY – POLICY AND PLANNING INSIGHTS REPORT 105. Blantryre City Council. Blantyre City Council. [Online]. Available from: https://bccmw.com/project/keep-blantyre-city-clean-and-green/. 106. UN Botswana. Botswana: Common Country Analysis (CCA). ; 2020. 107. Government of Botswana. VISION 2036 Achieving Prosperity for All. Gaborone:; 2016. 108. Government of Botswana. Botswana: National Development Plan (NDP) 11, April 2017 - March 2023. ; 2016. Report No.: 978-99968-465-2-6. 109. Statistics Botswana. Transport and Infrastructure Statistics Report. Gaborone:; 2020. 110. Republic of Botswana. Botswana Habitat III Report. Gaborone:; 2014. 111. Ministry of Transport and Communications. Republic of Botswana. [Online]. Available from: https://www.gov.bw/ministries/ministry-transport-and-communications. 112. UNDP. National Climate Change Strategy for Botswana. ; 2018. 113. Sunday Standard. Sunday Standard. [Online].; 2019. Available from: https://www.sundaystandard.info/who-urges-botswana-to-review-road-safety-strategy/. 114. GRSF. Global Road Safety Facility. [Online].; 2022. Available from: https://www.roadsafetyfacility.org/country/botswana. 115. UN Botswana. 2020 UN Botswana Annual Results Report. ; 2020. 116. Mukhopadhyay S, Moswela E. Disability Rights in Botswana: Perspectives of Individuals With Disabilities. Journal of Disability Policy Studies. 2019; 31(1). 117. Moisienyane and Marterns International (PTY) LTD and Plantec Africa (PTY) LTD. Gaborone City Development Plan (1997-2021). Gaborone:; 2009. 118. Gaborone City Council. Facebook. [Online]. Available from: https://www.facebook.com/GaboroneCity-Council-198104206972335/?ref=page_internal. 119. Bashingi N, Mostafa M, Das DK. The state of congestion in the developing world; The case of Gaborone, Botswana. Transportation Research Procedia. 2020; 45: p. 434-442. 120. Statistics Botswana. Transport and Infrastructure Stats Brief Quarter 2. Gaborone:; 2021. 121. MINECOFIN. Vision 2050. Kigali:; 2020. 122. Republic of Rwanda. Updated Nationally Determined Contribution. Kigali:; 2020. 123. City of Kigali. Kigali Transport Master Plan. Kigali:; 2020. 124. MININFRA. National Transport Policy and Strategy for Rwanda. ; 2021. 74 AFRICA URBAN MOBILITY OBSERVATORY – POLICY AND PLANNING INSIGHTS REPORT 125. UNFCCC. United Nations Climate Change. [Online].; 2022. Available from: https://unfccc.int/climateaction/momentum-for-change/financing-for-climate-friendly-investment/rwanda-green-fund-fonerwa. 126. RTDA. RTDA 2019-2020 Annual Report. Kigali:; 2020. 127. SLOCAT. Tracking Trends in a TIme of Change: The Need for Radical Action Towards Sustainable Transport Decarbonisation, Transport and Climate Change Global Status Reoprt. ; 2021. 128. Ministry of Environment. Rwanda National Environment and CLimate Change Policy. Kigali:; 2019. 129. MININFRA. MININFRA. [Online].; 2019. Available from: https://www.mininfra.gov.rw/updates/newsdetails/rwanda-launches-road-safety-week. 130. Shrestha S. Rwanda Project Scoping E-Mobility for last-mile connectivity in Kigali. Berlin:; 2019. 131. Tabaro JdlC. KT Press. [Online].; 2022. Available from: https://www.ktpress.rw/2022/01/kigali-car-freezone-expands-to-biryogo/. 132. FONERWA. Green City Kigali. [Online].; 2022 [Rwanda's Pilot Towards Green Urbanisation]. Available from: https://greencitykigali.org/. 133. UN-Habitat. Streets as Public Spaces and Drivers of Urban Prosperity. ; 2013. Report No.: 978-92-1- 132590-4. 134. JICA. Project for Urban Transport Master Plan in Kinshasa City. Japan International Cooperation Agency; 2019. 135. World Bank Group. Democratic Republic of Congo Urbanization Review Productive and Inclusive Cities for an Emerging Democratic Republic of Congo. Washington, DC:; 2018. 136. Murguet B. DRC Multi-Modal Transport. Implementation Completion and Results Report. ; 2018. 137. IMF. National Development Plan. , Ministry of Economy, Planning, Land Reform and Integration; 2012. 138. Park J, Mauclert E. Global Partnership for Effective Development Co-operation. [Online].; 2021. Available from: https://www.effectivecooperation.org/five-tools-more-effective-partnerships-achievesdgs-democratic-republic-congo. 139. USAID. THE DEMOCRATIC REPUBLIC OF THE CONGO - CLIMATE CHANGE FACT SHEET. [Online]. [cited 2022 February 24. Available from: https://www.usaid.gov/sites/default/files/documents/DRC_Climate_Change_Country_Fact_Sheet.pdf. 140. Africa Adaptation Initiative. Democratic Republic of Congo. [Online].; 2017 [cited 2022 February 24. Available from: https://africaadaptationinitiative.org/ndc/countries/democratic-republic-of-thecongo/. 141. McFarlane C,IPK,LRS,NAME,DR,JX,MVF,MC,SR,WDM. First Measurements of Ambient PM2.5 in Kinshasa, Democratic Republic of Congo and Brazzaville, Republic of Congo Using Field-calibrated Lowcost Sensors. Aerosol Air Qual. Res. 2021; 21. 75 AFRICA URBAN MOBILITY OBSERVATORY – POLICY AND PLANNING INSIGHTS REPORT 142. UNDP NDC Support Programme. DEMOCRATIC REPUBLIC OF CONGO. [Online].; 2019 [cited 2022 February 24. Available from: https://www.ndcs.undp.org/content/ndc-supportprogramme/en/home/our-work/geographic/africa/DRC.html. 143. World Bank Group - Climate Policy Team. DR Congo (Intended) Nationally Determined Contribution. [Online].; 2016 [cited 2022 February 24. Available from: http://spappssecext.worldbank.org/sites/indc/PDF_Library/cd.pdf. 144. Stucki M. Policies for Sustainable Accessibility and Mobility in Urban Areas of Africa. Working Paper No. 106. SSATP; 2015. 145. World Bank. Challenges in Urban Mobility and the Way Forward: A study of Maseru, Lusaka and Harare Cities. Washington, DC:; 2020. 146. Federal Ministry of Environment. Nigeria's First Nationally Determined Contribution - 2021 Update. Abuja:; 2021. 147. Federal Ministry of Finance, Budget and National Planning. National Development Plan (NDP) 2021- 2025. ; 2021. 148. Federal Government of Nigeria. Nigeria's Nationally Determined Contribution - Update. Abuja:, Federal Ministry of Environment; 2021. 149. NDC Partnership. Nigeria's Updated NDC is Ambitious and Inclusive. [Online].; 2021. Available from: https://ndcpartnership.org/news/nigeria%E2%80%99s-updated-ndc-ambitious-and-inclusive. 150. GRSF. Global Road Safety Facility. [Online].; 2022. Available from: https://www.roadsafetyfacility.org/country/nigeria. 151. Lagos State Ministry of Transportation. Lagos Non-Motorized Transport Policy. Lagos:; 2018. 152. LAMATA. Lagos Metropolitan Area Transport Authority. [Online].; 2022. Available from: https://www.lamata-ng.com/company-overview/company-history/. 153. Olowoopejo M. Lagos Govt. Begins Implementation Of Cyclist Lanes, Other Non-Motorised Transport Systems. [Online].; 2021. Available from: https://theguildng.com/lagos-govt-begins-implementationof-cycling-lanes-other-non-motorised-transport-systems/. 154. World Bank. The World Bank. [Online].; 2022. Available from: https://www.worldbank.org/en/country/lesotho/overview#1. 155. Government of Lesotho. National Strategic Development Plan (NSDP II) 2018/19-2022/23. ; 2018. 156. UNDP. Lesotho Country Analysis Working Document Final Draft. ; 2017. 157. World Bank. Lesotho Policy Notes. Washington, DC:; 2020. 158. Kingdom of Lesotho. Lesotho's National Climate Change Policy. ; 2019. 76 AFRICA URBAN MOBILITY OBSERVATORY – POLICY AND PLANNING INSIGHTS REPORT 159. UN-Habitat. Malawi Urban Housing Sector Profile. Nairobi:; 2010. Report No.: 978-92-1-132188-3. 160. Leduka Rc, Ntaote M, Takalimane SN. Land Governance in Lesotho. In NUST-NELGA Hub Conference; 2018; Windhoek. 161. Economic Comission for Africa. A Harmonized Implementation Framework for the New Urban Agenda in Africa. Addis Ababa:; 2020. 162. OECD. Improving Transport Planning for Accessible Cities, OECD Urban Studies. Paris:; 2020. 163. Somick Vinay L, Vernon Henderson J, Venables AJ. Africa's Cities: Opening Doors to the World. Washington, DC:; 2017. 164. ITDP. What is BRT? [Online].; 2022. Available from: https://www.itdp.org/library/standards-andguides/the-bus-rapid-transit-standard/what-is-brt/. 165. SSATP. Lagos Bus Rapid Transit. [Online].; 2009. Available from: https://www.ssatp.org/sites/ssatp/files/publications/SSATP-DiscussionPapers/DP09-Lagos-BRT.pdf. 166. ITDP. Dar es Salaam: 1985 and Today. [Online].; 2020. Available from: https://africa.itdp.org/dar-essalaam-1985-and-today/. 167. Africa Development Bank Group. Data Portal. [Online].; 2022. Available from: https://projectsportal.afdb.org/dataportal/VProject/show/P-TZ-DB0-021. 168. Forbes. Cities Must Take Advantage Of The Bikeshare Bonanza. [Online].; 2018. Available from: https://www.forbes.com/sites/energyinnovation/2018/07/31/cities-must-take-advantage-of-thebikeshare-bonanza/?sh=232b2fd430ba. 77 AFRICA URBAN MOBILITY OBSERVATORY – ROLE OF INFORMAL PARATRANSIT REPORT APPENDIX A: ROAD SAFETY DATA The data contained in Table 13 is captured from the Global Road Safety facility, funded by the World Bank. Table 13: Road Safety Data for AUMO cities Road crash fatalities and injuries (2016) Lesotho Malawi DRC Rwanda Nigeria Botswana Country Population 2,203,821 18,091,576 78,736,152 11,917,508 185,989,632 2,250,260 Country Reported Fatalities 318 1,122 385 593 5,053 450 WHO Estimated Fatalities 638 5,601 26,529 3,535 39,802 535 GBD Estimated Fatalities 831 2,217 20,521 2,623 19,710 299 WHO Est. Fatalities per 100,000 Pop., 28.9 31 33.7 29.7 21.4 23.8 Estimated Serious Injuries, 9,570 84,015 397,935 53,025 597,030 8,025 Cost of Fatalities and Serious Injuries, $237 million $588 million $4,157 million $854 million $28,798 million $1,289 million Cost as % of country GDP 10.2% 10.8% 11.2% 10.1% 7.1% 8.2% 78 AFRICA URBAN MOBILITY OBSERVATORY – ROLE OF INFORMAL PARATRANSIT REPORT APPENDIX B: MEETING MONITORING AND EVALUATION DATA Table 14: Kigali Stakeholder Engagement Meeting Information Category Details Date 14th December 2021 Knowledge Management Event, RU and Capacity Building Event, or Stakeholder Engagement? Research Uptake Research Supplier/ Partner Africa Urban Mobility Observatory Consortium (Led by UN-Habitat, with support from GoAscendal; Wuppertal Institute; UEMI) What HVT Africa Urban Mobility Observatory – AUMO City Session (Kigali) Where Online Who Host: Janene Tuniz (UN-Habitat) Speakers and Panellists: Janene Tuniz (UN-Habitat); Philip Krause (GoAscendal); Francois Zirikana (City of Kigali) Type of event / engagement Online Workshop Event / engagement description Workshop 2a – AUMO City Session (Kigali) No. People 5 guests: stakeholders from City of Kigali, RTDA, RURA, and MININFRA 4 consortium members Total: 9 Feedback? NA Male 8 Female 1 Persons With Disability Unknown Other info/ links NA 79 AFRICA URBAN MOBILITY OBSERVATORY – ROLE OF INFORMAL PARATRANSIT REPORT Table 15: Blantyre Stakeholder Engagement Meeting Information Category Details Date 15th December 2021 Knowledge Management Event, RU and Capacity Building Event, or Stakeholder Engagement? Research Uptake Research Supplier/ Partner Africa Urban Mobility Observatory Consortium (Led by UN-Habitat, with support from GoAscendal; Wuppertal Institute; UEMI) What HVT Africa Urban Mobility Observatory – AUMO City Session (Blantyre) Where Online (MS Teams) Who Host: Janene Tuniz (UN-Habitat) Speakers and Panellists: Janene Tuniz (UN-Habitat); Philip Krause (GoAscendal); Isaac Tchinga Mzengereza Type of event / engagement Online Workshop Event / engagement description Workshop 2b – AUMO City Session (Blantyre) No. People 2 guests: National Planning Commission and Blantyre City Council 5 consortium members Total: 7 Feedback? NA Male 6 Female 1 Persons With Disability Unknown Other info/ links NA 80 AFRICA URBAN MOBILITY OBSERVATORY – ROLE OF INFORMAL PARATRANSIT REPORT GoMetro Ground Floor Block B Oxford Gate 54 Oxford St Durbanville, Cape Town, 7550 Tel: +2721 824 3345 Email: admin@gometro.com Web: https://gometroapp.com/