
Overview
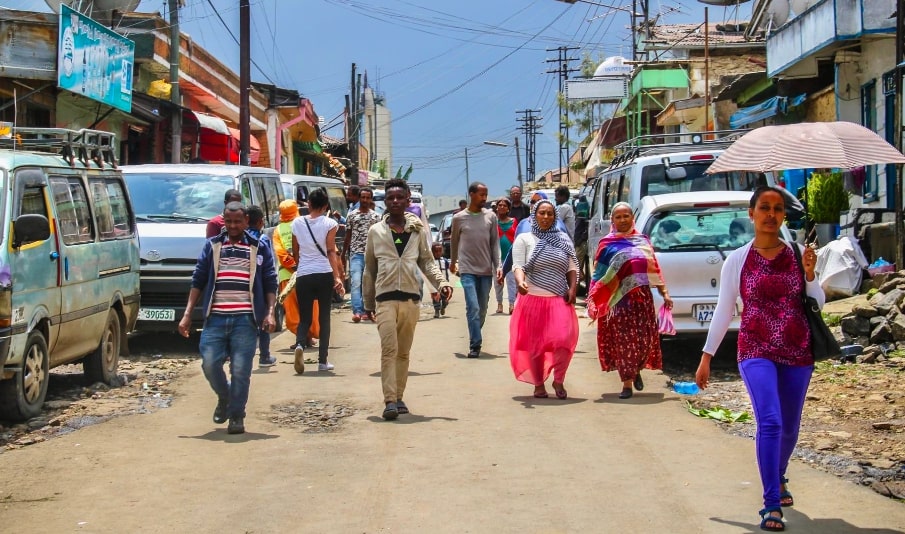
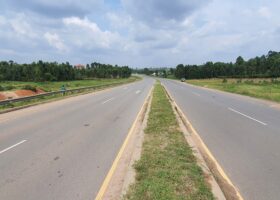
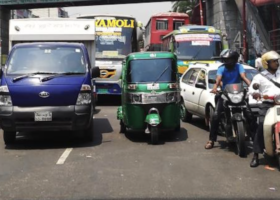
In the following document, we describe the current understanding of transit-oriented development (TOD), based on the literature, particularly as it relates to the context of low-income countries. We also review conditions for TOD in the Eastern African target countries and cities, based on an assessment of quantitative indicators as well as a review of existing policy documents. This baseline assessment lays the foundation for future case studies of TOD policies towards the development of guidance for the implementation of TOD in the target context.
Publications with the same themes
Publications with the same study countries

Related news & events
Blog
News
PDF content (text-only)
Month Year Contract ref: Crown Agents ref: High Volume Transport: City Retrofit for All BASELINE REPORT January 2021 High Volume Transport: City Retrofit for All HVT/045 This research was funded by UKAID through the UK Foreign, Commonwealth & Development Office under the High Volume Transport Applied Research Programme, managed by IMC Worldwide. The views expressed in this report do not necessarily reflect the UK government’s official policies. Cover photo by courtesy ITDP. Reference No. HVT/045 Lead Organisation/ Consultant Institute for Transportation and Development Policy Partner Organisation(s)/ Consultant(s) Title Baseline Report Type of document Project Report Theme Urban transport Sub-theme Author(s) Jacob Mason, Jonas Hagen, Iwona Alfred, Rutul Joshi, Sonal Shah, Pranjali Deshpande, Gashaw Aberra, Nejat Kedir, John Shauri Shau, Chris Kost Lead contact Jacob Mason Geographical Location(s) Washington, DC, United States of America Abstract In the following document, we describe the current understanding of transit-oriented development (TOD), based on the literature, particularly as it relates to the context of low-income countries. We also review conditions for TOD in the Eastern African target countries and cities, based on an assessment of quantitative indicators as well as a review of existing policy documents. This baseline assessment lays the foundation for future case studies of TOD policies towards the development of guidance for the implementation of TOD in the target context. Keywords Transit-oriented development, TOD, low-income countries, urban growth Funding UKAID through the UK Foreign, Commonwealth & Development Office Acknowledgements We would like to thank Nadeem Ahmed from IMC Worldwide for his support in developing this document. Issue Status Author(s) Reviewed By Approved By Issue Date 1 Draft Jonas Hagen, Iwona Alfred, Rutul Joshi, Sonal Shah, Pranjali Deshpande, Jacob Mason, Gashaw Aberra, Nejat Kedir, John Shauri Shau Chris Kost Jacob Mason 16 th November 2020 2 Draft Jonas Hagen, Iwona Alfred, Rutul Joshi, Sonal Shah, Pranjali Deshpande, Jacob Mason Aimee Gauthier Aimee Gauthier 19th November 2020 3 1 st Submis Jonas Hagen, Iwona Alfred, Rutul Joshi, Sonal Shah, Pranjali Jacob Mason Jacob Mason 22nd November 2020 sion Deshpande, Jacob Mason 4 QA Review University of Birmingham reviewers - 14th December 2020 5 2 nd Submis sion Jonas Hagen, Iwona Alfred, Rutul Joshi, Sonal Shah, Pranjali Deshpande, Jacob Mason Chris Kost Jacob Mason 23rd January 2021 i BASELINE REPORT: HVT CITY RETROFIT FOR ALL CONTENTS Section 1: Introduction 8 1. Purpose 8 2. Objectives 9 3. Scope of Work 10 4. TOD Background 11 4.1 TOD principles 11 4.2 TOD critiques 13 Section 2: Literature Review 14 5. Urbanisation Growth and Trends in Eastern Africa 14 5.1 Introduction 14 5.2 Urbanisation challenges 14 5.2.1 Housing stress, poverty, informality—Dar es Salaam 14 5.2.2 Housing stress, poverty, informality—Mwanza 15 5.2.3 Housing stress, poverty, informality—Addis Ababa 16 5.2.4 Housing stress, poverty, informality—Bahir Dar 19 5.3 Challenges of urban and transport planning 20 5.3.1 Challenges of urban and transport planning—Dar es Salaam 20 5.3.2 Challenges of urban and transport planning—Addis Ababa 24 6. Urban Governance and Institutions 27 6.1 Urban planning and governance 27 6.1.1 Dar es Salaam and Tanzania 27 6.1.2 Addis Ababa and Ethiopia 28 6.2 Funding, taxation and finance 28 6.2.1 Dar es Salaam and Tanzania 28 6.2.2 Addis Ababa and Ethiopia 29 6.3 Planning regulations and land management 29 6.3.1 Dar es Salaam and Tanzania 29 6.3.2 Addis Ababa and Ethiopia 30 6.4 Participation and involvement of other stakeholders 30 7. Transit Oriented Development (TOD) for Eastern African Cities 30 7.1 TOD for Eastern African cities—implementation principles 31 8. Summary of Literature Review 32 Section 3: City Assessment 33 9. City-Level Data 33 9.1 Indicator description 34 9.1.1 ITDP indicators 34 9.1.2 UN-Habitat Sustainable Development Goals indicators 36 9.1.3 United Nations World Urbanization Prospects 37 9.1.4 Global Human Settlement‒Urban Centre Database (GHS‒UCDB) 37 9.2 Indicator data 38 9.3 Spatial analysis of key indicators 40 9.3.1 Addis Ababa 41 9.3.2 Bahir Dar 44 ii BASELINE REPORT: HVT CITY RETROFIT FOR ALL 9.3.3 Dar es Salaam 47 9.3.4 Mwanza 50 9.4 Overall assessment 53 10. Policy and Planning Document Analysis 54 10.1 Data 54 10.2 Document analysis 54 10.3 Urban growth planning 56 10.3.1 Urban growth strategy 56 10.3.2 Urban development plans 58 10.3.3 Public participation 60 10.4 Transport planning 62 10.4.1 Integration of transport and land use 62 10.4.2 Public transport (PT) 64 10.4.3 Walking and cycling 66 10.5 Regulatory tools 68 10.5.1 Land-use controls 68 10.5.2 Building controls 72 10.5.3 Parking 74 10.5.4 Street layouts 75 10.6 Land-management tools 76 10.6.1 Land expropriation 76 10.6.2 Land readjustment 77 10.7 Affordable/low-income housing 78 10.7.1 Subsidised-housing provision 78 10.7.2 Improving informal settlements 80 10.7.3 Land tenure 84 10.8 Creating TOD 85 10.8.1 Goals for TOD 85 10.8.2 Implementation strategy 89 10.8.3 Institutions responsible for TOD 90 10.8.4 Funding and land value capture 92 10.9 Vulnerable Groups 93 10.9.1 Ethiopia 93 10.9.2 Addis Ababa 94 10.9.3 Tanzania 94 10.9.4 Dar es Salaam 95 10.10 Policy and planning documents—baseline assessment 95 10.10.1 Ethiopia, Addis Ababa and Bahir Dar 95 10.10.2 Tanzania, Dar es Salaam and Mwanza 96 10.10.3 General conclusions 97 10.10.4 Summary of policy and planning documents found and ranking of support for TOD 99 11. TOD Baseline Interviews 101 11.1 Methodology 101 11.2 Interview results 102 11.2.1 Urban growth and informality 102 iii BASELINE REPORT: HVT CITY RETROFIT FOR ALL 11.2.2 Perception of TOD 104 11.2.3 ‘De facto’ TOD 106 11.2.4 Tools for TOD creation 107 11.3 Interview data analysis 112 Section 4: Key Takeaways 114 Bibliography 117 APPENDICES Appendix A: Policy and Planning Documents Error! Bookmark not defined.6 Appendix B: Research Protocol—Literature Review 131 Appendix C: Research Protocol—Policy and Planning Documents Error! Bookmark not defined. iv BASELINE REPORT: HVT CITY RETROFIT FOR ALL FIGURES Figure 1. TOD standard principles. Source: ITDP. 12 Figure 2: Mwanza population density map indicating low-density settlements in the periphery. (30) 16 Figure 3: Urban growth types in Addis Ababa 1987‒95; 1995‒2005 and 2005‒2017. (35) 17 Figure 4: Low- and high-income clusters in Addis Ababa. Source: HCES, 2016. 17 Figure 5: Location of informal housing and condominium housing in 2006 (L) and 2016 (R). (36) 18 Figure 6: Vacant, buildable land within the administrative boundaries of Addis Ababa. Source: Ethiopia Urbanization Review, 2015. (34) 19 Figure 7: Land use/land cover (LULC) map of Bahir Dar and its peri-urban areas/developmental corridors in (A) 1993, (B) 2001, (C) 2011 and (D) 2020. (41) 20 Figure 8: Mode share in Dar es Salaam. Source: Mkalawa & Haixiao, 2014. (54) 21 Figure 9: Population density map. Source: Mkalawa & Haixiao, 2014. (54) 22 Figure 10: Income level map. Source: Mkalawa & Haixiao, 2014. (54) 23 Figure 11: Public transport access. Source: Mkalawa & Haixiao, 2014. (54) 24 Figure 12: Population density and income classes. (58) 24 Figure 13: Proximity to road infrastructure. (58) 25 Figure 14: Public transport networks in Addis Ababa: Clockwise from top left: public taxi (minibus) routes, Anbessa routes, LRT corridors and Sheger routes. Source: WRI, Addis Ababa Structure Plan and own elaboration. 26 Figure 15: Addis Ababa mode split (L) (64) and people near transit (R). Source: Abreha (2007) cited in (65). 27 Figure 16: Addis Ababa population density. Source: ITDP. 41 Figure 17: Addis Ababa population growth 2000‒2015. Source: ITDP. 42 Figure 18: Addis Ababa block density. Source: ITDP. 42 Figure 19: Addis Ababa people near services. Source: ITDP. 43 Figure 20: Addis Ababa population near transit. Source: ITDP. 43 Figure 21: Addis Ababa grade-separated highways. Source: ITDP. 44 Figure 22: Bahir Dar population density. Source: ITDP. 45 Figure 23: Bahir Dar population growth 2000‒2015. Source: ITDP. 45 Figure 24: Bahir Dar block density. Source: ITDP. 46 Figure 25: Bahir Dar people near services. Source: ITDP. 46 Figure 26: Dar es Salaam population density. Source: ITDP. 48 Figure 27: Dar es Salaam population growth 2000‒2015. Source: ITDP. 48 Figure 28: Dar es Salaam block density. Source: ITDP. 49 Figure 29: Dar es Salaam people near services. Source: ITDP. 49 Figure 30: Dar es Salaam people near rapid transit. Source: ITDP. 50 Figure 31: Mwanza population density. Source: ITDP. 51 Figure 32: Mwanza population growth 2000‒2015. Source: ITDP. 51 Figure 33: Mwanza block density. Source: ITDP. 52 Figure 34: Mwanza people near services. Source: ITDP. 52 v BASELINE REPORT: HVT CITY RETROFIT FOR ALL Figure 35: Hierarchy of plans in Ethiopian local development plans. From The Local Development Plan Manual (121), p. 7. 59 Figure 36: Example of stakeholder identification and analysis in LPD planning process. From The Local Development Plan Manual (121), Annexes p. II. 60 Figure 37: Dar es Salaam decentralised strategy based on nodal development. From the Dar es Salaam Master Plan 2016‒2036 (131) p. 138. 63 Figure 38: Development concept in the Mwanza Master Plan, with high-density residential development zones along the proposed BRT network. From Mwanza City Master Plan (134), p. 176. 64 Figure 39: BRT system plan and broad categories of uses and interventions. From Mwanza City Master Plan (146), p. 166. 66 Figure 40: Mwanza’s Urban Design Area showing different types of walking and cycling interventions. From Mwanza City Master Plan Vol. 3: Urban design Guidelines (139), p. 55 (top), p. 37 (bottom). 68 Figure 41: Zoning Scheme for Dar es Salaam City Master Plan. Source: (131) 70 Figure 42: Mwanza City Proposed Broad Land Use Plan 2035. From Mwanza City Master Plan (134), p. 115. 71 Figure 43: Setback and parking requirements for high-rise residential zones in Mwanza. From Mwanza City Master Plan (134), p. 51. 73 Figure 44: Setback and parking requirements for mixed-use commercial zones in Mwanza. From Mwanza City Master Plan (134) p. 58. 74 Figure 45: Mwanza’s approach to targeting affordable housing in the medium density development areas. From Mwanza City Master Plan Vol. 2 (134), p. 67. 79 Figure 46: Types of TOD for Addis Ababa. From The TOD Addis Ababa Stage 4: TOD Concept and 3D (Master Plan) (136), p. 126. 80 Figure 47: Dar es Salaam Informal Settlements (2016) (131), p. 70. 82 Figure 48: Mapping of Mwanza’s informal settlements. From Mwanza City Master Plan Vol. 2 (146), p. 190. 83 Figure 49: Proposed short terms strategy for informal settlement redevelopment. From Mwanza City Master Plan, Vol. 2 (146), p. 198. 83 Figure 51: Rental and ownership options for housing in Addis Ababa (125), p. 87. 84 Figure 52: Autobus Terra area TOD development boundary. From Terms of Reference (TOR) for TransitOriented Development (TOD) Project (126), p. 14. 87 Figure 53: TOD locations on LRT Network in Addis Ababa, from the TOD Framework Addis Ababa (136), p. 15. 88 Figure 54: Examples of TOD potential areas of Dar es Salaam: Morogoro Road and Sam Nujoma junction (left) and a BRT stop along Morogoro Road (right). From Dar es Salaam City Master Plan (131), p. 419. 88 Figure 55: Existing and proposed institutional structure for planning and delivery of infrastructure and development. From the Dar es Salaam Metropolitan Development Project (138), pp. 24‒25. 91 Figure 56: Total required finance for Addis Ababa. From The Addis Ababa City Structure Plan Summary Report (125), p. 219. 92 vi BASELINE REPORT: HVT CITY RETROFIT FOR ALL TABLES Table 1: Indicator data for target cities. 38 Table 2: Domains and themes of policy documents. 55 Table 3: Scoring of potential TODs at LRT stations. From TOD Addis Ababa Stage 4: TOD Concept and 3D (Master Plan) (137), p. 29. 69 Table 4: Policies and planning documents found and ranking of support for equitable TOD. 99 Table 5: Institutions and programs. 107 vii BASELINE REPORT: HVT CITY RETROFIT FOR ALL ABBREVIATIONS/ACRONYMS AACPDC / AAPDCo Addis Ababa Plan & Development Commission AALDMB Addis Ababa Land and Development Management Bureau AALRT Addis Ababa Light-Rail Transport AARA Addis Ababa Road Authority BRT Bus rapid transit DPS Detailed planning scheme ERC Ethiopian Rail Corporation FAR Floor area ratio FCDO Foreign, Commonwealth & Development Office FSI Floor space index GHS‒UCDB Global Human Settlement‒Urban Centre Database GHSL Global Human Settlement Layer GPS General planning scheme HVT High Volume Transport IMC IMC Worldwide Ltd. LIC Low-income country LGA Local government authority LDP Local development plan MIC Middle-income country MLHHSD Ministry of Land, Housing, and Human Settlement Development NGO Non-governmental organisation NMT Non-motorised transport PT Public transportation TOD Transit-oriented development TOR Terms of reference UPA Urban and peri-urban agriculture 8 BASELINE REPORT: HVT CITY RETROFIT FOR ALL SECTION 1: INTRODUCTION The following baseline report is part of the City Retrofit for All research project funded by UKAID through the UK Foreign, Commonwealth & Development Office under the High Volume Transport Applied Research Programme, managed by IMC Worldwide. This report is part of a larger project to better understand how to develop effective transit-oriented development (TOD) policy in low-income country (as defined by the World Bank1 ) context of Eastern Africa, a region of sub-Saharan Africa defined by the United Nations Statistics Division. 2 In this baseline report, we lay the foundation for the project by describing the current state of knowledge on TOD as well as by creating an understanding of the urban growth context and policy environment in which TOD policies would be implemented. Building on this report, we will conduct a series of case studies, existing instances of TOD-related policies in the Eastern African and Indian context. In this effort, we aim to understand the policies themselves, the context in which they were implemented and the impact they have had. From these two efforts, we will identify learnings that are applicable to the Eastern African context and develop guidance for those contexts. After working with local partners to ensure that the guidance is relevant and actionable, we will conduct a series of workshops to train local decision-makers and practitioners with the guidance we’ve developed. This baseline report contains two main components. First, we describe a review of literature about the current status of TOD around the world, with a specific focus on low-income countries. We also assess the existing conditions in four target cities in low-income countries in Sub-Saharan Africa, including an analysis of quantitative data on current development indicators, an assessment of existing development policies and an examination of capacity to implement policies. This work will provide a foundation for a future case study assessment of TOD policies in low- and middle-income countries, which will finally be used to develop lessons on how TOD policies might be applied to the target cities. 1. Purpose One of the greatest drivers of both climate change and inequity is urban sprawl (1). From 2000 to 2015 the global urban footprint has expanded 50% faster than the urban population (2). In sub-Saharan Africa, many cities are growing rapidly, with informal settlements multiplying along major and minor roads. Facing increased congestion along these corridors, some larger cities have looked to build urban highways to improve traffic flow. As was ascertained in the HVT: State of Knowledge Final Report on Urban Transport, research has shown that sprawl leads to higher costs, lower productivity and less equity (3). The research has also shown that urban highway expansion leads to congestion and sprawl. The lack of an appropriate street network coupled with a lack of public services being co-located with these new developments means that transport costs are high in both time and money, access to jobs and services is limited and there is a high reliance on walking in unsafe conditions. The question to answer, then, is what solutions will solve for lack of access and continued sprawl. While existing research has assessed approaches to creating compact growth on the urban fringe (4), we posit that most of the urban growth in the African context has been disconnected informal settlement sprawl along primary arterial roadways, often with low overall densities but overcrowded housing. This research project (of which this report is the first product) posits that the solution is to transform this already low-density sprawl into TOD—denser places grounded in transit and walking, with a mix of activities and strong, sustainable linkages to other parts of the city. When implemented well, this approach induces a shift from private to public transport, walking and cycling (5, 6). TOD can help address many challenges facing cities in low- and middle-income countries, better addressing climate change, reducing local air pollution, reducing social disparities and contributing to the economy and the quality of life of a city (75–77). Inclusive, equitable TOD has been shown to mitigate many of the challenges of urban sprawl. By reducing spatial mismatch through increased densities and a greater mix of uses, travel distances and the cost of 1 Income levels are defined by the World Bank. https://datahelpdesk.worldbank.org/knowledgebase/articles/906519-world-bankcountry-and-lending-groups 2 https://unstats.un.org/unsd/methodology/m49/ 9 BASELINE REPORT: HVT CITY RETROFIT FOR ALL providing transport and other services decrease. Through inclusive planning, lower-income residents are able to live closer to work, reducing the financial and time burdens of transportation. By designing streets for low vehicle speeds and safe, comfortable walking and cycling, as TOD principles suggest, safety has been shown to improve. Taken together, these designs facilitate strong social networks and communities that provide additional support to lower-income residents. Less need for travel reduces the demand for the fossil fuels that power most motorised travel, thus reducing the impact of climate change. Less motorised travel also reduces the emissions that contribute to local air pollution and the related public health impacts. However, when TOD leads to improved public spaces, it can make an area more attractive and expensive, potentially harming more vulnerable populations. This project will also help us understand the constraints faced by lower-income, disadvantaged populations by examining existing conditions in cities as well as the impacts of TOD policies on affordability, especially in informal settlements. Globally we are seeing not only the feminisation of poverty (meaning women represent a disproportionate percentage of the world’s poor) but the feminisation of informality, where in these grey spaces away from formal power structures, women are finding work, livelihoods and mobility. By examining informal areas, we also hope to unpack different disadvantaged groups’ experience of access and mobility, with a focus on women, although we will explore this in more detail in future project activities. The purpose of this research project is to better understand how to implement inclusive, equitable TOD within the existing built-up area of rapidly urbanising cities in many low-income countries in Africa, particularly Ethiopia and Tanzania. These countries represent different ends of the spectrum of centralisation of government decision-making in Sub-Saharan Africa. They were also selected because we have existing relationships with both city and national governments in these countries, giving us access to necessary information as well as a path for conveying the guidance resulting from this research to the practitioners who may apply it to their work. The two countries also contain two of the largest urban areas in sub-Saharan Africa: Dar es Salaam and Addis Ababa. The visibility of these cities and the diversity of their governance structures create multiple pathways for spreading information beyond these countries and indeed the region. The lessons learned in these contexts may serve as examples for countries with similar governance in the region and beyond. Further, we seek to understand what TOD looks like in lower-income countries and how to achieve it. Due to the existing low-density development patterns surrounding many African cities, we anticipate that TOD will have the biggest impact if it is created by retrofitting existing urbanised areas. While there is some research on the use of specific planning tools in Latin America, little research exists on this in Africa. Many studies of existing measures in Africa, Latin America, and Asia focus narrowly on one or two aspects, such as economic development. We plan to take a comprehensive, multi-lens approach to document the context and impact of urban retrofit interventions. We plan to measure impacts along several aspects of sustainability, including: ï‚· Access (ability to reach destinations, opportunities, open space, etc.); ï‚· Equity (affordability, access for low-income and minority residents, etc.); ï‚· Efficiency (use of resources, e.g., land, money); ï‚· Environment (climate change, pollution); and ï‚· Health and safety (traffic injuries and deaths, air quality). 2. Objectives The first objective of this research is to establish an understanding of existing conditions and the context of urban growth, specifically as they relate to TOD in the target cities in Eastern Africa. This will establish a foundation for future research into case studies of specific initiatives to create equitable infill and transitoriented development. The research also aims to translate the learning from those efforts into a report, tools and capacity-building materials that can inform practitioners and decision-makers to create more equitable urban growth, particularly in the Eastern Africa and LIC context. This was identified as a major gap in knowledge in the HVT: State of Knowledge Final Report on Urban Transport. We aim to develop products and programs to effectively share that knowledge with the decisionmakers and practitioners who can act upon it. We anticipate that this work will also have applicability beyond 10 BASELINE REPORT: HVT CITY RETROFIT FOR ALL LICs in Africa, leading to better cities throughout the region and potentially in other LIC and middle-income country (MIC) environments. We aim to conduct research that inspires future research efforts, academic and otherwise, into this topic area to further inform practitioners and decision-makers. The research project aims not only to fill gaps in existing research but to make that research actionable. This is critical to achieving real-world impacts from this program. Knowledge is often kept apart from practitioners, and when the knowledge is available, it is not presented in a way that practitioners can easily apply. Thus, the focus on outputs that can be used, as well as a sizeable portion of the budget for dissemination and application of that knowledge, is pivotal to realising the goals of the project. The project seeks to bridge climate change concerns with the goals of inclusivity and equity. We will not be able to meet our climate change goals without taking into account social justice and inclusivity, and we will not be able to solve for inequity unless we also address the impacts from climate change, which will disproportionately affect lower-income and marginalised communities. Finally, the geographic focus of the project is LICs in Africa, places that may have lower resources and capacity but are facing the challenges of rapid urbanisation and growth. Specifically, we highlight retrofitting informal settlements and inclusivity of disadvantaged communities. Therefore, this HVT project’s objectives can be summarised as follows: 1. Develop new knowledge on how to create infill equitable TOD that is useful and applicable to LICs in Africa; 2. Ensure that this knowledge assists low-resourced but fast-growing cities to create greener, more inclusive, more accessible and safer cities for all; and 3. Transform this knowledge into action by developing useful tools that practitioners can use in multiple contexts and conducting capacity-building activities to teach practitioners to use them. 3. Scope of Work The scope of this Baseline Report is to directly assess existing conditions for TOD in one primary city (largest city) and one or two secondary cities (population > 500,000) in the two target LICs in Eastern Africa. Given the limitations imposed by the COVID-19 pandemic in terms of travel and the added workload for our city contacts, we have opted to pursue one primary city and one secondary city in each region. The team has selected the following African cities in the target countries for a deeper assessment in phases 1 and 2: ï‚· Ethiopia ï‚š Addis Ababa ï‚š Bahir Dar ï‚· Tanzania ï‚š Dar es Salaam ï‚š Mwanza As described above, we selected these cities because they represent different governance approaches; we have existing relationships there, providing a clear path to move guidance to practitioners; and there is a strong visibility of the two large urban areas in the region—Dar es Salaam and Addis Ababa—creating a pathway for disseminating ideas beyond these specific cities and countries. The cities we focussed on in this report are a convenience sample of primary and secondary cities in Eastern Africa. ITDP has field staff in Dar es Salaam and Addis Ababa and professional relationships to planners in these cities, as well as in the secondary cities in the sample (Mwanza and Bahir Dar). The presence of field staff and pre-existing relationships in these four cities made them a clear choice as the focus for our research, as this facilitated data-gathering, particularly for the qualitative data (policy documents and interviews) in this report. We hope the lessons learned in these contexts may serve as examples for countries with similar governance in the region and beyond. This Baseline Report includes an assessment of the literature on TOD, with a focus on TOD in the African context. It also includes an in-depth analysis of the conditions in the target cities and countries. This assessment includes an analysis of the data on urban growth and sustainable transport in the target cities, 11 BASELINE REPORT: HVT CITY RETROFIT FOR ALL based on existing indicators. It also includes a review of policies and planning documents related to urban growth at both the city and the national level for the four cities. Finally, it includes a series of interviews with practitioners and stakeholders to gain a qualitative assessment of the state of TOD in the target cities as well as insight into the capacities and challenges for creating TOD in those cities. Future phases of the broader project will examine case studies of existing TOD policies and use the information to develop guidance for decision-makers and practitioners. This report, however, does not focus on providing such guidance. 4. TOD Background TOD is a framework for thinking about urban planning that ensures access and urban mobility without the reliance on personal motor vehicles that characterised the expansive suburban forms in the 20th century, typified by low-density, auto-centric growth in the United States. According to the TOD Standard: TOD, or transit-oriented development, means integrated urban places designed to bring people, activities, buildings and public space together, with easy walking and cycling connection between them and near-excellent transit service to the rest of the city. It means inclusive access for all to local and citywide opportunities and resources by the most efficient and healthful combination of mobility modes, at the lowest financial and environmental cost, and with the highest resilience to disruptive events. Inclusive TOD is a necessary foundation for long-term sustainability, equity, shared prosperity and civil peace in cities (p. 8). TOD aims to create built environments based on walking, cycling, efficient high-capacity public transport, public space and dense, mixed-use development. Although the specific term ‘TOD’ only spread in American planning circles beginning in the early 1980s, TODlike practices have existed since the advent of public transport. Early investments in services and infrastructures were often financed by property developers, as was the case with so called ‘streetcar suburbs’ in cities around the world in the 19th century (10). Starting in the mid‒20th century, a movement of dissatisfaction with car-oriented culture—and the hidden costs mentioned above, as well as the rise of social‒ spatial equity concerns and environmentalism—created the backdrop for a profound shift in urban planning and transport theory that included the current concept of TOD. In 2010 ITDP sought to re-establish TOD as a framework for long-term urban sustainability, inclusiveness and shared prosperity in urban development, in line with the new Sustainable Development Goals then in development at the United Nations. This led to the creation of the TOD Standard. 4.1 TOD principles To develop the TOD Standard, ITDP convened a panel of globally renowned experts in the integration of land use, urban design and sustainable access and mobility, with a focus on low- and middle-income cities. The panel elaborated a set of eight core principles of TOD—Walk, Cycle, Connect, Transit, Mix, Densify, Compact, Shift—each with concrete implementation objectives and relatively easy-to-use performance indicators and proxies. These elements of TOD definition and measurement were vetted through a large network of ITDP staff around the world and by local and international partners. They were then tested worldwide on a large range of urban and suburban development complexes, with a focus on LIC and MICs. They were refined iteratively through three major published versions to date and eventually endorsed by major international and philanthropic institutions. The TOD Standard identifies the following eight core principles of TOD (illustrated in Figure 1): ï‚· Walk: Develop neighbourhoods that promote walking  OBJECTIVE A. The pedestrian realm is safe, complete and accessible to all.  OBJECTIVE B. The pedestrian realm is active and vibrant.  OBJECTIVE C. The pedestrian realm is temperate and comfortable. ï‚· Cycle: Prioritise non-motorised-transport networks 12 BASELINE REPORT: HVT CITY RETROFIT FOR ALL  OBJECTIVE A. The cycling network is safe and complete.  OBJECTIVE B. Cycle parking and storage is ample and secure. ï‚· Connect: Create dense networks of streets and paths  OBJECTIVE A. Walking and cycling routes are short, direct and varied.  OBJECTIVE B. Walking and cycling routes are shorter than motor vehicle routes. ï‚· Transit: Locate development near high-quality public transport  OBJECTIVE A. High-quality transit is accessible by foot (TOD requirement). ï‚· Mix: Plan for mixed uses, income and demographics  OBJECTIVE A. Opportunities and services are within a short walking distance of where people live and work, and the public space is activated over extended hours.  OBJECTIVE B. Diverse demographics and income ranges are included among local residents. ï‚· Densify: Optimise density and match transit capacity  OBJECTIVE A. High residential and job densities support high-quality transit, local services and public space activity. ï‚· Compact: Create regions with short transit commutes  OBJECTIVE A. The development is in or next to an existing urban area.  OBJECTIVE B. Travelling through the city is convenient. ï‚· Shift: Increase mobility by regulating parking and road use  OBJECTIVE A. The land occupied by motor vehicles is minimised. Figure 1. TOD Standard Principles. Source: ITDP. 13 BASELINE REPORT: HVT CITY RETROFIT FOR ALL 4.2 TOD critiques The term and concept of ‘TOD’ have several important limitations worth discussing. The term ‘TOD’ puts exclusive emphasis on transit (public transport) and fails to make explicit the fundamental role of walkability in this kind of urban development. The term does not speak to other principles of TOD identified above. The concept of TOD has been critiqued as utopian, although it does not assume a full transformation of people. TODs have also suffered from overly optimistic projections of their impact, which were often based on speculation. TODs in North America have often required subsidies, suggesting difficulty in wider replication (11). Scholars have noted that without focused equity measures, TOD projects may increase land values and housing prices, leading to displacement and increased residential segregation. If TOD results in the replacement of lower-income residents with wealthier residents who are more able to afford cars, it may have the unintended consequence of reducing ridership on transit lines and pushing the people most dependent on public transport farther away from it (12). 14 BASELINE REPORT: HVT CITY RETROFIT FOR ALL SECTION 2: LITERATURE REVIEW The following section of the report presents the review of literature related to three inter-linked aspects— urbanisation growth and trends, urban governance and institutions, and transit-oriented development in Eastern African cities. This narrative literature review is developed from the academic and scholarly research and reports/publications from governments, international funding organisations and civil society organisations. The purpose here is to establish an understanding of existing conditions and context of urban growth, specifically as they relate to TOD. A two-pronged approach was used to conduct this literature review. The team based in Dar es Salaam and Addis Ababa approached various government agencies to access relevant reports, publications and datasets which were not available on their websites. Specific policy documents, however, are discussed separately (10. Policy and Planning Document Analysis). While the researchers located in other locations extensively searched web-based resources with permutations and combinations of the terms related to (and not limited to) urbanisation, urban governance, transit-oriented development in the Eastern African context, we searched web-based resources such as journals, university publications and international development agencies websites/databases to find the relevant online material. 5. Urbanisation Growth and Trends in Eastern Africa 5.1 Introduction Cities in Africa, and especially in Eastern Africa, are witnessing epochal urbanisation. Urban areas in Africa comprise 472 million people, and this number is projected to double over the next 25 years as more migrants come to cities from the countryside (13). Eastern African cities are experiencing the proliferation of informal settlements due to continuous migration. Dar es Salaam, Addis Ababa, Nairobi, Mombasa, Kampala and Kigali are attracting migrants in the millions, with more than half of this population living in informal housing. A recent World Bank report (14) describes African cities (especially in Eastern Africa) as crowded but disconnected, with sprawling informal settlements. This same report also states that African cities are 29% more expensive to live in compared to other cities in countries at similar income levels, which the authors ascribe to low urban density that increases travel costs. Investments in infrastructure, public transport and housing have not kept pace with urbanisation, leading to the emergence of fragmented and disconnected neighbourhoods with limited public transport and other infrastructure (13). Eastern African countries (particularly Kenya, Tanzania, Ethiopia and Uganda) are urbanising rapidly. They recorded an average annual growth in the urban population of 4.6% from 2010 to 2015, the highest rate of all regions in Africa, which had the highest rate of all continents (15). Tanzania has 18 million people, 38% of whom live in urban areas. 3 Dar es Salaam, the capital city of Tanzania, houses approximately 6 million people and is expected to become a mega city with more than 10 million people by 2030 (14). Dar es Salaam is the ninth-fastest-growing city in the world, with an average annual growth rate of 4.4% between 2006 and 2020. According to the Central Statistical Authority’s July 2015 estimate, Ethiopia’s total population is around 90 million people, 27% of whom live in urban areas. Addis Ababa is home to an estimated 3.2 million people, or 17% of Ethiopia’s total urban population (16). Addis Ababa grew at an average annual rate of 3.4% from 2006 to 2020. Ethiopia’s urban population is expected to triple by 2037 (17), and a large portion of the population is likely to be concentrated in Addis Ababa. 5.2 Urbanisation challenges 5.2.1 Housing stress, poverty, informality—Dar es Salaam Tanzania is urbanising rapidly, with continuous rural‒urban migration that has led to proliferation of informal settlements on underserviced peripheral land parcels. Approximately 50% of the population in Tanzania’s urban centres lives in informal housing (18). About one in six Dar es Salaam residents lives below the poverty line. The reasons behind the growth of informal settlements include poverty, land tenure insecurity that is 3 http://www.oecd.org/africa-urbanisation/#discover-data 15 BASELINE REPORT: HVT CITY RETROFIT FOR ALL associated with residential licenses and the government’s inability to provide surveyed plots to citizens (19). Houses are often overcrowded, with an occupancy of three or more people per room (20). Unplanned settlements in the periphery have been described as a ‘poverty trap’, where upward income mobility is challenging (21). However, the desire for easy access to employment has resulted in informal settlements in areas that are vulnerable to climate change impacts such as flood plains and steep and unstable slopes (22). This is exacerbated by a complicated and lengthy land surveying and titling process in Tanzania, which has 11 steps and can take 380 days (23). In addition to this, most of the applicants lack legal and ownership documents. The Ministry of Lands, Housing and Human Settlements Development does not directly provide housing, but it demarcates land for housing development. Housing projects are implemented using the combined efforts of respective local authorities and the private sector. The Tanzanian government introduced the Unplanned Urban Settlement Regularization Program in 2004 and the Mortgage Finance Act in 2008 to improve access to long-term housing loans. However, according to a Finscope Survey (2009), 32% of the population in Tanzania is reluctant to take loans because of the fear of not being able to repay them (24). In spite of the efforts by the government, uptake was slow. Further, the national housing programs are not linked with the city’s plans or budgets, which complicates affordable-housing provision in the country. The Urban Planning Act and the Land Use Planning Act 2007 of Tanzania have put forward participatory planning conditions (24). 4 The goal is to promote sustainable development by ensuring the protection of the environment and the orderly development of the land of Tanzania in a participatory approach (24). However, the local authority has not involved indigenous landowners, with their traditional land rights, in this process during the preparation of land use plans and finally the survey of plots. This eventually has led to the indigenous people losing their rights to the land (25). Effective implementation of the municipal master plans is essential for planned urban development of a city. However, the research work by Halla (2002), Magigi and Majani (2006), and McGill (1998), as well as a report from the Tanzania Ministry of Lands, Housing and Human Settlements Development (2015), highlights that delays in master plan preparation, inefficiency of the master plan, rigidity and inflexibility in the provisions of the master plan to accommodate readjustments, inadequate knowledge of land planning and poor involvement of local leaders are challenges to land use planning in Tanzania (24, 26–28). The size of the communities, multiple parcels, ad hoc nature of parcels, length of the process and the resistance to surveying due to the fear of losing land are also issues associated with the master plan implementation. 5.2.2 Housing stress, poverty, informality—Mwanza Mwanza is the second-most-densely populated urban area in Tanzania after Dar es Salaam, with 0.7 million residents in 2013, according to the National Bureau of Statistics. Mwanza is one of the fastest-growing cities in Tanzania, and its population is expected to reach 1.8 million by 2030. The city is urbanising rapidly due to the push effect of rainfall patterns in rural areas and the pull effect of urbanised areas. Almost 33% of Mwanza region’s population lives in urban areas (29). Research shows that Mwanza’s local government authorities have made a limited contribution to urban planning, policy and project development for the city— decision-making has largely been centralised, leading to a gap between local development priorities and the allocation of funding. Inadequacies of the formal procurement process and administrative decision-making is also resulting in informality in land use; unaffordability of most formal services for low-income households, forcing them to seek informal or self-provisioning options; and often a political disinterest in reaching the poorest urban residents (29). 4 Section 4 of the National Human Settlements Policy, sections 9 and 15 of the Urban Planning Act 2007 and section 32 of the Land Use Planning Act 2007. 16 BASELINE REPORT: HVT CITY RETROFIT FOR ALL Figure 2: Mwanza population-density map indicating low-density settlements in the periphery. (30) The city is facing challenges in terms of ‘informal’ settlements and their regularisation, expanding sprawl on the peripheries, contested forms of densification in the centre, market and government-led population displacements, conflicts among different land uses and a chronic lack of formal affordable housing for lowincome groups (30). Informal settlements house both low-income and middle-income groups. In 2012 about half of the city’s population of 685,000 was living in identified informal settlements. About 60% of these people (30% of Mwanza’s overall population) were living in hilly informal settlements with densities of over 100 people per hectare within 5 km of the city centre (31). The peripheral areas also have formal housing where people from city centres have relocated. Residents of these households have relatively secure livelihoods and sufficient resources to cope with the absence of conventional urban amenities. The level of demand is less acute in Mwanza than in Dar es Salaam, but the challenges of providing affordable housing are similar (30). 5.2.3 Housing stress, poverty, informality—Addis Ababa Addis Ababa is the capital and largest city of Ethiopia. As stated above, population trends forecast that it will grow rapidly in the next decade, and currently the city reflects a high level of informality and sprawling growth. An estimated 70% to 80% of the urban population in Ethiopia lives in what might be considered slums using the UN definition5 (17). Addis Ababa is facing challenges of horizontal urban expansion. For instance, from 2007 to 2014, the population of Addis Ababa increased 17% while its urban area increased 51%, or three times as fast (Figure 3). The government is the sole supplier of land for formal development in Ethiopia. It supplies land by direct allotment or auction (14). The Urban Land Development and Management Policy and Strategy (32) and Urban Housing Provision Strategic Framework (33), both by the Ministry of Urban Development, Housing and Construction, state that land for housing should be provided at low cost for large programs such as government and enterprise-supported housing, housing cooperatives and low-income households in general (34). Hence the current system of providing land below cost recovery for required infrastructure, allocating land at low benchmark prices that are lower than the market prices, and allotment of some land for housing cooperatives—almost free of charge—results in a large financial burden on the government that makes it difficult to provide basic services to those plots. High-density formal developments at affordable prices also become difficult due to the large minimum lot sizes for residential use. Partially due to these policies, the cities are expanding horizontally (14) as such restrictions on landownership by the government force migrants to either buy land use rights informally in peri-urban areas or to rent informal rental houses from the private 5 UN-HABITAT defines a slum household as a group of individuals living under the same roof in an urban area who lack one or more of the following: 1. Durable housing of a permanent nature that protects against extreme climate conditions; 2. Sufficient living space, which means not more than three people sharing the same room; 3. Easy access to safe water in sufficient amounts at an affordable price; 4. Access to adequate sanitation in the form of a private or public toilet shared by a reasonable number of people; and 5. Security of tenure that prevents forced evictions. 17 BASELINE REPORT: HVT CITY RETROFIT FOR ALL sector. While many clusters of low-income neighbourhoods are located near the city centre, they also can be seen in the urban periphery (Figure 4). Figure 3: Urban growth types in Addis Ababa 1987‒95; 1995‒2005 and 2005‒2017. (35) Figure 4: Low- and high-income clusters in Addis Ababa. Source: HCES, 2016. 18 BASELINE REPORT: HVT CITY RETROFIT FOR ALL Figure 5: Location of informal housing and condominium housing in 2006 (L) and 2016 (R). (36) As mentioned in Figure 5, in 2006, informal housing was clustered in the city centre and to the south. However, by 2016, the area under informal housing (blue) had decreased and had become more dispersed throughout the city. In 2006, there was very little condominium housing (red). By 2016, the area of condominium housing had increased to occupy 11% of the city, with the largest concentrations in the periphery toward the city’s southern and eastern boundaries (36). In Ethiopia, the neighbourhood administrative units are known as kebeles. All land is property of the national government and is leased, not sold, for development. ‘Kebele housing’ consists of informal construction that has been nationalised and now serves as government-managed rental housing. Nearly two-thirds of households in Addis Ababa fall under the ‘rented’ category, including kebele housing (16). Government inactivity in kebele housing maintenance low rents are the major reasons behind its low quality. The high cost of construction, low income levels and low savings of urban households, coupled with the lack of access to formal credit, shortage of public finance and limited serviced land supply, are some of the factors behind the wide gap between housing demand and supply (37). While the city contains many housing units that are in poor condition, slum-upgrading programs do not include housing improvements. As a result, many officials and local professionals believe that slum upgrading ‘does not work’ in Ethiopia, which has hampered the expansion of government housing programs beyond Addis Ababa. Poor land management may also pose challenges to urban development. Valuable land in the city centre is not being used efficiently or intensively (16). A World bank study shows that about 46% of land in Addis Ababa city territory, including high proportions in the city centre, is undeveloped (see Figure 6). However, the government is now replacing the old system of urban land tenure with a more market-oriented system of long-term leases (37). While the system of landownership by the government poses some challenges in urban development, it may be beneficial for securing public open spaces, and it provides an opportunity to accommodate high-density mixed-use development in the city centre along with high-capacity mass rapid transit. 19 BASELINE REPORT: HVT CITY RETROFIT FOR ALL Figure 6: Vacant, buildable land within the administrative boundaries of Addis Ababa. Source: Ethiopia Urbanization Review, 2015. (34)6 5.2.4 Housing stress, poverty, informality—Bahir Dar Bahir Dar City is one of the largest and most rapidly expanding cities in Ethiopia, with a population of 191,000 (38, 39). The city has political, economic, tourist and cultural importance. A study on the Ethiopian urban expansion initiative indicates that out of total territory within the city administration, 25% of land in Bahir Dar, is undeveloped (40). The city is currently expanding in haphazard manner, with rapid redevelopment of farmlands. In the past decade, farmland share has reduced from 39% to 15% (39). Figure 7 highlights the reduction in farmlands as a result of built up in last decades. The city of Bahir Dar has a strong cycling culture but is experiencing a growing share of trips by motor vehicle. Bicycle infrastructure is poor and hence the respondents of a recent study highlight that more than 29% of total bicycle users are victimised by traffic accidents (38). 6 World Bank calculations based on MODIS imagery from NASA LP DAAC. 20 BASELINE REPORT: HVT CITY RETROFIT FOR ALL Figure 7: Land use/land cover (LULC) map of Bahir Dar and its peri-urban areas/developmental corridors (A) 1993, (B) 2001, (C) 2011 and (D) 2020. (41) 5.3 Challenges of urban and transport planning People in Eastern African cities face many challenges in using the urban transport system. Gina Porter (42) defines the term ‘transport disadvantage’ as a lack of provision of transport infrastructure and services; a high monetary cost of travel; and a large amount of time spent accessing transport, waiting for transport, travel on transport and the overall time spent away from the home. Transport disadvantage also can include the discomforts and risks experienced whilst travelling, such as exposure to accidents, crime, noise and pollutants. These factors significantly reduce the potential for undertaking other life-supporting activities, especially for lower-income women in Africa (43–45). The Eastern African urban transport context has many features in common with those found in other cities in the Global South. However, poverty is more widespread, car ownership is lower and the provision of public transport services is even more informal and of lower quality (46,47). The share of long-distance walking in home-to-work travel is higher in urban Africa than anywhere else in the world (21, 48). This is because people cannot afford or do not have access to public transport. It also indicates that many people are unable to move closer jobs due to a lack of affordable housing near job centres (42, 43). In the African context, the governments and agencies developing BRT systems may aim to decrease the public transport deficit in a city. The mission statement of the Dar Rapid Transit Agency (DART) in Dar es Salaam highlights that the main benefits of BRT lie in its enhancement of access to a variety of activities (49). 5.3.1 Challenges of urban and transport planning—Dar es Salaam Given the lack of efficient and affordable transport, many African city dwellers settle in centrally located informal housing—the only affordable option with convenient access to jobs (50). In Dar es Salaam, for example, people live in Tandale, an informal district that lacks services and amenities, but whose central location puts people close to many jobs and economic opportunities (51). 21 BASELINE REPORT: HVT CITY RETROFIT FOR ALL Both expenditure levels and affordability perceptions vary significantly across geographic settlement types, and depend to a large extent on the mode and travel characteristics of commuter trips (52). The horizontal urban sprawl in Dar es Salaam imposes a financial burden on the urban poor because of long trips and multiple transfers. Dar es Salaam has a zonal fare system for its informal public transport, where one trip often requires multiple fares. This results in an additional cost equivalent to USD $17 per month for residents, approximately 34% of the average monthly income (53). Mkalawa et al. (2014) highlight that public transport and walking are the two major modes of transport in Dar es Salaam (54). Dala dalas are small minibuses and medium-sized privately owned buses that provide the majority of public transport in the city. However, the regulatory system of these services is inadequate. The services run with no funding from the government, although the government does set the fare, both in terms of amount and the zonal system within which it operates. Together, the lack of support from the government, long travel distances and low wages make the system unaffordable for many poor residents (21). Development policies also have affected urban form. The National Human Settlements Policy adopted in 2000 recommends the development of satellite towns to curb horizontal urban sprawl. Additionally, the government initiative to turn Dar es Salaam into a ‘showcase city’, has led to the demolition of informal settlements in the urban centre and the relocation of the urban poor to the periphery (55). Both approaches could lead to additional urban sprawl and longer work trips, especially for urban poor. Figure 8: Mode share in Dar es Salaam. Source: Mkalawa & Haixiao, 2014. (54) Poverty, informal work and daily commutes are closely associated with each other. The 2007 Household Budget Survey of Dar es Salaam highlights that the inability to find other work (36%) and the family need for additional income (31%) were the main reasons cited by poor urban dwellers for engaging in informal economic activities (56). As shown in Figure 10, many low-income people reside in the outskirts of the city. To save money on transport, people with lower incomes will walk long distances to work or take a lower income by working in their own neighbourhoods (21). Nearly 47% of all daily trips are walking trips with 40% of them having trip lengths from 2 km to 5 km (57). Such transport difficulties in urban areas result in poverty traps as they reduce the number of accessible jobs and productivity of the workers and add to fatigue. Figure 11 shows that the density of public transport in the central area of Dar es Salaam is good but is concentrated almost exclusively on the few arterials that exist in the city. The radial network results in gaps in access between those main corridors. Finally, because of that radial route layout, the distances between radial corridors become greater with increasing distance from the city centre. In planned wards, most households (77%) have access to public transport. Access is similar for households in both unplanned (62%) and affluent wards (64%). Lack of first- and last-mile connectivity, shortage of buses, overcrowding, waiting time and more than one transfer and cost associated with it results in inconvenience of using dala dalas, which carried 62% of trips prior to opening of the BRT (21)(29). 17% 68% 15% Walk Public Transport Private Transport 22 BASELINE REPORT: HVT CITY RETROFIT FOR ALL Figure 9: Population density map. Source: Mkalawa & Haixiao, 2014. (54) 23 BASELINE REPORT: HVT CITY RETROFIT FOR ALL Figure 10: Income level map. Source: Mkalawa & Haixiao, 2014. (54) 24 BASELINE REPORT: HVT CITY RETROFIT FOR ALL Figure 11: Public transport access. Source: Mkalawa & Haixiao, 2014. (54) 5.3.2 Challenges of urban and transport planning—Addis Ababa Addis Ababa, like Dar es Salaam, is characterised by long travel distances and largely informal public transport. Addis Ababa has formal bus services and a light-rail system. As shown in Figure 12, the central area houses middle and high income neighbourhoods (58). In addition, 50% of the population in the city is below the poverty line and resides mostly in the outskirts or in areas with poor road network. Addis Ababa has a long history of being a sprawling city (59). Public transport has failed to meet the increasing demand generated from new settlements at the peripheries which are mostly occupied by low-income housing. Figure 12: Population density and income classes. (58) Poor road infrastructure in peripheral areas is another challenge to providing public transport service (60). Figure 13 shows that proximity to roads for some of the low income neighbourhoods in the southeast part of the city is more than 2 km, forcing people to walk long distances or use animal-powered transport. Due to absent or inadequate pedestrian paths, people often walk with these animals on vehicular lanes. 25 BASELINE REPORT: HVT CITY RETROFIT FOR ALL Figure 13: Proximity to road infrastructure. (58) 26 BASELINE REPORT: HVT CITY RETROFIT FOR ALL Figure 14: Public transport networks in Addis Ababa. Clockwise from top left: public taxi (minibus) routes, Anbessa routes, LRT corridors and Sheger routes. Source: WRI, Addis Ababa Structure Plan and own elaboration. A 2015 World Bank study indicates that from 2007 to 2014 in Addis Ababa, the average density of built-up areas declined from 146 to 136 persons per hectare (40). Current regulations on minimum lot sizes, plot coverage and building heights are obstacles to compact development that could accommodate all income groups near their job locations. The resulting low density increases the cost of providing basic infrastructure. On top of it, the replacement of kebele housing with new government-supported condominium development sited in more distant locations is affecting the density of the core area and has increased commute times for many residents. Urban development is happening in a fragmented manner, with scattered construction sites throughout the city. Field observations showed that most of the agricultural lands between industrial parks and condominium sites were either vacant or underutilised, highlighting inefficient use of land (61). Irrespective of good public transport coverage, as shown in Figure 14, poor bus operations, connectivity to the peri-urban areas, bus frequency, unavailability of dedicated bus lanes and high cost of public transport are resulting into long walk trips, with an average walking trip length of 1.5 km in Addis Ababa (62). Poor land use and transport integration is affecting employment patterns in the city. In Addis Ababa, poor land use planning increases travel time and costs between the residential and commercial areas and the low wages often do not 27 BASELINE REPORT: HVT CITY RETROFIT FOR ALL make the cost of job search worthwhile (14). Researchers found that after four months of job search, 83% of unemployed workers had stopped actively looking for a job due to transportation expenses (63). Figure 15: Addis Ababa mode split (L) (64) and people near transit (R). Source: Abreha (2007) cited in (65). 6. Urban Governance and Institutions The implementation of TOD policies requires effective governance structures and institutions that interact with the many aspects of urban planning involved and reflect the interdisciplinary nature of it. 6.1 Urban planning and governance Urban governance and formal planning mechanisms play a crucial role in the provision of sustainable mobility and affordable housing. The following section expands on this role while elaborating on the interlinked aspects of land management, regulations and finance. 6.1.1 Dar es Salaam and Tanzania The key stakeholders in the institutional framework for planning and land administration in Tanzania are centralised in the Ministry of Land, Housing, and Human Settlement Development (MLHHSD) (66). The MLHHSD is responsible for setting policy, providing technical support to local planning authorities and serving as a review and approval body. Town/municipal/city councils are responsible for making land available in urban areas and implementing and enforcing of planning schemes. In practice, the planning process remains relatively centralised, and MLHHSD frequently plays an active role in the development of urban plans (ibid). Additionally, the Director of Town Planning in MLHHSD is the approving authority for local plans, causing bottlenecks and yearlong delays in providing planned and serviced land (67). In Dar es Salaam, eight years can pass by before land earmarked for a planning scheme can be converted into planned plots for allocation (68). At the city level, a general planning scheme (GPS) prepared by a local government authority (LGA) includes a master plan, interim land use plans, or strategic urban development plans (69). At the neighbourhood level, detailed planning schemes (DPSs) are prepared to coordinate all development activities and control the use and development of land. DPSs are prepared for new areas, regularisation schemes and redevelopment schemes. A DPS can be prepared without a GPS, indicating that approving authorities who are in charge of detailed plans do not have to examine their conformity to the respective master plans (66). According to Lall et al. (2017b), the shift towards decentralisation in Tanzania from the 1970s and 80s typically resulted from local governments granting themselves planning powers (18). However, such devolution of responsibilities is not entirely clear-cut or always accompanied by the necessary fiscal empowerment (18). In Dar es Salaam, local governance is split across three separate municipalities, Ilala, Kinondoni and Temeke, as well as with the Dar es Salaam City Council. The Tanzania Urban Laboratory 7 argues for the need to develop a 7 Tanzania Urbanisation Laboratory (TULab) is chaired by the Ministry of Finance and Planning (MoFP) and includes ministries, civil society and private sector representatives. TULab is supported by the Coalition for Urban Transitions, a special initiative of the New Climate Economy. 71% 16% 13% Residents within 500m Residents within 500-1000m Residents within 1000-2500m 28 BASELINE REPORT: HVT CITY RETROFIT FOR ALL metropolitan mindset and institutions, rather than splitting cities into smaller local government authorities as in Dar es Salaam and Mwanza (70). Tanzania exemplifies the overlapping regulatory scope and responsibilities, silo mentality and vertical institutional fragmentation, among multiple bodies in Africa (18). Local governments and central government agencies, or national parastatals, are both responsible for service provision (roads, water, electricity, drainage), land use regulations (especially land use planning and land allocation) and environmental management (71). These muddy lines of accountability complicate planning, implementation, monitoring and enforcement (18). In addition to the central role played by MLHHSD in urban planning, the central government also retains controls over the functioning of local authorities (71). For example, it appoints senior personnel to run urban authorities, and the Minister for Local Government approves the urban authorities’ bylaws, budgets and proposals for generating own-source revenue. 6.1.2 Addis Ababa and Ethiopia In Addis Ababa, the citywide master plan is prepared by a special project office called the Addis Ababa City Government Plan Revision Project Office (18). There are two sub-tiers: kebeles (lower-level administration) and woredas (an administrative jurisdiction consisting of a group of kebeles) within the city government. Kebeles are empowered to administer local matters, including neighbourhood maintenance and building code enforcement. Local development plans (LDPs) include explanatory details on the strategies, implementing agencies, concrete standards, development controls, budgets and time frames for implementing those plans. Since housing delivery is dominated by the government, new developments tend to conform to the citywide master plan and LDPs. The Building Permit and Control Authority is responsible for building approvals and monitoring implementation to ensure that all public and private development conforms to the plans and regulations (18). Most of the urban area of Addis Ababa falls under the jurisdiction of the Addis Ababa City Administration, with some parts of the metropolitan area extending into neighbouring Oromia State, which complicates the management of the city’s expansion. However, urban governance may be complicated by the political rivalries between local governments and the national government that has a largely rural base (72, 73). From 2005 to 2016, Ethiopia experienced rapid economic growth and developed without legal and social frameworks to absorb new urban residents. In 2005, the local government in Addis Ababa swung to the political opposition. The late prime minister Meles Zenawi, sought to prioritise the rural agricultural economy over the rapidly growing urban economy. Despite this political choice, Ethiopia’s cities—particularly Addis Ababa—continued to attract investment from China, Indonesia and the United States, among other countries, much of which is concentrated in industrial parks and in the textiles, leather, agro-processing and pharmaceuticals industries. The resulting economic growth, attracting new urban migrants and in the absence of sufficient planning or infrastructure investment, has resulted in sprawl. The expanding urban area of Addis Ababa breached the territorial divides between the Oromo, Tigrayans and Amhara ethnic groups, fuelling conflict (73). 6.2 Funding, taxation and finance Taxes, charges and subsidies can be used to complement regulatory controls on land use, creating financial incentives and disincentives. 6.2.1 Dar es Salaam and Tanzania Between 2010 to 2017, the estimated annual per capita municipal budgets in Dar es Salaam and Addis Ababa were USD 29.4 and 91.0, respectively, compared to USD 101 in Pekalongan, Indonesia; USD 399 in Feira de Santana, Brazil; USD 644 in Monteria, Colombia; and USD 4,907 in Bristol, United Kingdom (73). The primary challenge is the poverty of people moving to cities, which is compounded by inadequate local revenue collection (74). Cartwright et al. (2018) argue that local governments in Tanzania have little capacity to invest in or oversee infrastructure programs or collect revenue from users because most urban infrastructure is centrally coordinated by the national government (73). Land valuation is outdated or incomplete in many African cities (6), including in Dar es Salaam. Even if land revenue laws are sound, cities are limited in their power to leverage land for revenue, due to the inadequacy 29 BASELINE REPORT: HVT CITY RETROFIT FOR ALL of fiscal cadastre records. Moreover, cities’ reliance on central government transfers means that they have few incentives to make such efforts. In 2014, the Arusha City Council became the first of seven Tanzanian cities to switch from a manually administered own-source revenue system to a modern local government revenue collection information system integrated with a GIS platform. The new system allows the local government to use satellite data to identify taxpayers and includes an electronic invoicing system that notifies and tracks payments. Within one year, the city council boosted annual revenues by 75%, from TZS 2.6 billion in 2012/13 to TZS 4.6 billion in 2013/14 (18). 6.2.2 Addis Ababa and Ethiopia In Ethiopia, the government of Addis Ababa possesses substantial powers to tax the incomes of employees, profits of enterprises and various other revenue sources usually collected at the national level (75). The Addis Ababa City Administration (AACA) has powers to mobilise substantial revenue of its own from income (including rental income), business profits and VAT on certain products and services. Thus, unlike cities in decentralised systems—or indeed most urban areas in Ethiopia, which acquire 70 per cent of their resources in transfers from the regional states in which they are located—there are no transfers of revenue to Addis Ababa. All the taxes and fees collected at woreda or sub-city level end up at the Bureau of Finance and Economic Development at AACA for budgeting and redistribution, along with the state taxes and other revenue such as external loans (75). While a census of properties (including informal structures) in Addis Ababa was undertaken in 1996 using a computerised system and a team of 3,000 enumerators to calculate new property tax rates, there has been no revision since (75). Even for those houses that the city authority does have on its register, severe undervaluation is the norm—sometimes varying from 300% to 7,685% below the actual value (75). Addis Ababa has experimented with land value capture tools such as roof tax, permit holding fee, lease holding system and capital gains tax (76). Roof tax, rent on houses and rent on plots of land constitute around 3% of total city revenue including state revenue and municipal revenue (75). 6.3 Planning regulations and land management 6.3.1 Dar es Salaam and Tanzania Current regulations discourage investment and limit formal housing options for the poor. Lall et al. recommends rationalising development standards based on performance (for example, structural integrity) and affordability (18). For example, Dar es Salaam requires plot sizes to be at least 400 square metres near the city centre, and therefore anyone who wants to buy a stand-alone house in the formal sector must be able to afford a land parcel of this size. The only ownership alternative is informal, and one-fourth of Dar es Salaam’s homeowners have no documentary proof of ownership (77). Lall et al. further argue that clear rights to urban land are a precondition for the emergence of a formal land market, whether formal, customary or informal (14). But many African cities struggle with overlapping and sometimes contradictory systems, severely constraining urban land redevelopment and imposing high costs. And even where formal titles or clear land rights exist, basic mapping, geographic, or ownership information is often inaccurate, or land records are maintained poorly, causing disputes. Applying for formal recognition can be a tedious process. Land administration systems (such as registries and cadastral records) are incomplete and underused for enforcing legal claims and landholders’ fiscal obligations, so lenders cannot always use land as collateral (ibid). Statutory (legally secure) tenure can offer a range of additional benefits compared to customary tenure (deemed rights of occupancy). Briggs (2011) emphasises that a customary landowners can only realise the value of their land once, i.e., through sale (78). Landowners with statutory tenure can unlock the value of their land through a range of avenues, such as collateral for loans and better compensation rates in case of dispossession. Tenure solutions can facilitate incremental upgrading of informal settlements, creating housing assets that enhance economic security and adaptive capacity. Linking tenure reform with women’s rights can also foster gender-just urban development (79). Tenure insecurity in Africa, measured as the share of the population with no formally recognised land tenure rights, increased from about 55% in 2009 to about 66% in 2012. Low land registration may result partly from cumbersome, expensive registration and transfer systems loaded with survey expenses and fees, which make 30 BASELINE REPORT: HVT CITY RETROFIT FOR ALL registration unaffordable for many (80). Since the acquisition of a formal title in Dar es Salaam requires significant capital, most residents resort to customary tenure, where documentation is obtained from the more accessible, local street-level offices (67). 6.3.2 Addis Ababa and Ethiopia In Addis Ababa, land leasing has allowed the city near total control of formal spatial development (75). In Addis Ababa, 94% of land is allocated directly for activities and development seen to be of strategic importance. No land is formally released without being serviced. This had led to a slow release of land and a huge gap between supply and demand. Almost a million households are outside of the formal system, building informally in and around the city. Understanding the constraint, the state has been lax in enforcing building controls in informal and extra-legal areas. However, when areas fall within critical parts of the master plan, the city takes swift action to evict households that do not conform (81). 6.4 Participation and involvement of other stakeholders International organisations have played a key role in governance, with aid and loans linked to governance reforms and through the publication of data related to urbanisation, demographic and economic data. While local participation has been limited to specific projects, Tanzania’s land management policies show how public and private interest can be balanced (even if they are not always applied consistently). The Land Acquisition Act No. 47 of 1967 gives the president the power to acquire land for public use. But Section 179 of the Land Act (1999) and Section 11 (1 and 2) of the Land Acquisition Act (1967) provide for the protection of the rights of landholders, and Section 24 (1 and 2) of the Constitution offers land occupiers protection when compulsory land acquisition is exercised (73). The Tanzanian government has recognised the urgent need for planned land in and around Dar es Salaam and has been supportive of private surveying companies conducting town planning and land surveys in Dar es Salaam. This has resulted in a scramble for land in peri-urban areas, such as in Kigamboni Municipality, where land parcels from multiple residents are bought in order to survey and parcel into plots for reselling. Joint ventures are also created with local communities to undertake land readjustment, planning and sharing the profits of the sale of excess plots (67). Cartwright et al. (2018) have underscored the need to enhance government capacity for partnerships with civil society, traditional leaders and what is loosely termed the informal sector to accelerate land titling, service delivery and revenue collection (73). City and national authorities will need to increase urban planning capacity and resources, as a lack of staff capacity constrains effective management (18). In 2011, a survey of 12 African countries found, on average, 0.89 planners for every 100,000 residents across the 12 countries and 0.34 planners per 100,000 residents in Tanzania. This was far lower than in high-income countries (12.77 in U.S. in 2010 and 23.47 in Australia in 2009/10) (82). Limited literature exists on the planning capacities of local bodies in Dar es Salaam and Addis Ababa. 7. Transit Oriented Development (TOD) for Eastern African Cities As we discuss in the previous sections, the existing research on African cities has identified a transport deficit (private or public) and a prevalence of long-distance walking among those who lack other options (52, 54, 83). This indicates that commuters who do not own a motor vehicle (i.e., low-income groups) may lack access to the city or require a long commute (84, 85). The current mode splits in Dar es Salaam and Addis Ababa are dominated by walking and public transport (55, 57). Thus, as described in the TOD Standard principles (see 4.1) and encouraged by the World Bank (18), public transport projects that can greatly facilitate accessibility cannot be planned in isolation from the adjoining land uses and economic activities. This current conundrum of Eastern African cities like Dar es Salaam and Addis Ababa of long commutes and a lack of formal housing supply can be mitigated through affordable and reliable transport (86–88) and by providing affordable housing in more accessible locations or by investing in the in-situ slum upgrading programs (89,90). Conventionally, affordable housing and affordable transport are seen as two separate or parallel policy interventions but Eastern African cities like Dar es Salaam and Addis Ababa present a compeling case for them to be viewed and planned together. Further, non-motorised infrastructure should also be a 31 BASELINE REPORT: HVT CITY RETROFIT FOR ALL priority in public transport projects and other planning efforts in these cities, in part as a reflection of the high walking mode share and in part to facilitate access to public transport. Transit-oriented development (TOD) may emerge as a useful planning concept for the Eastern African cities. TOD may be viewed differently in different continents (91, 92). TOD promises the long-pending agenda of land use and transport integration in urban planning practice. International researchers and practitioners claim its merit as a low carbon development strategy as it reduces the number and length of trips generated and enables a shift to no or low carbon modes (93–95). TOD first developed as a response to the proliferate low-density suburban sprawl in American cities (96), but further evolved as a way to improve quality of life and promote context-specific, low-carbon urban development in many cities of the Global South (97). The main principle of TOD revolves around concentrating dense and diverse development (residential, commercial, etc.) around public transport corridors to induce a modal shift from private motorised modes to public transport, walking and cycling (5,6). When people can easily access jobs, education and healthcare by using public transport, ridership increases, in turn making public transport systems more viable and selfsustaining (5). By doing so, TOD also builds a symbiotic relation between public transport and development in its vicinity. TOD plans further accelerate the value in the land adjoining to public transport, which can be captured and used for more investments in the public transport influence zones (97, 98). TOD also can make cities more liveable by planning walkable and cycle-friendly neighbourhoods and a welldesigned public realm (99). This in turn can improve liveability and quality of life. TOD can be central to a development paradigm that is more environmentally sustainable and more socially just, and contributes to both the economy and quality of life of a city (75–77). City leaders must understand and unpack all the components of TOD to contextualise them, especially in emerging cities with a large fraction of residents living in informal settlements. In many lower-income countries, TOD plans will need to avoid inadvertently causing an increase in land values that prices out the low-income groups from the public transport influence zones (100). In Dar es Salaam and Addis Ababa, TOD plans will also need to create opportunities to upgrade informal settlements near public transport. 7.1 TOD for Eastern African cities—implementation principles ITDP has developed the TOD Standard guidance document as a tool to help shape and assess urban development. It focuses on maximising the benefits of public transit and non-motorised mobility while placing the emphasis firmly back on the users: people. The Standard outlines eight core principles of urban design and land use, each supported by specific performance objectives and easily measurable indicators, or metrics. Together, they promote safe, balanced and vibrant neighbourhoods around stations; short and wellconnected pedestrian and cycling networks; densities that ensure strong customer bases for local services and public transport; and minimal car traffic and parking interference. The Standard is addressed to a broad range of technical and non-technical audiences including policy-makers, planners, city officials, developers, architects, urban designers, landscape designers, civil engineers, civil society organizations and the interested public. By providing a way to quickly evaluate the planning and design components that are key to successful TOD. As described in the TOD Standard, TOD plans typically combine accessible street networks; improved street and public realm design; street-oriented buildings; and the upgrading of basic, municipal infrastructure. To achieve these outcomes in the low-income country context may require a different approach than in wealthier countries. We reviewed the literature on the implementation of TOD in the low-income country context and identified the following implementation principles (in addition to the planning principles described in the TOD Standard). 1) Create benefits for transit users and land developers: The central aim of TOD is to attract communities to live near transit. To make the areas around transit more attractive, the public realm needs to be expanded. TOD plans should create win-win situations through planning mechanisms by allowing more floor space (higher FSI/FAR) in exchange for more land dedicated to the public realm, facilitating a better street network and well-designed public spaces (101). TOD plans then become market responsive mechanisms that strengthen the public realm while promoting (re)development of 32 BASELINE REPORT: HVT CITY RETROFIT FOR ALL private land (102,103). This is particularly crucial in case of Eastern African cities where disjointed road networks hinder both walkability and systematic real estate development. 2) Incorporate flexible land use planning: The land use planning approach should promote flexible, demand-based, efficient use of land and balance key regulations to ensure the implementation of basic TOD principles, with incentives to attract investments, jobs and people in the strategic public transport influence area (104). Land use regulations should allow and promote the mixing of compatible land uses, attracting housing, shopping and job opportunities to co-exist in a compact form near public transport. 3) Promote demand-based re/development on private lands: Eastern African cities can benefit from the redevelopment of private lands if there are systematic investments in public infrastructure (105). Cities can pilot a few influence zone plans where there is higher market potential, followed by the areas where the land market is frozen given the limited infrastructure (103). Planning mechanisms can facilitate the process of land pooling or land re-constitution (in case of large parcels or industrial plots to be redeveloped) (104). Real estate market potential analysis is a crucial component of TOD planning. 4) Create value through infrastructure: With upgraded infrastructure and a better street network as part of the TOD plans, the value of land adjoining public transport will be even higher than what is existing in many core parts of the city. The planning, municipal and public transport agency officials need to understand closely how investments in the public transport create value in the real estate markets and how a part of this value can be captured to finance the mass rapid transit itself (103). Given the limitations in existing revenue generation mechanisms, land value capture can create winwin for all agencies and stakeholders while accruing quality of life benefits to the city. 5) Achieve better street and public space design: implementing better street design and infrastructure can help attract more commuters to use the public transport (106). 6) Identify a clear implementation roadmap: TOD plans should chart out a clear implementation mechanism (possibly with the support of the state planning legislative mechanism). Specific implementation plans can facilitate land re-adjustment, land agglomeration, affordable housing schemes and street improvement projects (104). 8. Summary of Literature Review Tanzania and Ethiopia are urbanising rapidly with an average annual growth in the urban population of 4.6% in the period from 2010 to 2015. Continuous rural-urban migration, land tenure insecurity and a housing deficit has led to proliferation of informal settlements on under-serviced peripheral land parcels. By the UN definition of a slum,8 an estimated 70–80% of the urban population in Ethiopia and about 50% of the urban population in Tanzania lives in what might be considered slums. Dar es Salaam and Addis Ababa being the largest city in these countries respectively, are at the forefront of this rapid urban growth and proliferation of informal settlements. Poverty, informal work and daily commutes are closely associated with each other. The horizontal urban sprawl in Dar es Salaam and Addis Ababa imposes a financial burden on the urban poor because of long trips and multiple transfers. Unplanned settlements in the periphery have been described as a ‘poverty trap’, where upward income mobility is challenging (21). Both cities are also characterised by long travel distances and largely informal public transport. Poor land use and transport integration and inefficient land management further complicate the situation for the poor and informal workers in these cities. Transport has been identified as a key factor for the economic growth and social development process because it facilitates the movement of people and goods and thereby promotes trade and better standards of living through improved access to markets, employment, health, education and social services. Improved productivity and output due to better public transport help to lower transaction costs, allowing economies of scale, widen opportunities, expand trade, integrate markets, strengthen effective competition and eventually 8 UN-HABITAT defines a slum household as a group of individuals living under the same roof in an urban area who lack one or more of the following: 1. Durable housing of a permanent nature that protects against extreme climate conditions. 2. Sufficient living space which means not more than three people sharing the same room. 3. Easy access to safe water in sufficient amounts at an affordable price. 4. Access to adequate sanitation in the form of a private or public toilet shared by a reasonable number of people. 5. Security of tenure that prevents forced evictions. 33 BASELINE REPORT: HVT CITY RETROFIT FOR ALL increase real income and the welfare of society (107). Currently, while public transport enjoys a high mode share in the Eastern African cities of Dares Salaam and Addis Ababa, a deficit in coverage and inefficiencies in the systems mean that these cities face challenges in delivering on the goals of sustainable transport. Walking has a high mode share, which also reflects structural problems of affordability and lack of access, particularly because the trips are long. Positive outcomes from a robust public transport system can be further strengthened by integrating land use and public transport plans and developing land-based financing tools to support mass rapid transit investments (108). While cities are growing rapidly in Ethiopia and Tanzania, land use regulatory systems are not able to keep pace with the growth. Both countries have interesting policies to learn from and build upon, but some structural issues will need to be addressed in terms of capacity and alignment between different levels of government. This is most apparent in the lack of affordable housing, the proliferation of informal housing and the lack of state provision of basic services. In this context, TOD can help to coordinate and integrate land use and public transport planning in a systematic way and to secure a low-carbon and sustainable future for Eastern African cities such as Dar es Salaam and Addis Ababa. SECTION 3: CITY ASSESSMENT In the following section we assess current conditions, trends, policies and capacities related to TOD in the target cities in Ethiopia and Tanzania. This includes an assessment of key indicators and policies at various levels of government as well as a qualitative assessment of trends and capacities for TOD based on a series of stakeholder interviews in each city. 9. City-Level Data In the following sub-section, we describe the results of a quantitative analysis of urban development indicators for the four target cities in Ethiopia and Tanzania. The indicators were selected to provide a citywide description of attributes related to urban growth, TOD and the five goals of urban transport: access, Equity, Efficiency, Environment, and Health and Safety. We selected citywide indicators to enable normative comparisons to other cities and regions, comparison within the sample group and comparisons over time. Where possible, we also tried to select indicators that we could assess spatially as well, to understand differing conditions within cities. Our ability to measure outcomes related to these goals was limited by data availability and completeness. Many indicators only allow comparison across one aspect (e.g., comparison over time) and not across geographies. Because of these data limitations, we were not able to measure outcomes related to all the goals listed above. We used our judgement to select the most relevant information among the indicators to present and understand urban growth and other conditions related to TOD. The indicators were derived from multiple sources, including ITDP’s Pedestrians First tool; the Sustainable Development Goal Indicators, compiled by UN-Habitat; the United Nations World Urbanization Prospects; and the Global Human Settlement‒Urban Centre Database (GHS‒UCDB), developed by the European Commission. The full set of indicators are listed below: ï‚· Population (2015) ï‚· Weighted population density ï‚· Average annual population growth rate (2000‒2015) ï‚· Projected annual population growth rate (2020‒2035) ï‚· National proportion of urban population living in slums (2000) ï‚· National proportion of urban population living in slums (2018) ï‚· National annual mean levels of fine particulate matter (e.g., PM2.5 and PM10) in cities ï‚· Fraction of area built-up (2015) ï‚· Mean block density ï‚· People near services 34 BASELINE REPORT: HVT CITY RETROFIT FOR ALL ï‚· People near frequent transport ï‚· People near rapid transport ï‚· People in green areas ï‚· People near grade-separated roadways ï‚· Transport CO2 per capita (kg/year/cap) 9.1 Indicator description The following section describes the indicators that we use to assess the status of urban development in the target cities. Some of these indicators describe current conditions, while others describe changes in conditions over time. 9.1.1 ITDP indicators ITDP developed the following indicators based on publicly available open-source data and open-source algorithms to help understand current conditions in cities, with a primary focus on walkability and public transport accessibility. Weighted population density, Mean block density and People near services are taken directly from Pedestrians First, which in turn is based on the TOD Standard. The TOD Standard was developed by ITDP in consultation with experts on sustainable urban development, including leading consultants, academics, non-governmental organisation (NGO) staff and development bank staff. These indicators, originally based to measure at the project or neighbourhood scales, have been tested over seven years in multiple contexts. In 2020 ITDP released Pedestrians First (109), which is based on the TOD Standard but adds city-level metrics with targets to the analysis. The Pedestrians First indicators have been applied widely, allowing us to indicate how the values in the target cities compare to those in other cities and regions around the world. The third indicator, People Near Limited-Access Roadways, was developed as part of this assessment and is not discussed in the TOD Standard. We have included targets suggested in Pedestrians First for the three indicators as a normative reference point for evaluation of the indicators in each city. These targets are related to the targets set in the TOD Standard, but since the indicators in Pedestrians First are slightly different, to account for measuring at the citywide scale, the targets are different as well. The targets are based on input from sustainable transport practitioners from around the world who contributed to the development of Pedestrians First. For other indicators, we have indicated a generally normative directionality—e.g., if fewer people live adjacent to limited-access roadways, that tends to be better for access, health and other goals—but we have not included a specific target, as we have not identified a publication that sets such a normative target. These indicators have two major limitations. First, most of the indicators (with the exception of National Proportion of Urban Population Living in Slums) only measure conditions at a single point in time, so it is unclear how the indicators have changed over time. Second, for some of the ITDP indictors (Block Density, People Near Services and People Near Limited-Access Roadways) the measurements are limited by the data quality of the open sources we use. Much of the information is crowdsourced, so the data are only as good as the level of participation and rigor that goes into data collection and data entry. We have designed the indicators so that more accurate data result in higher scores. Unfortunately, this means that wealthier cities with greater technological capacity and more active OpenStreetMap communities will sometimes achieve indicators that make them appear to be more walkable than lower-income cities that may be actually more walkable. 9.1.1.1 Weighted population density Higher population densities (more people per square kilometre of land) are related to greater access to goods and services. Higher densities support more frequent public transport and improved public services. Higher population densities are also identified in the TOD Standard as a key component of TOD (110). The weighted population density expresses the number of people per square kilometre in each district of a city, weighted by the percentage of the total city population living in that district. Thus, the densities of the most populated districts are weighted more heavily than less populated districts, even if the most populated districts are small in area. This reflects the density as it is experienced by the average person in an urban area. This is in contrast to total population density, which divides the total population by the total urbanised land area. The weighted 35 BASELINE REPORT: HVT CITY RETROFIT FOR ALL population density better reflects the density experienced by the city’s population, since average population density underrepresents high-density districts with small land areas and over-represents low-density districts which occupy large amounts of land. We have included a recommended target of at least 15,000 people per square kilometre, taken from Pedestrians First. Weighted population density is calculated using the Global Human Settlement Layer (GHSL) density ‘raster’ information, which provides an estimate of the population in each square in the urban centre, as well as the area of the square. To calculate the weighted density, we calculate the density of each square (population divided by area) and then multiply it by the fraction of the urban centre population that it represents (population of square divided by total population). We then sum the weighted density of each square in the region to calculate the total weighted density for the urban centre. 9.1.1.2 Mean block density Small city blocks reduce the distance between destinations by creating more direct routes. Small blocks reduce travel times and makes it easier to walk to destinations (111). Shorter blocks may also reduce traffic speeds, as motor vehicles must slow down frequently at intersections. Lower motor vehicle speeds are linked to lower instances of traffic crashes, injuries and deaths (112). The TOD Standard identifies small blocks as a key component of TOD (110). We have included a target of a block density greater than 80 blocks per square kilometre based on the guidance in Pedestrians First. The block density of a city is equal to the total number of walkable blocks in the city divided by total size of those walkable blocks in square kilometres. This represents the overall density of city blocks, excluding regions of the city like rivers, lakes, parks and industrial zones that are not part of the urban fabric. A ‘walkable block’ is an area surrounded on all sides by walkable streets or paths and not bisected by any walkable streets or paths. 9.1.1.3 People near services Proximity to essential services is a key element of TOD. The TOD Standard identifies access to local services (schools, healthcare service, pharmacies and sources of fresh food) and parks and playgrounds as important aspects of TOD (110). Core services that lie within a 15-minute walk are far more accessible to a range of people than services farther away. This indicator measures the fraction of the city’s population within 1,000 metres of both healthcare and schools, which provide a reasonable proxy of access to other services. When mapped, it highlights disparities in access to basic services among neighbourhoods in a city. We have included a target of 100% of the population within a short distance of core services, based on guidance in ITDP’s Pedestrians First toolkit. Walking distance is measured as the actual distance along the city’s network of walkable paths rather than the simple straight line buffer distance. Differences in the street network means that 1,000 metres in actual walking distance can vary greatly from what is in the 1,000-metre buffer zone, with ranges of what can be reached in the zone by actually walking 1,000 metres being only 30% to 80% of the zone. Healthcare facilities include hospitals, doctors’ offices, clinics, pharmacies and midwives but do not include dentists, psychotherapists, or other specialists. Schools include primary and secondary public schools but not universities.9 9.1.1.4 People near limited-access roadways The presence of limited-access roadways creates strong separations between neighbourhoods, often preventing pedestrians from crossing the road at many points. By reducing direct pedestrian access, the presence of divided highways leads to longer walking and cycling trips and lower access. The TOD Standard identifies direct and prioritised pedestrian connectivity as a key component of TOD (110). By bypassing local streets, limited-access roadways also serve to attract motor vehicle trips, through a triple convergence, with more trips at peak hours, more trips from other parts of the street network and more trips shifting to private motor vehicles. This concentration of motor vehicle trips on divided highways creates increased noise, increased local air pollution, increased speeds on nearby roads and high rates of traffic injuries and deaths. All of these reduce the ability to walk to destinations. We do not include a normative target, as this is a new 9 The TOD Standard measures access to local services slightly differently, omitting secondary schools but including fresh food sources. 36 BASELINE REPORT: HVT CITY RETROFIT FOR ALL indicator, but based on the negative impacts described above, we suggest that fewer people near limited access roadways is more in line with the principles of TOD. The ‘people near highways’ (divided motorways) indicator measures the number of people within 500 metres of a divided highway, divided by the total metropolitan population. 9.1.2 UN-Habitat Sustainable Development Goals indicators As part of the tracking of the Sustainable Development Goals (SDGs), the United Nations Human Settlements Programme (UN-Habitat) tracks a number of indicators towards those goals at the national level (113). The primary goal of interest for our research is Goal 11: Make cities and human settlements inclusive, safe, resilient and sustainable. Under Goal 11, there are multiple targets that are useful to this research, particularly: ï‚· 11.1 By 2030, ensure access for all to adequate, safe and affordable housing and basic services and upgrade slums; ï‚· 11.2 By 2030, provide access to safe, affordable, accessible and sustainable transport systems for all, improving road safety, notably by expanding public transport, with special attention to the needs of those in vulnerable situations, women, children, persons with disabilities and older persons; ï‚· 11.3 By 2030, enhance inclusive and sustainable urbanisation and capacity for participatory, integrated and sustainable human settlement planning and management in all countries; ï‚· 11.6 By 2030, reduce the adverse per capita environmental impact of cities, including by paying special attention to air quality and municipal and other waste management; and ï‚· 11.7 By 2030, provide universal access to safe, inclusive and accessible green and public spaces, in particular for women and children, older persons and persons with disabilities. While data on all of these targets would provide useful context to this research, only targets 11.1 and 11.6 have indicators that are currently being tracked at the national level. Indicator 11.1.1 tracks the proportion of urban population living in slums, and Indicator 11.6.2 tracks the annual mean levels of fine particulate matter (e.g., PM2.5 and PM10) in cities (population weighted). 9.1.2.1 Proportion of urban population living in slums SDG indicator 11.1.1 tracks the proportion of urban population living in slums. Slums, often referred to as informal settlements or informal housing, are areas that often develop outside of official planning regulations and without basic urban services. They are often illegal and do not experience government protections. In terms of TOD, the prevalence of informal settlements provides an indication of how effective government policies and regulations have been in the past at managing urbanisation patterns, for better or for worse. The proportion of urban population living in slums provides context at the national level of the prevalence of slums in urban areas. The United Nations defines a slum as a place with: ï‚· lack of access to improved water source, ï‚· lack of access to improved sanitation facilities, ï‚· lack of sufficient living area, ï‚· lack of housing durability and ï‚· lack of security of tenure (114). The indicator is determined largely from household surveys conducted in each country. We include nationallevel data for 2000 and 2018. 9.1.2.2 Annual mean levels of fine particulate matter (e.g., PM2.5 and PM10) in cities SDG indicator 11.6.2 tracks the prevalence of poor air quality in cities. This is measured by the urban population-weighted, mean annual concentration of fine suspended particles of less than 2.5 microns in diameter (PM2.5). The metric is shown in micrograms per cubic metre [μg/m3] (115). This indicates the level of pollution experienced by urban dwellers in each country. We include data for 2016, the only year available. 37 BASELINE REPORT: HVT CITY RETROFIT FOR ALL 9.1.3 United Nations World Urbanization Prospects The United Nations Department of Economic and Social Affairs compiles data on urban growth in countries and cities around the world, as part of the World Urbanization Prospects. 9.1.3.1 Projection annual population growth rate (2020‒2035) The 2018 World Urbanization Prospects includes projected population data for urban agglomerations with populations greater than 300,000 (15). The data are provided by national governments, who also define what is meant by an urban agglomeration in their country. We used the data from 2020 and for 2035 to calculate the projected average annual growth rate in each city. The data did not include Bahir Dar. 9.1.4 Global Human Settlement‒Urban Centre Database (GHS‒UCDB) The Global Human Settlement‒Urban Centre Database is a set of information development by the European Commission to understand urbanisation around the world (116). The database is based on the GHSL, which draws on analysis of satellite imagery to identify urban areas around the world. The information is calculated on a grid of squares (a ‘raster’ image). The GHSL defines urban centres based on a series of criteria that are applied uniformly around the world. The GHS‒UCDB uses data from the GHSL plus other publicly sourced information to develop a series of indicators. We have included these indicators, as well as indicators that we calculated from the GHSL information, as they provide critical information on how growth is occurring in cities over time. We indicate below if and how each indicator is related to the TOD Standard definition of TOD. 9.1.4.1 Population (2015) This indicator expresses the population within the urban area, as defined by the GHSL. This is included to show the relative populations of the cities under consideration. This is calculated using census data, allocated to a grid defined in the GHSL, based on the built-up percentage of each cell in the grid. The total population is the total of all cells within the defined urban centre. 9.1.4.2 Average annual population growth rate (2000‒2015) The average annual population growth rate reflects the yearly change in population from 2000 to 2015. Higher rates indicate a faster growing city. The growth rate is calculated by dividing the change in population from 2000 to 2015 by the number of years (15) and dividing the resulting figure by the 2000 population. We also include the information spatially to indicate where growth has occurred within each city (see 9.3 Spatial analysis of key indicators). 9.1.4.3 Fraction of urban area built-up (2015) According to the TOD Standard, a key component of TOD is a compact region, meaning that built-up areas are directly adjacent to each other (110). This reduces distances between built-up areas and the time and energy needed to reach other parts of the city. The fraction of the urban area that is built up provides an indication of the spread of development across an urban area. A low fraction likely indicates a scattered development pattern with opportunities for infill development. A high fraction indicates a relatively compact region, where new development likely must either replace existing structures with taller ones or expand into the periphery. This indicator is calculated using the GHSL raster layer, which indicates whether each square in the urban centre contains buildings or not. To calculate the fraction of the urban area that is built-up, we divided the number of squares that contain buildings by the total number of squares in the urban centre. 9.1.4.4 Transport CO2 per capita (kg/year/cap) Transport carbon dioxide–equivalent emissions per capita indicate the environmental sustainability of the existing transport systems in an urban area. Higher values indicate more emissions per person and greater harm to the environment. However, this information is only for 2015, so it does not show the trajectory of each city. The TOD Standard does not specifically measure emissions as a criterion for TOD, but reduced impact on the climate is cited as a benefit of TOD. This metric is measured by the European Commission’s Emissions Database for Global Atmospheric Research (EDGAR v4.3.2), which models the greenhouse gas emissions for transport in the year 2012 for the boundaries of each urban centre. We divided the total emissions by the population of the urban area to calculate the emissions per person. 38 BASELINE REPORT: HVT CITY RETROFIT FOR ALL 9.1.4.5 People in green areas Spending time in vegetated and natural areas has been shown to have a positive effect on mental health (117). Streets with dense tree canopies provide shade in hot weather and create a more interesting walking environment. Access to parks and the presence of shade on sidewalks are key elements of TOD, according to the TOD Standard (110). This indicator is calculated directly as part of the GHS‒UCDB, using an analysis of Landsat satellite imagery with the Normalized Difference Vegetation Index (NDVI) to identify the level of greenery of each square in the urban centre. Squares are then categorised as either ‘low green’, ‘medium green’ or ‘high green’ based on the level of greenery. The indicator measures the percentage of the urban area’s population living in the ‘high green’ area. The three levels of green are defined as: ï‚· Low green: barren rock, sand, snow or impervious surfaces (e.g., built-up areas); ï‚· Medium green: shrubs or agriculture; and ï‚· High green: dense vegetation (e.g., forest, gardens, etc.) (118). 9.2 Indicator data The following tables show the results of the indicators for target cities. Table 1: Indicator data for target cities. Indicator Addis Ababa Bahir Dar Dar es Salaam Mwanza Pedestrians First Target Population (2015) 3,830,790 492,271 5,345,515 782,040 n/a Weighted Population Density 24,453 60,423 24,012 16,567 15,000 Average Annual Population Growth Rate (2000‒2015) 2.5% 2.2% 9.5% 6.3% n/a Projected Annual Population Growth Rate (2020‒2035) 4.2% n/a 4.7% 4.8% n/a National Proportion of Urban Population Living in Slums (2000) 88.6% 88.6% 70.1% 70.1% n/a National Proportion of Urban Population Living in Slums (2018) 64.3% 64.3% 40.1% 40.1% n/a National Annual Mean Levels of Fine Particulate Matter (e.g., 34.0 34.0 25.1 25.1 n/a 39 BASELINE REPORT: HVT CITY RETROFIT FOR ALL PM2.5 and PM10) in Cities Fraction of Area Built-Up (2015) 27% 13% 40% 24% n/a Mean Block Density 78 79 40 17 >80 People Near Services 55% 32% 55% 33% 100% People Near Frequent Transport 13% n/a n/a n/a n/a People Near Rapid Transport 17% n/a 10% n/a n/a People in Green Areas 4% 15% 11% 28% n/a People Near Grade-Separated Roadways 24% 0% 0% 0% n/a Transport CO2 per Capita (kg/year/cap) 104 5 71 33 n/a In general, the target cities range in population from just under 500,000 to over 5 million people, a tenfold difference. The weighted population density of Bahir Dar, the smallest target city, was by far the highest of the four—nearly three times as dense as the next dense city. The other smaller city, Mwanza, has the lowest population density of the four. The cities in Tanzania have annual population growth rates (2000‒2015) that are much higher than those in Ethiopia. Dar es Salaam, the largest city we considered, showed a tremendous growth rate, indicating an extraordinary volume of people moving to the city. However, the projected annual population growth rates (2020‒2035) show faster growth in Addis Ababa and slower rates in Tanzanian cities. Both past and projected annual growth rates indicate rapid growth for these cities going forward. This rapid growth could make TOD interventions more challenging to implement. However, if the interventions are effective, they could have a greater impact in a shorter time. The percentage of the national urban population living in slums is nearly 65% in Ethiopia, indicating a severe lack of formality in housing and potentially a very limited reach of government. The percentage in Tanzania is over 40%, which also indicates a limited reach of government, but to a lesser degree. This is also partly a reflection of the pace of growth and partly the efficacy of the government and the private sector to provide housing. It is notable, however, that these values have decreased substantially since 2000 in both Ethiopia and Tanzania (22.3% decline and 30% decline, respectively), indicating successful efforts to reduce informality, despite urban growth. The national annual mean levels of fine particulate matter in cities is best understood in comparison to other regions, not included in the charts. ï‚· Europe and Northern America 12.0 ï‚· Latin America and the Caribbean 16.8 ï‚· Tanzania 25.1 ï‚· Ethiopia 34.0 40 BASELINE REPORT: HVT CITY RETROFIT FOR ALL ï‚· Sub-Saharan Africa 35.5 ï‚· World 39.6 ï‚· China 51.0 ï‚· India 68.0 The mean levels of fine particulate matter in cities in Tanzania and Ethiopia are significantly below urban levels in China and India and below levels for the world and for Sub-Saharan Africa. However, the levels are significantly above those in Europe, North America, Latin America and the Caribbean. This indicates that there is much room for urban air quality to improve, but that it is not at a crisis level as it is in places like China and India. Without data over time, we are unable to say if air quality is improving or declining. The fraction of area built-up (2015) is below 40% for all four cities, indicating a relatively scattered development pattern. This may also indicate an opportunity for infill development to create a more compact city as opposed to increasing the horizontal extent of the city. While Bahir Dar had the lowest fraction of area built up, it had a high mean block density of nearly 80 blocks per square kilometre, as did Addis Ababa. This indicates that where development is occurring in both cities, the street layouts are more conducive to walking. In the Tanzanian cities, the mean block density was less than half of the target in Dar es Salaam and far less than in Mwanza. This structural issue may create long-term challenges to walkability in these cities. A low block density may also reflect a high level of informality and/or lower data quality from crowdsourced data repositories. Mwanza’s block density seems like it may reflect lower data quality than the reality. In terms of people near services, the larger cities appear to have more people living near services. This may be due to a variety of causes. Larger cities may receive more attention from centralised governments. Often larger cities also have higher urban densities, making it easier to provide services to many people at a single location. However, the weighted population density of Bahir Dar, the smallest target city, was by far the highest of the four—nearly three times as dense as the next dense city. Fewer people near services may also be partially due to lower data quality from open data sources. Larger cities often have a larger pool of people who may contribute to crowdsourced data collection efforts, generating more accurate data for the city. Larger cities also have more resources (money and staff) to support such crowdsourced data collection activities. Mwanza has the highest percentage of people in green areas. This may reflect a more rural nature of development. None of the cities have freeways within the built-up area, so all four cities show a value of 0% for people near grade-separated roadways. This limits the physical obstacles to TOD in these cities. However, Addis Ababa does have some roadways with a semi-grade separated typology, so the result is partly due to inaccuracy in roadway coding in OpenStreetMap. It is also worth noting that a large flyover construction project is underway in Dar es Salaam. 10 Finally, the transport CO2 emissions per capita were highest in Addis Ababa, followed by Dar es Salaam, indicating a greater prevalence of motorised travel, longer travel distances and/or higher emissions rates from the vehicles in that city. Bahir Dar has by far the lowest estimate of transport emissions per capita. This could be due to a city design that is more conducive to walking, with smaller blocks and higher densities, and possibly short trip distances in a smaller city that can be more easily made by non-motorised modes. 9.3 Spatial analysis of key indicators The following section presents maps of several key indicators across each metropolitan area. We have also included a map of the mass rapid transit coverage within Dar es Salaam and Addis Ababa, which have these types of services. Rapid transit includes metro systems, bus rapid transit (BRT) systems and light-rail (LRT) systems. 10 ‘Flyover project pace thrilling’ [Internet]. Daily News. Tanzania Standard (Newspapers) Limited. 2020 [cited 21st Nov 2020]. Available from: https://dailynews.co.tz/news/2020-06-195eecf5711cce8.aspx 41 BASELINE REPORT: HVT CITY RETROFIT FOR ALL 9.3.1 Addis Ababa The following maps of indicators for Addis Ababa are generated from selected indicators above. In assessing the population map, it appears that the central area of the city is much denser than outlying areas. It is wellcovered by social services, and many central areas are served by the city’s LRT system. The outer areas, however, do not have the same level of access to services. In many places, rivers seem to be borders separating neighbourhoods with highly walkable block densities. Pedestrian and bicycle bridges could have potential to improve access across them. The north of the city is very dense and rapidly growing, with good access to services. It has no rapid transit, and it has some of the city’s lowest block densities, making walking more challenging. The east is served by the LRT and could possibly support more TOD. The southwest seems to struggle with mobility. All three areas show neighbourhoods of high block density, although the neighbourhoods are often disconnected from each other. These areas also have lower access to services than more central areas. The areas south and west of the airport have relatively low population densities and relatively disconnected blocks (although Addis Ababa generally has high block densities). However, they also have strong public transport connections through the LRT, some frequent buses and the anticipated B2 BRT line. These areas may be good candidates for infill. Access to services is weak in these areas. Figure 16: Addis Ababa population density. Source: ITDP. 42 BASELINE REPORT: HVT CITY RETROFIT FOR ALL Figure 17: Addis Ababa population growth 2000‒2015. Source: ITDP. Figure 18: Addis Ababa block density. Source: ITDP. 43 BASELINE REPORT: HVT CITY RETROFIT FOR ALL Figure 19: Addis Ababa people near services. Source: ITDP. Figure 20: Addis Ababa population near transit. Source: ITDP. 44 BASELINE REPORT: HVT CITY RETROFIT FOR ALL Figure 21: Addis Ababa grade-separated highways. Source: ITDP. 9.3.2 Bahir Dar The following maps of indicators for Bahir Dar are generated from selected indicators. As Bahir Dar is a smaller city with lower internet penetration, crowdsourced data—particularly for services—are likely of lower quality than in larger cities. With this in mind, the data should be interpreted as indicative of development patterns in the city. Higher levels of access to services are concentrated in the northwest and, to a lesser extent, the area between the lake and the river along University Road. Services are available in other areas but are not captured in the data sources we used. Both the south and southwest areas of the city appear to be more formally planned, with regular and dense street grids. However, there are unpopulated areas between these neighbourhoods. Perhaps there is an opportunity for infill in these locations, allowing the city to grow in a compact manner. This opportunity is present to a lesser extent in some of the more central areas as well. The eastern areas across the Blue Nile are only connected to the rest of the city by a single bridge in the north. 45 BASELINE REPORT: HVT CITY RETROFIT FOR ALL Figure 22: Bahir Dar population density. Source: ITDP. Figure 23: Bahir Dar population growth 2000‒2015. Source: ITDP. 46 BASELINE REPORT: HVT CITY RETROFIT FOR ALL Figure 24: Bahir Dar block density. Source: ITDP. Figure 25: Bahir Dar people near services. Source: ITDP. 47 BASELINE REPORT: HVT CITY RETROFIT FOR ALL 9.3.3 Dar es Salaam The following maps of indicators for Dar es Salaam are generated from selected indicators above. Maps for grade-separated roadways are not included, as they are not found in the city. Dar es Salaam appears to be well-mapped on OpenStreetMap, likely leading to more accurate measurements of the indicators. Dar es Salaam’s densest areas comprise a vertical stretch from Mwenge, Sinza, Kijitonyama and Mwananyamala in the north to somewhat beyond Mbagala in the south. The stretch is about 13 kilometres north–south and 5 kilometres east–west. Although the very high levels of density are largely in a coherent area, the stretch is occasionally interrupted. The Kizinga River is the clearest interruption, but the Msimbazi River and Nyerere Road are also gaps in the dense stretch. Flooding makes the banks of the Msimbazi River difficult to develop into housing, but the area potentially could be developed into formal open space (e.g., public parks). Outside of this dense band, there are areas of dense population to the north, west and especially east. Beyond that, there are areas that were not populated as of GHSL data collection in 2015 but that show urban settlement characteristics, such as a grid of streets and paths, in OpenStreetMap. Growth has largely followed a radial pattern, to the north, west, southwest and south. The highest levels of growth, however, occurred in a more central band of neighbourhoods to the west and southwest of the city centre. The northern end of the high-density area is served with rapid transit, via the BRT corridor there, but most of the high-density stretch is not. The central area of the city, including most of its densest areas, is fairly wellcovered by services. The only very dense areas without services are Kiwalani, Mtoni, Kigamboni and the areas south and west of Kipala/Mbagala. In the outskirts, dense clusters are developing as nodes along R759, Bagamoyo Road, Kilwa Road and especially Morogoro Road, where it extends beyond the BRT corridor. These clusters almost always lack walkable access to services. Overall, Dar es Salaam has a very low block density, posing major challenges for walkability. Many areas of high population density have very low block density because the streets have many dead ends. This is true even in some areas of the high-density band. Some neighbourhoods, gridded and un-gridded, have higher block densities and are more conducive to walking, but they are generally separated from each other. Many of the areas of high block density may consist of unpaved paths, particularly in peri-urban areas. 48 BASELINE REPORT: HVT CITY RETROFIT FOR ALL Figure 26: Dar es Salaam population density. Source: ITDP. Figure 27: Dar es Salaam population growth 2000‒2015. Source: ITDP. 49 BASELINE REPORT: HVT CITY RETROFIT FOR ALL Figure 28: Dar es Salaam block density. Source: ITDP. Figure 29: Dar es Salaam people near services. Source: ITDP. 50 BASELINE REPORT: HVT CITY RETROFIT FOR ALL Figure 30: Dar es Salaam people near rapid transit. Source: ITDP. 9.3.4 Mwanza The following maps of indicators for Mwanza are generated from selected indicators above. Maps for rapid transit and grade-separated roadways are not included, as they are not found in this city. Like Bahir Dar, Mwanza is a smaller city, and the crowdsourced data, particularly for services, do not appear to be as robust as in larger cities. Mwanza’s pattern of population density is characterised by radial axes, most notably along Kenyatta and Sirari-Mbeya roads, but also secondarily along smaller roads branching from these corridors. The radial growth pattern and limited street grid between these axes likely makes it difficult for people to move from one corridor to the other. Recent growth has largely followed this radial pattern. There may be opportunities for infill in the areas between axes, especially with sustainable mobility infrastructure creating circumferential connections. As in Dar es Salaam, block density is low throughout the city, creating more challenging conditions for walking. The core of Mwanza is well-covered by services. The areas immediately around the core seem to have partial coverage, and coverage is rare along the radial axes. 51 BASELINE REPORT: HVT CITY RETROFIT FOR ALL Figure 31: Mwanza population density. Source: ITDP. Figure 32: Mwanza population growth 2000‒2015. Source: ITDP. 52 BASELINE REPORT: HVT CITY RETROFIT FOR ALL Figure 33: Mwanza block density. Source: ITDP. Figure 34: Mwanza people near services. Source: ITDP. 53 BASELINE REPORT: HVT CITY RETROFIT FOR ALL 9.4 Overall assessment The following section contains overall takeaways for each city, based on both the overall city indicators and the geospatial analysis. Addis Ababa Addis Ababa is a relatively large city (3.8 million population), and while it is growing quickly by wealthycountry standards, is has less than one fourth the growth rate of Dar es Salaam. The heavy informality of Ethiopia (64.3% living in slums) must be considered in the planning of TOD interventions. Addis Ababa has a relatively high block density, creating a strong foundation for TOD. However, street grids in informal areas may require modification in order to improve conditions. Modifying street grids once buildings have been constructed can be costly and complex, creating additional challenges for TOD. Further, the high rate of informality suggests that the higher densities may be due to many people living in overcrowded conditions. Other factors that may create favourable conditions for TOD include a population density that is well above the levels needed to sustain public transport and walkable local retail, a relatively high percentage of people near services (55%) and the existence of a nascent rapid transit network (in the form of LRT), a dense city centre and areas with potential for urban infill. Addis Ababa was deficient in access to green spaces and had the highest per-capita CO2 emissions from transport of the four cities in the sample. This situation could be ameliorated through TOD that includes quality environments for pedestrians and abundant vegetation. Bahir Dar By far the densest of the four cities, Bahir Dar could be an excellent candidate for TOD. Interestingly, its block density (78) was almost the same as Addis Ababa’s (79). Levels of informality may be similar to those in Addis Ababa, although this is difficult to ascertain, since we have country-level data. However, this suggests that this secondary city may have similar potential and challenges for TOD as Ethiopia’s capital. The lack of sufficiently high-quality data prevents this analysis from being more conclusive. Nonetheless, potential points in favour include a healthy percentage (15%) of the population with access to green areas and extremely low transport emissions per-capita, suggesting a high mode share of PT, walking and cycling. Further, while likely incomplete, the street network shows a well-planned grid in many places and open space in others. This could present opportunities for urban retrofit and infill/greenfield TOD development, respectively. Dar es Salaam Dar es Salaam is both the largest (5.3 million population) and fastest-growing of the four target cities. The 9.5% annual population growth rate means that if the city continues to grow at the same rate it will double its population in eight years, adding an additional 5.3 million people from 2015 to 2023. This creates an immense challenge for growth management. Similar to the other low-income countries, a high proportion of urban residents in Tanzania live in slums (40.1%). The weighted population density of 24,000 people per sq km likely reflects some of this informality. This can be seen in the near green spaces indicator, which shows only 11% of people living near green space. While the city has half the block density of the target cities in Ethiopia, only 40% of the area is built up, indicating room to develop infill housing and establish smaller blocks to support walkability. The lack of urban highways, and the existing and planned rapid transit are positive signs, allowing the city to grow around public transport instead of private automobiles. This could help support TOD-style growth. Mwanza Mwanza has the second-highest growth rate (only behind Dar es Salaam), so TOD could have an important impact in this city, structuring urban growth for decades to come. Although the data are for the whole country, there is likely a relatively high percentage of residents living in slums (40.1%), presenting the accompanying challenges for TOD implementation. 54 BASELINE REPORT: HVT CITY RETROFIT FOR ALL The high likelihood of missing street network data makes it difficult to draw conclusions about how these factors relate to the potential for TOD in the city. However, Mwanza has the highest percentage (28%) of the population living near green areas and is relatively well-covered by services, especially in the city’s core, as evidenced by the spatial analysis. That analysis also showed potential for infill development between radial axes, with possible circumferential transport connections. As in the other cities in the sample, the absence of urban highways could create an opportunity for TOD. 10. Policy and Planning Document Analysis The policies state the goals, plans and means of implementing polices for urban growth that can support TOD. Below, we examine the policy documents to understand how they relate to the concept of TOD. 10.1 Data The data sources for this section are primary sources including policy and planning documents. Any secondary data sources (e.g., reports, papers) are included in the literature review. Although there is overlap between the primary data in this section and the secondary data in the lit review, we separated the two kinds of sources into the respective sections. While we were able to gather some of the documents using web searches, most were acquired through contacts with colleagues at government institutions in Ethiopia and Tanzania. While policy and planning documents are generally widely available on the internet in wealthy countries, this is not always the case in lower-income settings. This section includes 37 policy and planning documents. Local researchers in Ethiopia and Tanzania were able to gather documents from those two countries (national level) as well as from the cities of Addis Ababa, Dar es Salaam and Mwanza. We were unable to gather documents from Bahir Dar. This is because Bahir Dar does not generally produce its own policy and planning documents but rather follows national guidelines, as we confirmed with authorities in that city. A web search for documents from Bahir Dar did not yield English-language planning and policy documents. We did find some documents on the website for Amhara State (http://www.amharainfo.gov.et/), of which Bahir Dar is the capital and largest city, but the few available documents were in Amharic. However, since national policy is the default urban policy for Bahir Dar, the policies and plans outlined in the documents for Ethiopia included in this analysis apply to that city. The documents include master plans, manuals, guidelines, checklists, organisational charts, proclamations, acts, regulations, strategies, maps and tenders. They vary greatly in length, from two to 158 pages. Please see Appendix A: Policy and Planning Documents below for a list of documents included in this section. 10.2 Document analysis After gathering the documents, we began the document analysis phase. Following Bowen (2009), the purpose of qualitative document analysis is to provide background and context, generate additional questions to be asked, provide a means for tracking changes and new developments, and triangulate the findings of other portions of this research (including the literature review and quantitative data) (119). This analysis employed the ‘lean coding’ approach described by Creswell (p. 184) (120). In this process, we: 1. Scanned the documents in their entirety, at least once and up to three times. 2. Create shorthand labels for thematic categories. For example, ‘creating TOD’ and ‘urban growth’. We started with the categories identified before the research began (outlined in the project proposal) and expanded as necessary. 3. We then identified relevant text in the documents with the labels developed above. Again, expand these labels as needed. This text may be sentence fragments, sentences or passages of the text. 4. We organised the text identified above into a central spreadsheet. We then organised the themes identified above into clusters or ‘domains’. 5. Finally, we summarised the results in this document. Regarding the creation of codes, categories and domains (outlined in steps 2, 3 and 4 above), we began with topics that we had identified as central to TOD and had outlined in the project proposal. The original thematic 55 BASELINE REPORT: HVT CITY RETROFIT FOR ALL categories were: urban growth, creating TOD, transportation plans, institutional structures and improving informal settlements, with the last theme having sub-themes of land readjustment, urban land tenure, street layouts and building controls. While these themes provided a good starting point, we modified them as we became more familiar with the policy documents. As anticipated, we expanded and rearranged the codes according to the contents of the documents and the topics that were most relevant to our study. From the original five themes and four sub-themes, we finally settled on 21 themes, grouped into six domains. These are presented in Table 2 below. Table 2: Domains and themes of policy documents. Domain Theme Urban Growth Planning Urban growth strategy Urban development Plans Public participation Transportation Planning Integration of transportation and land use Public transportation (PT) NMT Regulatory Tools Land use/zoning Building controls Parking Regulations for street layouts Land Management Tools Land expropriation Land readjustment Land banking Affordable/Low-Income Housing Affordable housing provision Improving informal settlements Land tenure Creating TOD Goals for TOD Implementation strategy Institutions responsible for TOD Financing and land value capture Vulnerable Groups Women, elderly, children, disabled, ethnic and religious groups, the poor The domains and themes listed above are interconnected, and many overlap considerably. ‘Urban growth planning’ explains ways that the cities dealt with urban growth in their policy documents. These encompassed strategies for urban growth, such as orientations for the physical urban form, including polycentric growth and growth along key corridors. The theme of plans for urban development described the structure of planning processes in the two countries and four sample cities as found in the policy documents, from national plans and municipal master plans to more localised plans. Finally, this domain included public participation, which is an approach to urban growth that brings the general population into urban planning processes and can impact the way growth happens. 56 BASELINE REPORT: HVT CITY RETROFIT FOR ALL Next, the domain of ‘transportation planning’ included instances where land use and transportation policies were planned together, as well as policies and plans that were specific to the modes of public transportation, walking and cycling. The domain of ‘regulatory tools’ includes tools that define where and how growth should take place on a more specific and smaller scale than the policies in the ‘urban growth planning’ domain. This includes regulations for land use and zoning, buildings, parking and street layouts. ‘Land management tools’ refers to existing procedures that can be used to create urban fabric for TOD developments. These include expropriation, land readjustment and land banking. While these may be useful, they may or may not be necessary for creating TOD. ‘Affordable/low-income housing’ included themes related to informal settlements but also providing housing for low-income residents that was not informal, such as government-provided housing. This also included land tenure, which is often an important topic for informal settlements. The domain ‘creating TOD’ included all policies and planning documents that were directly or indirectly related to implementing TOD in the four sample cities. This included the overall goals for TOD expressed in the documents, the strategies for implementing—as well as the institutions responsible for—TOD and any specific mentions of financing or value capture related to TOD. Finally, ‘vulnerable groups’ was a cross-cutting domain that encompassed topics relevant to all of those mentioned above. Here we included results for the policy document related to all the vulnerable groups we encountered in the policy documents, namely: women, elderly, children, disabled, ethnic and religious groups and people in poverty. We describe what we found in the policy documents in these domains and themes in sections 10.3 to 10.9 below. We then describe how these domains and topics align (or fail to align) with the creation of equitable TOD in Section Error! Reference source not found., which provides an analysis of the policy documents, and especially in Error! Reference source not found., where we analyse the policy documents with the results from the other quantitative and qualitative analyses we conducted for this report. 10.3 Urban growth planning There are numerous ways to guide the construction of new buildings; changes to the population, businesses and institutions; and how land in a city is used. In this section, we examine overarching strategies for growth, specific plans for growth and public participation in growth planning. 10.3.1 Urban growth strategy Urban growth strategies describe how governments approach urban growth, including problem identification, goal setting and growth-management mechanisms. The following section describes these aspects as they appear in policy documents for the target cities and countries. 10.3.1.1 Ethiopia A manual for Local Development Plans (LDPs) (121) says these plans will be used to re-develop existing urban centres, introducing planning to previously unplanned areas and ‘revitalising run down urban fabrics’ (p. 6). LDPs are explained further in the ‘Urban Development Plans’ section. The Street Design Standards for Urban Ethiopia (122) say that streets are fundamental to urban growth and development: Urban growth shall occur along the street network, as this is ‘the backbone of urban development and integration of utilities’ (p. 6). The proclamation regarding expropriation in Ethiopia (123) highlights the need to develop areas for housing and commerce in both existing urban and rural areas. The Urban Planning Proclamation (124) points out the ‘proliferation of unplanned urban centres’ (p. 1) in Ethiopia and the need for need for planned growth. 57 BASELINE REPORT: HVT CITY RETROFIT FOR ALL 10.3.1.2 Addis Ababa The Addis Ababa City Structure Plan Summary Report (125), which serves as the city’s master plan, points out the extreme growth that the city has recently experienced. In the last two decades, the city’s population had grown by 80%, and the city’s population was expected to continue to double every 15 years. The plan proposes to organise the population growth through poly-centric urban development based on existing urban centres in Addis Ababa, coupled with density along transport corridors. The plan ‘gives emphasis to integrated development of the city and its immediate environment’ (p. 18). The plan also stresses mixed-use PT corridor development: ‘Mass transit attracts/enables high-density development along corridors. In view of the scarcity of land in the capital, inner-city redevelopment could strategically focus on densification along these corridors. In addition, mass transport route development enables the government to re-structure the city in a polycentric manner’ (p. 39). The plan also emphasises housing and commercial corridors, calling for ‘coordinating mixed-use housing development and redevelopment along mass transit lines and business corridors’ (39). The planning approach of combining polycentric development with PT corridors is echoed in the TOR for a TOD consultancy service in Addis Ababa (126). This document outlines urban growth strategies for the city, including polycentric development, redevelopment (mixed-use development in key areas—‘City centres along mass transit lines and business corridors’ (p. 6), compact city development, mixed land use, PT, walking and cycling. 10.3.1.3 Tanzania Several principal policies in Tanzania have broad goals related to reducing sprawl and creating conducive environments for compact city growth. Issues of sprawling urban growth have been addressed in the National Land Policy (127), which calls for measures controlling lateral expansion of towns where compact development will reduce the cost of installing, operating and repairing infrastructure and shorten travel distances. The National Human Settlements Development Policy (128) points out issues in how Tanzania has been developing in the past decades, emphasising failures of previous policies to address population growth and increase of unplanned settlements. It calls for optimal utilisation of land to enable proper provision of services. Tanzania’s 2007 Urban Planning Act (129)—the principal act setting fundamental principles for urban development—specifies broad goals for sustainable development of land in urban areas and orderly growth through instructions for setting up general planning schemes to put a limit on municipal physical growth. The aim of addressing urban growth is reiterated in the 2007 Guidelines for Preparation of General Planning Schemes and Detailed Schemes for New Areas, Urban Renewal and Regularization Tools (130). The Guidelines stem from the two main policies: the Urban Planning Act (129) and the Human Settlements Development Policy (128), both published in 2007. 10.3.1.4 Dar es Salaam The Dar es Salaam City Master Plan 2016–2036 (131) proposes a decentralised approach to growth, putting attention on infill and densification in major sub-centres found at the junction of major roads—a form of de facto TOD (p. 24) (132). This strategy aims to merge the concept of compact growth with the idea of satellite cities strategically spread out along major arterials and ring roads. The aim of this strategy is to promote infill and densification, especially in areas within the city boundary that have experienced ‘patchy’ growth and to introduce greenbelt to facilitate this approach. The Dar es Salaam Metropolitan Development Project (133) (approval pending) is a comprehensive urban development strategy for the city that promotes growth along the BRT corridor. While developed for the purpose of guiding development within the BRT Phase 1 corridor, the tool can be used to guide development planning along any mass rapid transit corridor. The main premise of the strategy is an incremental densification within the corridor over time, capitalising on public investment, especially in designated priority areas. 58 BASELINE REPORT: HVT CITY RETROFIT FOR ALL 10.3.1.5 Mwanza The Mwanza City Master Plan (134) features a spatial growth strategy anchored around major urban growth corridors stretching in all directions. The main aspects of growth management specified in the concept plan include channelling growth along two main transport corridors, promoting infill and densification in existing areas, protecting naturally sensitive areas and upgrading/redevelopment of informal settlements (p. 115). All these growth-management tactics are generally in line with TOD goals. The proposed strategy promotes decentralised growth, calling for a specific framework for each of Mwanza's districts (‘Planning Unit Areas’). The plan calls for densification outside of the city centre to help manage a predicted tripling of the regional population by 2035, because all city functions are currently consolidated in the central district, necessitating long and inefficient trips. 10.3.2 Urban development plans Urban development plans translate urban development policy into more specific actions in different geographic areas of a city. Below, we describe how urban development plans are discussed in the target countries and cities. 10.3.2.1 Ethiopia The Urban Planning Proclamation (124) states the need to create to implement ‘sound and visionary’ (p. 1) urban plans in Ethiopia. It outlines different levels of plans: national, regional and urban. Urban plans include ‘citywide structure plans’ (p. 5) and ‘local development plans’ (p. 5) (LDP). An LDP is a plan ‘depicting mediumterm, phased and integrated urban upgrading, renewal and expansion activities with the view to facilitating the implementation of the structure plan by focusing on strategic areas’ (p. 6). According to the LDP manual (121), these plans guide development at the neighbourhood/project scale. Figure 35 (below) illustrates the location of LDPs in the hierarchy of plans in Ethiopia. On the macro level are plans for the four regional states of Oromia, Amhara, SNNPR and Tigray. Next are the plans at the city-level (levels one and two), including the Long-Term Integrated Development Plan and the Urban Structure Plan, followed by sub city-level plans, including LDPs, on levels three and four. All of these plans feed into projects, which can include buildings and infrastructure projects in a specific urban area delineated in an LDP. 59 BASELINE REPORT: HVT CITY RETROFIT FOR ALL Figure 35: Hierarchy of plans in Ethiopian Local Development Plans. From The Local Development Plan Manual (121), p. 7. 10.3.2.2 Tanzania The National Human Settlements Development Policy (128) highlights the statutory power of master plans and provides for legal responsibility to create, execute and approve general plans and detailed plans prior to development. Further responsibilities for facilitation, approvals and implementation are delineated in the Urban Planning Act (129). The Act calls for the creation of general planning schemes and detailed planning schemes for implementation under the jurisdiction of planning authorities (municipal councils). The Guidelines for Preparation of General Planning Schemes and Detailed Schemes for New Areas, Urban Renewal and Regularization (130) includes more detailed provisions for creating and executing land development schemes (plans). These guidelines are meant to be used by the town planners, developers and local planning authorities in the planning, development and approval process of development plans. The guidelines describe roles and responsibilities of stakeholders in carrying out the development schemes. The guidelines also cover the preparatory elements of schemes, including growth projections, mapping of spatial and demographic attributes, preparation of timelines and implementation steps, including financing, land acquisition, public involvement, monitoring and evaluation. 10.3.2.3 Dar es Salaam The Dar es Salaam City Master Plan 2016‒2036 (131) prominently describes a densification approach of driving development into new growth nodes called the ‘satellite cities’ or ‘sub-centres’ found at the intersection of major trunk roads and arterials. The plan refers to the centres as ‘transit oriented’ but does not specifically call the strategy TOD. (See ‘Integration of Transportation and Land Use’.) Guidelines prepared for the Corridor Development Project, including Volume 1 (parts A and B) and the Appendices (A, B, C) (133), include a proposed comprehensive strategy for TOD along the Phase I BRT network. 60 BASELINE REPORT: HVT CITY RETROFIT FOR ALL 10.3.2.4 Mwanza The Mwanza City Master Plan (134) is a comprehensive document comprising an overall development strategy anchored around compact city development principles. The plan includes technical guidance documents, urban design guidelines, zoning plans and an implementation plan. It is a self-contained comprehensive resource that defines high-level goals for Mwanza’s development supported by a concept plan. The plan outlines implementation strategies that will bring forth the established goals. 10.3.3 Public participation As urban growth and planning affect people’s lives directly, public participation is often a key part of the planning process. The following sub-section describes information on public participation found in the policy documents in the target cities and countries. 10.3.3.1 Ethiopia The Local Development Plan Manual (121) states that the ‘participatory planning approach’ (p. 19) is an important principle of the LDP process. Public participation ‘enhances sense of ownership among key stakeholders and provides opportunities to capture the interest of the community at large. However, participation of stakeholders should go beyond formalities; rather it should provide stakeholders with opportunities to influence decisions in favour of their future’ (p. 21). Figure 36 (below) presents an example of stakeholders involved in an LDP. It includes the types of stakeholders, areas of participation, roles played, levels and modes of representation, and potential interests of the stakeholders. Key stakeholders include residents, business and neighbouring communities, and utility companies. These stakeholders are involved in different phases of planning, including Phase I (need assessment and visioning) and Phase VII (Implementation). Figure 36: Example of stakeholder identification and analysis in LPD planning process. From The Local Development Plan Manual (121), Annexes, p. II. The Urban Planning Proclamation (124) says that urban plans should ‘create a favourable condition for public and private stakeholders to fully participate in the process’ of urban plan ‘initiation, preparation and implementation’ (p. 1) and ensure ‘the satisfaction of the needs of society through public participation, transparency and accountability’ (point 5-5, p. 4). 61 BASELINE REPORT: HVT CITY RETROFIT FOR ALL The Ethiopia Non-Motorised Transport Strategy 2020‒2029 (135) mentions public participation as a part of the NMT Strategy and calls for an open data policy to facilitate sharing of information about projects related to walking and cycling. 10.3.3.2 Addis Ababa A planning document for a project that sought to create TOD at LRT stations in Addis Ababa, the TOD Framework for Addis Ababa (136), mentions public participation as an important aspect of TOD planning. However, this document does not include specific steps for participation. Another document for this TOD master plan (137) mentions participation several times, including in the context of ‘resettlement on suitable land’ (p. 36): ‘Community participation is essential in order to avoid negative impacts such as: destroying social networks, breaking up communities, reducing people’s earning capacities, increasing transport costs, interrupting children’s schooling and generally increasing poverty’. The TOD Framework document presents in-depth plans for four TOD projects along the LRT line and mentions participation for planning processes at some of these sites. Although participation was an important step in creating TOD, this was not included in the project for TOD along the LRT line: ‘Public participation and community consultation was out of the scope of this project as defined by the inception report and project program. It is strongly recommended that individual projects and intervention areas are developed subject to public participation and community involvement’ (137). The Addis Ababa City Structure Plan Summary Report (125) includes participation as a fundamental aspect of planning. Lack of participation has hampered urban development in Addis Ababa to date, and the plan emphasises the need to ‘create systems and forums for public participation in the decision-making process of ‘key’ issues and for stakeholder involvement in the planning and monitoring of development projects’ (pp. 26‒27). However, beyond broad calls for participation, the plan does not provide specific details on how this will be carried out. The TOR for the TOD consultancy in Addis Ababa (126) emphasises the need for inclusive planning through public participation in the creation of TOD plans for the city: ‘Community Participation and Collective Identity: to ensure inclusiveness, harmonious [development] and develop a sense of ownership by engaging users and stakeholders’ perspectives and participation. The plan should include the identity of neighbourhoods that respect the local resident’s cultural, social and economic activities that may generate a sense of belonging and ownership of the city‘ (p. 8). 10.3.3.3 Tanzania Several national-level policies mention the importance of public participation related to land development procedures and require adequate measures to enable it. The National Human Settlements Development Policy (128) recognises weaknesses in the current land development process where the local community is not aware of its role and use of land designated for public use. The Urban Planning Act (129) declares that a participatory process is required for land development schemes. In this process, the local authority, under the supervision of the ministry, passes a regulation for a given scheme and is then tasked with convening public hearings and making the announcements on the resolution and subsequent drafts of the scheme public. The guidelines for preparation of General Planning Schemes and Detailed Schemes for New Areas, Urban Renewal and Regularization (130) similarly stipulate that the ‘preparatory authority’ (local planning authority or a municipal council) shall convene a meeting of all stakeholders in the area affected by the scheme to allow participation in the preparation of the scheme and to allow landholders to submit their proposals or objections to the schemes. The same policy also describes public participation in terms of contributions to the public good, where local residents are encouraged to contribute labour, materials and time in the process of implementing a scheme. 10.3.3.4 Dar es Salaam The Dar es Salaam Master Plan 2016‒2036 calls for strengthening public participation as a key part of the master plan (131) (p. 223). The Dar es Salaam Metropolitan Development Project—Appendix C Implementation Report (138) describes the need for inclusive processes that include local landowners for land assembly, land readjustment and transfer of development rights in the rapid transit corridor. 62 BASELINE REPORT: HVT CITY RETROFIT FOR ALL 10.3.3.5 Mwanza The Mwanza City Master Plan Vol. 3: Urban Design Guidelines (139) states that the key component of master plan implementation is adequate participation from various stakeholders, such as decision-makers, privatesector focus groups, community organisations and various public-interest groups. Stakeholder participation will be solicited through a series of workshops organised throughout the stages of the project as well as communication mediums to collect public feedback. At the culmination of the implementation of any project phase, there should be a public exhibition for a wider group of stakeholders. 10.4 Transport planning The planning of the transport system is intimately linked to urban growth, driving both how and where growth occurs. The transport system is in turn affected by that growth. 10.4.1 Integration of transport and land use The following section describes how public policy aims to address the linkage between land use and transport plans in the target countries and cities. 10.4.1.1 Ethiopia We did not find any national policies for Ethiopia discussing the integration of transport and land use. 10.4.1.2 Addis Ababa The Transport Policy for Addis Ababa (140) points out that the lack of integration between land-use and transport policies has created problems for the city’s transport system: ‘The expansion of residential land use development without considering the necessary transport infrastructure and services resulted in inefficiencies in the transport system’ (p. 18). That plan points out the need to harmonise land use and transport plans, as these are ‘inseparable components in any city development’ (p. 19). The Addis Ababa City Structure Plan Summary Report (125) also confirms that one of the main drivers of the city’s transport problems is the lack of integration between land use and transport planning: ‘The multidimensional effect of lack of integration between urban land use and urban transport has given rise to unnecessary trips, congestion, costly fuel consumption, pollution and low productivity’ (p. 67). This plan proposes to improve coordination of land use and transport services around the concept of TOD in urban centres. The Terms of Reference (TOR) for Transit-Oriented Development (TOD) Project (126) refers to that 2017 plan’s goal to coordinate transport and land use through the use of TOD. 10.4.1.3 Tanzania The Urban Planning Act (129) is the primary document that makes an explicit intention to facilitate land use and transport integration in Tanzanian cities. It sets goals for sustainable development of land where development is serviced with roads and basic infrastructure. Similarly, the National Human Settlements Development Policy (128) aims at creating conducive environments for human settlements serviced by infrastructure and facilitated by employment opportunities and calls for frameworks to achieve such conditions. 10.4.1.4 Dar es Salaam Land use and transport integration are the overarching focus of the Dar es Salaam Master Plan 2016‒2036 (131). The growth strategy utilises an idea of guiding growth not only to the main transport corridors but also to new nodes found at the junction of main arterials. This decentralised growth strategy aims at reducing pressures on the city centre and creating more infill in expansion areas that currently comprise a patchy mix of planned development, low-density informal development and open space. The map below (Figure 37) illustrates hierarchy of density centres comprised of new metropolitan centralities (new central areas of greater economic importance comparable to CBDs), new satellite centres and local centralities (neighbourhood centres that provide basic services within walking distance of the residents). 63 BASELINE REPORT: HVT CITY RETROFIT FOR ALL Figure 37: Dar es Salaam decentralised strategy based on nodal development. From the Dar es Salaam Master Plan 2016‒2036 (131), p. 138. The Dar es Salaam Metropolitan Development Project (133, 138, 141, 142) guidance documents are anchored on the principle that a way to capitalise on public investment is through increase in land-use efficiency along the BRT corridor. 10.4.1.5 Mwanza The Mwanza City Master Plan (134) features a concept plan that allocates a 1 km-wide belt along the proposed BRT network for higher-density urban development, as shown on the following map of the concept (Figure 38). The higher-density zones correspond with hierarchy of nodes, including CBD, district centres (local activity nodes) and regional centres that will serve as specialised hubs to satisfy commercial needs. 64 BASELINE REPORT: HVT CITY RETROFIT FOR ALL Figure 38: Development concept in the Mwanza master plan, with high-density residential development zones along the proposed BRT network. From Mwanza City Master Plan (134), p. 176. 10.4.2 Public transport (PT) Public transport is a core element of TOD, connecting the different neighbourhoods of the city. Below, we describe how PT is discussed in the policies of the target countries and cities. 10.4.2.1 Ethiopia The Local Development Plan Manual (121) mentions PT as an aspect that should be included in LDPs, and it includes questions regarding the existence of PT in surveys for places developing LDPs. However, beyond these instances, the manual does not strongly emphasise PT. Although not specific to PT, the Urban Planning Proclamation (124) says that LDPs shall include the ‘organization of transportation system’ (p. 6). The designs for several street sections in the Street Design Standards for Urban Ethiopia (122) include BRT and dedicated bus lanes. 10.4.2.2 Addis Ababa The Transport Policy for Addis Ababa from 2011 emphasises LRT, BRT and trolleybus networks. A goal of the plan is to make PT more affordable to the public. The document mentions informal PT services only briefly, saying that minibus services should be replaced by expanding bus transport service. However, the document provides no further details on how this should be achieved. PT (LRT) is a central component in the three documents that outline the TOD strategy for the LRT network (136, 137, 143). Beyond the centrality of the LRT network in these plans, some of the LRT stations included in the plan are served by bus and minibus taxis, and these modes are contemplated in the redevelopment plans. The map for Addis Ababa’s future transport network (144) includes robust plans for PT. It shows LRT, BRT, MRT, national railway, existing railway, bus depots, stations and terminals. The same document also has street sections with exclusive lanes for BRT. The current master plan for Addis Ababa (125) includes LRT (34 km existing, to expand to 64 km), BRT (64 km total to be built) and an increase of public buses (to 1,600 in the first five years, then 2,400 after 10 years). The city’s informal PT services are mentioned only a few times in the document, with no mention of a modernisation process for informal PT services. 65 BASELINE REPORT: HVT CITY RETROFIT FOR ALL The plans for TOD requested in the TOR for TOD in Addis Ababa (145) will be based on the existing and planned LRT and BRT networks in the city. Feeder buses, including informal transport, are to be included in the plans. The document ascribes PT responsibilities to the Addis Ababa Transport Bureau and the Ethiopian Railway Corporation (145), including the responsibility to ‘make transport studies regarding mass transport, car parking, terminals and traffic managements’ and ‘develop, operate and manage all the LRT service and national rail services’ (p. 2), respectively. 10.4.2.3 Tanzania Tanzanian national development policies do not specifically call for provision of public transport. However, the National Human Settlements Development Policy (128) and the Urban Planning Act (129) do discuss matters of sustainable land development and the need to address limitations of urban services. 10.4.2.4 Dar es Salaam The Dar es Salaam City Master Plan 2016–2036 (131) relies heavily on establishment of new ring roads within the city with the idea to promote public transport, cycling, pedestrian movement and parking along them. The Dar es Salaam Metropolitan Development Project guidance documents (133, 138, 141, 142) focus on interventions and strategies supportive of transport services and compact city development. The Corridor Development Project proposes to achieve ‘high density of public transport service, where over 80% of people have access to transit. This entails an integrated, subsidised system with high-capacity primary corridors, numerous urban secondary routes and a capillary feeder network with maximum outreach and ridership’ (p. 38). The documents include comprehensive visual analysis of existing and proposed BRT systems showcasing the BRT network overlaid with spatial information such as population density, unplanned development and greenways. Informal transport systems are addressed through the strategy to limit car access to reduce air pollution, congestion (both from personal vehicles and informal transport) and safety hazards. 10.4.2.5 Mwanza The Mwanza City Master Plan (146) recognises the need for affordable public transport, especially in the Inner City Planning zone. Volume 3 of the master plan includes strategies for interventions around proposed BRT terminals and along BRT corridors. Increasing population density along the BRT corridor is a prominent feature of the strategy for the city centre, and the plan includes deep analysis of land uses, land parcelling and planning approaches. The map below (Figure 39) shows the broad categories of land uses: medium-density residential, high-density residential and commercial uses, as well as main activity centres (parks and recreational nodes) and their overlap with the BRT system. Several other maps with more detail on land uses also suggest that activity-generating uses are strategically planned to support the transport system in existing developed areas and areas requiring infill. The master plan discusses informal transit, calling for consolidating the private operators as cooperative companies. 66 BASELINE REPORT: HVT CITY RETROFIT FOR ALL Figure 39: BRT system plan and broad categories of uses and interventions. From Mwanza City Master Plan (146), p. 166. 10.4.3 Walking and cycling The provision of a safe, complete and accessible pedestrian realm and bicycle network is a key component of TOD according to the TOD Standard (110). The following section describes how walking and cycling are addressed in policy documents in the target countries and cities. 10.4.3.1 Ethiopia The Local Development Plan Manual (121) says that ‘pedestrian walkways’ (p. 43) should be mapped and includes the options of walking and cycling as means of transport in the surveys. Further, ‘bicycle maintenance’ is a type of small business use mentioned in a sample LDP inventory (Annex XXV). The Street Design Standards for Urban Ethiopia (122) cover facilities for walking and cycling in great detail. Designs include standards and specifications for spacing and width for different types of pedestrian and cycle infrastructure, along with images. The manual also includes elements such as traffic calming. As the title of the document suggests, the Ethiopia Non-Motorised Transport Strategy 2020‒2029 (135) covers walking and cycling in great detail. This document includes definitions of walking and cycling facilities; an overview of existing street design standards; roles of organisations involved in street planning, design and implementation; costs of walking and cycling facilities; and funding sources. 10.4.3.2 Addis Ababa The Transport Policy for Addis Ababa emphasises the need to create infrastructure for walking and cycling. While cycling is included, walking is highlighted. The plan says the government should promote walking and cycling to ‘make it favoured mode’ (p. 26). The three documents that outline the TOD strategy for the LRT (136, 137, 143) emphasise walking facilities for the plans for the 11 proposed TOD zones, and cycling is mentioned in some of these. The plans for the four TOD sites that are developed in greater detail note the need to improve walking and cycling facilities. The Implementation Strategy document (143) emphasises the pedestrian-oriented aspect of TOD: ‘Essentially all 67 BASELINE REPORT: HVT CITY RETROFIT FOR ALL the facilities and services a resident would use on a daily basis within walking distance of the TOD station node’ (p. 5). Further, the document defines TOD as ‘pedestrian-oriented high-density, mixed-use development, cantered around a mass transportation node’ (p. 8). Street section typologies depicted on the map for Addis Ababa’s future transport network (135, 144) include sidewalks and bike lanes. The Addis Ababa City Structure Plan Summary Report (125) emphasises walking as an important transport mode. The plan reports that walking accounted for 55% of modal share in 2011, and that travel demand projections estimated the share of walk trips to be around 45% in 2020. The plan places particular emphasis on creating a pedestrian-oriented, ‘green’ environment in the city centre: ‘Moreover, creating a walkable core that ensures pedestrian comfort is a central theme in the MCC local development plan which will be addressed by increasing permeability with shorter blocks, providing pedestrian-only streets and leaving more than 50% of the street for non-motorised transport with green infrastructure’ (p. 226). The Terms of Reference (TOR) for Transit-Oriented Development (TOD) Project (126) emphasises the catchment area for pedestrians for TOD: ‘TOD area within radius 700 metres from the transit station is the comfortable walking radius for pedestrians (walkable area) of about 10 minutes walking’ (p. 10). The TOR asks for detailed plans for four TODs, all of which have significant flows of pedestrian traffic. Although this document does not emphasise bicycles, cycle networks are part of the TOD evaluation. The document that describes the institutions responsible for the master plan of Addis Ababa (145) does not specify which institution(s) are responsible for walking and cycling. 10.4.3.3 Tanzania The national-level policies do not specifically discuss walking and cycling conditions or network planning. However, the high-level goals regarding access to basic public infrastructure, including public rights of way, are articulated in the Tanzania Urban Planning (Planning Space Standards) Regulations (147). This regulation also highlights provision of road networks in informal settlements. Detailed guidance on walking and cycling strategy is addressed in development schemes for the two cities, as discussed below. 10.4.3.4 Dar es Salaam Walking and cycling are specified as one of the strategies in Dar es Salaam City Master Plan 2016–2036 (131) related to investments in a ring road network. Pedestrian improvements are also the key features of the satellite city approach, where each ‘city centre’ will be equipped with excellent walking infrastructure. The strategies developed for the BRT corridor articulated in the Metropolitan Development Project guidance documents (133, 138, 141, 142) highlight objectives to improve networks of walking and cycling paths to facilitate access to major public facilities and public transport. Pedestrian interventions are specified in the placemaking initiative for station catchment areas to ease pedestrian circulation, promote local businesses and create a sense of place. 10.4.3.5 Mwanza The Urban Design Guidelines volume of the Mwanza City Master Plan (146) articulates walking and cycling improvements to enhance BRT corridors, improve overall city character and support three catalyst projects. Promoting cycling and energy-efficient public transport are articulated as the main objectives of the transport proposal. Some of the specific proposed design interventions include the creation of boulevards along the BRT transport corridor, tree-lined pedestrian sidewalks, pedestrian linkages, and more porous and active street frontage. Detailed walking and cycling plans for the special ‘Urban Design Area’ of Mwanza’s downtown and the waterfront are articulated in Volume 3: Urban Design Guidelines (139) of the master plan. The plan also delineates a walking and cycling strategy calling for open spaces and an increase in pedestrian network coverage (Figure 40, below). The Urban Design Control Plan (top map) combines urban design interventions for Mwanza’s central area featuring green spaces along the waterfront, pedestrian plazas, frontage treatments including arcaded edges and built to street edges, visually active and permeable frontages, pedestrian priority streets and key landmarks drawing attention to the area through better use of public space and placemaking. Note that the Mirongo River design features (curved line in the centre with pedestrian street and permeable frontage) aim to promote recreational and leisure activity in the area. The 68 BASELINE REPORT: HVT CITY RETROFIT FOR ALL pedestrian movement analysis (bottom two maps) shows the current pedestrian circulation with relationship to activity-generating uses, as well as proposed pedestrian links that are currently missing. Figure 40: Mwanza’s Urban Design Area showing different types of walking and cycling interventions. From Mwanza City Master Plan Vol. 3: Urban Design Guidelines (139), p. 55 (top), p. 37 (bottom). 10.5 Regulatory tools Regulatory tools, such as land-use controls and building controls, are often used to implement urban development plans. Many of the tools described below are often aggregated as ‘zoning’ controls, but we disaggregate them to clarify what they regulate. Below, we describe the different tools that are discussed in policy documents in the target countries and cities. 10.5.1 Land-use controls Land use controls regulate what type of land uses (e.g., housing, manufacturing and retail) are permitted in each part of a city. 10.5.1.1 Ethiopia In the Local Development Plan Manual (121), examining and altering land use is a central aspect of developing LDPs and is discussed throughout the document. For example, LPDs are to survey existing land use for the target areas and then create proposals for new land uses. This is supported by the Urban Planning Proclamation (124), which specifies that urban plans will include principle land class uses, including ‘housing development’ and ‘industry zone’ (p. 5). The Street Design Standards for Urban Ethiopia (122) mention mixed land use as an important characteristic of TOD. 69 BASELINE REPORT: HVT CITY RETROFIT FOR ALL The Ethiopia Non-Motorised Transport Strategy 2020–2029 (135) does not cover land use in detail but does mention using land use strategically to create TOD. 10.5.1.2 Addis Ababa The three documents that outline the TOD strategy for the LRT network (136, 137, 143) go into considerable detail on existing and desired land use for each of the 11 stations that are to be planned as TOD. The TOD Addis Ababa Stage 4: TOD Concept and 3D (Master Plan) (137) shows that much of the city is mixed-use, with a large city centre and several secondary centres. There is a strong spine of ‘manufacturing and storage’ on a north‒south spine. Land use is an important element examined throughout this document: For example, it contains a table with land-use constraints for the four more detailed plans for TODs. Besides ‘Land-Use Constraints’ (p. 129), this table (Table 3 below) also included ‘heights restrictions’, ‘citywide context’, ‘available land for development’, ‘heritage considerations’ and ‘existing density’. ‘Land use constraints’ here means the ability to achieve a desirable mix of residential and commercial uses to achieve a vibrant TOD site within the existing land use conditions on the site. Of the four potential stations the document examined closely for TOD potential, Menelik II Square and Autobus Terra scored highest on ‘LandUse Constraints’, while Leghar had the highest score overall. Table 3: Scoring of potential TODs at LRT stations. From TOD Addis Ababa Stage 4: TOD Concept and 3D (Master Plan) (137), p. 29. This document also points out that an optimal land use is needed to make TOD function well, as adequate densities are needed to support transit use: ‘This type of mix is a key starting point to creating greater landuse diversity, supported by residential and commercial densities, and thus furthering transit-oriented development. The combination of density and land-use diversity also bolsters the economic viability of transit by providing the multidirectional volume of people required in response to the capacity of the transport system’ (p. 44). Each of the four detailed plans for TODs examines land use and suggests improvements. The map of existing land use in Addis Ababa (148) includes a fairly broad range of land uses, including ‘cultural and social welfare,’ ‘mixed residential’ and ‘urban agriculture’. The map of future land use in the city (149) shows allowed land use/zoning for 2017 to 2032. This map shows land uses that will facilitate future densification of existing centres and along transport corridors. The checklist for a building permit in Addis Ababa (150) includes land use for the project in question. The checklist calls for reviewing consistency of a proposed land use with the city’s master plan and the LDP for the respective area. The Addis Ababa City Structure Plan Summary Report (125) includes an entire section on land use. This section recognises that while the city’s population is growing, additional space for residential land use is almost exhausted. As such, the plan calls for densifying existing urban centres with mixed-use zoning and densification along transport corridors: ‘Mass transit attracts/enables high-density development along corridors. In view of the scarcity of land in the capital, inner-city redevelopment could strategically focus on densification along these corridors’ (p. 39). It also points out: ‘With the advent of a dedicated mass transport line, the concept of intensive use of land becomes clearer. High-density-development areas are selected by considering mass transport routes and city centres’ (p. 40). The plan emphasises mixed-use zoning or ‘mixity’: ‘The inherent idea embedded within the concept of ‘mixed use’ or mixity is the creation of a vibrant environment (economically and socially)’ (p. 46). 70 BASELINE REPORT: HVT CITY RETROFIT FOR ALL The Terms of Reference (TOR) for Transit-Oriented Development (TOD) Project (126) emphasises mixed land use. Plans created in response to these TORs will identify existing land uses for four focus areas and propose land uses to support TOD and economic activity in the target area and surrounding areas. In the document describing the institutions responsible for the master plan of Addis Ababa (126), organisations responsible for land use are the AACPDC and the 10 sub-cities. 10.5.1.3 Tanzania In Tanzania, national-level policies set land-use standards and minimum standards for land development. The Urban Planning (Use Groups and Use Classes) Regulations (151) categorise land-use types into groups and use classes. The Urban Planning (zoning of land use) Regulations (2018) document regulates permissible uses of land for the different land-use categories. It also sets minimum planning standards for plot sizes and setbacks for different land-use categories, but without any distinction for transit-accessible or TOD areas. The national-level regulation is said to be too broad and generic, forcing municipalities to stall implementation of plans and sometimes to act against restrictive regulations, a form of malpractice described in the Mwanza City Master Plan (146). 10.5.1.4 Dar es Salaam While regulation of land use is typically specified by the national government, the Dar es Salaam Master Plan 2016‒2036 (131) proposes land-use zones for the city centre, subject to approval of the ministry. The landuse zones shown on the ‘Land-use policy proposed in the city centre’ map (Figure 41) feature residential, mixed-use, commercial, institutional and transportation utility zones, as well as areas under detailed land-use plans. Each land-use zone and its respective numeric code (1, 2, 3) indicates transformation capacity (densification opportunity) for existing structures in each zone (typically 20% increase in density), maximum plot coverage, building alignments and parking requirements. The detailed planning areas are subject to town planning and space standards for detailed areas that delineate the permitted land uses, maximum plot coverage, building height, plot ratio, setbacks and parking requirements. Note that the detailed planning areas 6, 7, 8 and 9 south of the neighbourhood of Kariakoo currently fall within an area occupied by industrial and logistic uses also serviced by a BRT line. Figure 41: Zoning scheme for Dar es Salaam City Master Plan. Source: Dar es Salaam Master Plan 2016‒2036 (131). The development strategies proposed in the Dar es Salaam Metropolitan Development Project (133, 138, 141, 142) include a call for setting minimum density targets (not maximums), as compared to the national 71 BASELINE REPORT: HVT CITY RETROFIT FOR ALL regulation that limits development densities and building heights. Since local plans must conform to national regulations, municipal officials do not have the tools to legally implement the higher densities they desire. 10.5.1.5 Mwanza The Mwanza City Master Plan (134) outlines challenges to implementing regulations imposed by the National Government, which result in a confusion of institutional responsibilities, malpractice, lack of flexibility, failure to adapt to local context and diminished power of local governments to adopt their own land-use regulation. The broad land-use plan enclosed in the Volume 1 of Mwanza Master Plan (134) outlines proposed land uses to facilitate TOD along the main trunk roads and the proposed BRT corridor. The key land-use proposals include: expansion and densification of the city centre, introduction of two new growth centres along the BRT network, promotion of affordable housing throughout the city and redevelopment of informal settlements into medium-rise communities anchored by public transport service (p. 115). The proposed land-use plan (Figure 42) outlines the basic types, including low-, medium- and high-density residential uses, and their relationship to the proposed BRT lines and major trunk roads. Figure 42: Mwanza City Proposed Broad Land Use Plan 2035. From Mwanza City Master Plan (134), p. 115. This master plan also includes regulatory space provisions that are more elaborate than the national government standards. The space provisions of the master plan call for doubling density across the city to optimise land utilisation. According to the master plan, there is great potential to increase density requirements, as about 70% of the city centre has a floor area ratio (FAR) average of 2 or less. The proposed density of 3,750 people/km2 on average, 23,000 people/km2 in the city centre and 18,000 people/km2 in areas of the inner city are the suitable baseline densities. Volume 3 of the Master Plan promotes mixed use, as articulated in the strategy description of three catalyst projects. The Zoning Plan portion of Mwanza’s master plan (146) includes provisions for zone types. A transit overlay specifies a zone along a BRT corridor of 500 metres for higher-density development to capitalise on the transport service. 72 BASELINE REPORT: HVT CITY RETROFIT FOR ALL 10.5.2 Building controls Building controls regulate characteristics of buildings, including height, setbacks and plot area requirements. Many building controls may fall under the umbrella of zoning, but they also may fall under a separate set of regulations. 10.5.2.1 Ethiopia The Local Development Plan Manual (121) outlines a range of building-related information to be collected while creating an LDP, including the BAR (built up ratio), FAR, building heights and setbacks. This is corroborated by the Urban Planning Proclamation (124), which states that LDPs shall include ‘building height and density’ (p. 6). The Ethiopia Non-Motorised Transport Strategy 2020–2029 (135) includes a brief review of building control regulations in the context of their impact on pedestrian spaces. This document recommends promoting building controls that activate street life, such as frontage with commercial uses and arcades. 10.5.2.2 Addis Ababa The three documents that outline the TOD strategy for the LRT network (136, 137, 143) address building controls to some extent. The TOD Framework Addis Ababa (136) provides an overview of building heights in Addis Ababa and then goes into detail on building heights for the 11 TOD interventions. Some of these plans propose to keep building heights consistent with existing ones, while others recommend increasing heights. Some areas also emphasise strengthening ‘building lines’ to create consistent setbacks (p. 11) and a more visually unified and functional streetscape. The TOD Addis Ababa Stage 4: TOD Concept and 3D (Master Plan) (137) follows building height restrictions according to the Addis Ababa City Government Urban Planning & Information Institute. It includes definitions for BAR and FAR. Table 5 of this document (p. 29) includes building height restrictions in order to calculate optimum density for the four TODs that are examined in greater detail. Plans for the four TODs include an analysis of existing and recommended building heights. Although the TOD Addis Ababa Stage 6: Implementation Strategy (143) does not emphasise building controls, is does suggest that these be used strategically to promote TOD: ‘Typically, TODs function best in a higherdensity, pedestrian-oriented setting. Therefore, a special TOD District may allow increased building heights and FARs, reduced setback requirements and minimising parking ratios. This should be accomplished for all present and future TOD districts to ensure maximum development capacity and profitability’ (p. 31). The checklist for a building permit in Addis Ababa (150) includes building controls to be checked for consistency with master plan and LDP. There are also sections for building heights and setbacks. The map for building heights in Addis Ababa (149) shows higher buildings allowed in the city centre, in subcentres throughout the city and along transport corridors. That maps also specifies setbacks for different kinds of roads, such as 3 metres for arterials and 1 metre for local streets. The Addis Ababa City Structure Plan Summary Report (125) proposes using building heights to increase density and create a more ‘harmonised skyline’ (p. 156). Overall, building heights can be used to create a more efficient city: ‘The aim of the building height regulation is to facilitate the implementation of the Structure Plan by enabling the efficient use of land’ (p. 156). The plan includes a map with FARs and building heights by zones. The zones are numbered 1 to 4 and include historical and green zones. The Terms of Reference (TOR) for Transit-Oriented Development (TOD) Project (126) specifies that building heights, FARs and setbacks be included in design proposals for the four stations that will be the subject of detailed planning for TOD. The document that describes the institutions responsible for the master plan of Addis Ababa (145) says that the Addis Ababa Infrastructure Integration, Building Permit and Regulation Authority will ‘provide plan agreement service, inspect building design and provide permission for building uses’ (p. 2). 73 BASELINE REPORT: HVT CITY RETROFIT FOR ALL 10.5.2.3 Tanzania National-level policies address building standards. The Tanzania Urban Planning (Planning Space Standards) Regulations (147) set minimum standards for building sizes based on population density, minimum and maximum plot ratio, and number of floors per land-use type. The National Human Settlements Development Policy (128) points to issues with existing building regulations, calling for flexible rather than prescriptive standards. The Urban Planning (Building) Regulations (152) set out approval mechanisms and controls to guide building development and certification in urban areas. The regulations also set out procedures to be followed when carrying out building alterations, prohibitions, standards and materials to be used for various elements of buildings. 10.5.2.4 Dar es Salaam Local planning authorities implement national building regulations, issue building permits and exercise development control under their jurisdiction. The Dar es Salaam Master Plan 2016‒2036 (132) proposes that a special unit be created within Dar es Salaam’s planning authority to oversee infrastructure and service delivery in the informal settlements on a day-to-day basis. 10.5.2.5 Mwanza The Mwanza City Master Plan (146) includes building controls for the size and shape of buildings, based on the type of zone they occupy. The controls require a ‘parking lot’ and ‘paved area’ between the building and the road. Only a few zones require specific provision for footpaths in the regulations, but nearly all zones require surface parking lots, typically fronting the road. The required parking areas limit the ability for people to walk in front of a building, appearing to force people to walk in the street. Frontage parking and/or surface parking lots are required in all residential and commercial land uses. These are provided by requiring buildings to occupy only a portion of the lot. Setbacks are required on all four sides for nearly all zones, even in the highest-density residential zones (see Figure 43). Mixed-use areas, primarily located in the city centre, create more pedestrian-friendly buildings, with parking required to be located behind buildings and covered footpaths required along the road, in place of parking (see Figure 44). Figure 43: Setback and parking requirements for high-rise residential zones in Mwanza. From Mwanza City Master Plan (134), p. 51. 74 BASELINE REPORT: HVT CITY RETROFIT FOR ALL Figure 44: Setback and parking requirements for mixed-use commercial zones in Mwanza. From Mwanza City Master Plan (134), p. 58. 10.5.3 Parking Parking requirement are often part of land-use regulations, whether they require a minimum amount of parking or set a maximum amount of parking for different land uses. 10.5.3.1 Ethiopia We did not find any national policies for Ethiopia discussing parking requirements. 10.5.3.2 Addis Ababa The Terms of Reference (TOR) for Transit-Oriented Development (TOD) Project (126) specifies that the implementation strategy should reduce parking requirements: The plans for future TODs should ‘eliminate minimum off-street parking requirements and identify appropriate maximum parking levels for the study areas’ (p. 24). 10.5.3.3 Tanzania Parking requirements for different types of uses are defined in the Tanzania Urban Planning (Planning Space Standards) Regulations (147). The regulations call for minimum parking requirements, and there are no special considerations for transit-accessible zones or high-density areas. 10.5.3.4 Dar es Salaam Parking requirements are part of the Land Use Policy proposed in the Dar es Salaam Master Plan 2016‒2036 (131). The policy, as mentioned in section 10.5.1.4, outlines provisions for the main land-use categories for the city centre. Each category features development provisions, including parking requirements. The parking requirements across all zones in the area call for: 1 parking lot per 100 m2 of office use, 1 parking lot per 200 m2 of commercial use and 1 parking lot per one residential unit. While parking is lightly addressed in the Dar es Salaam Metropolitan Development Project documents (133, 138, 141, 142), it is not fully examined from a TOD perspective. The guidance documents mention that the strategy should aim at limiting surface parking but do not include analysis of current provisions, supply and demand or the potential for re-allocation of parking spaces. 10.5.3.5 Mwanza The Mwanza City Master Plan (146) includes a proposed zoning plan with parking requirements. These requirements, however, are less stringent than national land-use policies. The overall parking requirement is one car parking space per 200 m2 of development. However, mitigating issues in on-street parking is mentioned as part of the transport proposal, where on street parking issues are to be rectified by banning onstreet parking in certain areas or imposing higher parking fees and requiring minimum parking ratios for new development, including commercial markets and residential areas. Additionally, the recommendations of the transport proposal also include creation of multi-storey car parks near key locations. 75 BASELINE REPORT: HVT CITY RETROFIT FOR ALL 10.5.4 Street layouts Dense street networks create short blocks that facilitate shorter walking trips, an important component for TOD. Below, we describe how street layouts are discussed in the policy documents for the target countries and cities. 10.5.4.1 Ethiopia The Local Development Plan Manual (121) states that LDPs will collect information on, and propose new, street patterns, road designs and parking. They will include typologies and specific street designs. The Street Design Standards for Urban Ethiopia (122) present various examples of different kinds of street networks. Street sections and elements such as street furniture and traffic calming are also defined in detail, with tables including size specifications and visual examples. The manual also provides guidance for the creation of walking and cycling facilities on streets. It says that block sizes should be at most 100 metres to improve walkability. The Ethiopia Non-Motorised Transport Strategy 2020–2029 (135) provides a brief review of existing street design standards. This document posits that the multitude of different existing street design manuals presents a major challenge for Ethiopian municipalities for delivering consistent street designs and that consolidated designs for walking and cycling facilities are needed. 10.5.4.2 Addis Ababa The TOD Framework Addis Ababa (136) mentions that the ‘organic street pattern’ of informal developments ‘must be celebrated and enhanced’ (p. 13). This document provides specific recommendations for street networks for all 11 proposed TOD interventions at LRT stations, such as improving the grid or creating a ‘high street’. The TOD Addis Ababa Stage 4: TOD Concept and 3D (Master Plan) (137) describes existing street layouts (networks and street sections) for the four proposed sites for TOD interventions, along with ways to improve upon them. Road widths are included in the checklist for a building permit in Addis Ababa (150). This checklist ensures consistency of road widths with the city’s master plan and LDPs. The map for future building heights in Addis Ababa (149) shows a range of street types and widths, e.g., arterial streets are >30 m wide, and collectors are 15 m to 20 m. The map for Addis Ababa’s future transport network (144) goes into further detail on street configurations and has images of sample street sections for different types and widths, with facilities for walking and cycling and BRT. The Addis Ababa City Structure Plan Summary Report (125) emphasises street section characteristics, with visuals of street section types. The document also outlines growth of the city’s road network (90 roads, 330 km total). The plan includes these guidelines for this growth to ensure adequate space for people walking and PT: ‘Give more attention to pedestrian-friendly designs; reserve appropriate lanes for mass transit lines; and plan local and collector roads to support vehicular and pedestrian mobility’ (p. 55). The same plan outlines an approach to street design that supports public life: a ‘complete street approach where ‘the public domain, the street should not only be viewed as a carriage way but space where people interact, enjoy, rest, etc.’ (p. 55). For city centre contexts, the Structure Plan calls for allocating 60% of the right-of-way to non-motorised transport. The Terms of Reference (TOR) for Transit-Oriented Development (TOD) Project (126) also requests street network design to improve connections for pedestrians, including to ‘create interconnected and hierarchical networks of streets and paths; short, direct and varied walking and cycling routes; small block size: to create permeable blocks’ (p. 23). The document that describes the institutions responsible for the master plan of Addis Ababa (145) indicates that the street network falls under the jurisdiction of the AACPDC (‘Review the street network from Addis Ababa City Road Authority specially on street right of way and detail designs issues and give permission to build streets’) (p. 1) and the Addis Ababa City Road Authority (‘Design preparation and building follow-up’) (p. 1). 76 BASELINE REPORT: HVT CITY RETROFIT FOR ALL 10.5.4.3 Tanzania The Urban Planning Act (129) and Urban Planning (Planning Space Standards) Regulations (147) feature specifications for right of ways, the latter including provisions for roads within unplanned settlements. The roads in informal areas distinguish space for pedestrian space and carriageways. There is no discussion on road network coverage, but the aforementioned space standards do emphasise goals for connected road systems and access requirements to private premises. 10.5.4.4 Dar es Salaam The Dar es Salaam City Master Plan (132) talks extensively about street networks, with relation to growth strategy, public transport coverage and goals for increasing access. The web of ring roads intersecting concentric road networks is meant to address ‘patchy’ growth and promote infill and future expansion of the city within the outlying ring road boundary. The denser network will also allow decentralisation of services to alleviate a busy city centre. This approach to steady planned expansion is meant to accommodate the demographic increase projected to reach 7.8 million inhabitants in the next 20 years (p. 138). The Dar es Salaam Metropolitan Development Project (133) specifies strategies for increasing connectivity and access to be achieved by increasing density of both arterials and collector roads and by widening of arterials for greater carrying capacity, including for public transport systems. 10.5.4.5 Mwanza The Mwanza City Master Plan Vol. 4—Zoning Report (146) points out that the current road networks pose obstacles to the implementation of mass rapid transit due to limits in carrying capacity and lack of parking enforcement. The master plan also requires that local access streets of a minimum 10 metres in width must be created in consultation with the community in the approval process for parcel development. 10.6 Land-management tools Various land-management tools can be used to facilitate development, which can be a tool for TOD, but can also lead to displacement. 10.6.1 Land expropriation Expropriation is the process of government acquiring land by force from private owners, typically with compensation. In the context of TOD, this is often done to facilitate the development of underutilised land in strategic locations. However, expropriation can cause displacement and go directly against the goals of equitable TOD. 10.6.1.1 Ethiopia The proclamation regarding expropriation in Ethiopia (123) details the right of the federal government to expropriate land in order to develop urban and rural areas. This proclamation also has language for compensation, determining that landholders shall receive just compensation for any land expropriated. The proclamation applies to displacement of rural and urban landholders and businesses. This is also echoed in the subsequent Urban Planning Proclamation (124). 10.6.1.2 Addis Ababa The TOD Addis Ababa Stage 4: TOD Concept and 3D (Master Plan) (137), which outlines TOD for LRT stations, makes reference to the above-mentioned proclamation regarding expropriation: ‘In accordance with Article 3(1) of proclamation No. 455/2005 the different levels of city administration have the power to expropriate urban/rural landholdings for public purpose upon payment in advance of compensation’ (p. 15). The Addis Ababa City Structure Plan Summary Report (125) only mentions expropriation with respect to a proposed development in the sub-centre of Kality: ‘Hence, expropriation and relocation are the main challenges faced in developing the centre’ (p. 227). 77 BASELINE REPORT: HVT CITY RETROFIT FOR ALL 10.6.1.3 Tanzania Issues in securing enough buildable land for development are mentioned in the National Human Settlements Development Policy (128). Related government functions are to ensure land is available for all income groups, lease land to private and public sector investors and promptly pay adequate and fair compensation. 10.6.1.4 Dar es Salaam To address shattered development, low density and informality, the Dar es Salaam City Master Plan 2016‒ 2036 (131) proposes more ‘drastic’ transformation steps to turn the disorderly areas into denser communities, create quality housing and establish adequate open spaces that are currently lacking. These steps include land acquisition, though aimed at fostering a ‘collaborative manner’ in some cases associated with land tenure (p. 143). Land expropriation is listed as one of the necessary mechanisms to manage land and create investment opportunities specified in the Corridor Development Project (133, 138, 141, 142). This process, among others, has a statutory grounding where the land can be utilised for more efficient purposes. 10.6.1.5 Mwanza The Mwanza City Master Plan (134) talks about land consolidation efforts in order to obtain about 650 hectares of land to develop the catalytic projects. The typical acquisition process would not be feasible, and a land consolidation strategy is proposed with several mechanisms to develop such projects without actually acquiring the land. 10.6.2 Land readjustment Unlike expropriation, land readjustment procedures shift the borders of land plots to create a more regular street grid and provide better plot access. Land readjustment can improve access in informal settlements where tenure and plot boundaries are unclear. 10.6.2.1 Ethiopia Land readjustment is generally not discussed in the national policy documents examined for Ethiopia. 10.6.2.2 Addis Ababa The Addis Ababa City Structure Plan Summary Report (103) mentions land readjustment (‘Plot rearrangement and compulsory public space sharing,’ p. 88) for informal settlements as a tool to organise urban growth and deliver services. The plan also says that land readjustment can help achieve desirable density in the city’s informal settlements: ‘Land readjustment/sharing: Informal settlements will be regularised during the planning period by adapting the principle of land sharing. As many of the informally developed areas are low rise and with low density, there is a merit in promoting densification in informal settlements that undergo regularisation’ (p. 90). According to the document that describes the institutions responsible for the master plan of Addis Ababa (145), the organisations responsible for land readjustment (and other related activities) would be the Addis Ababa Land Development and Management Bureau (‘Land preparation, transfer and monitoring’, p. 1) and the AACPDC (‘Solve local land related issues that are reported at the mayor’s office’, p. 1). 10.6.2.3 Tanzania The Guidelines for Preparation of General Planning Schemes and Detailed Schemes for New Areas, Urban Renewal and Regularization (130) stipulate provisions for land readjustment and changes in land tenure. The area undergoing a process of land readjustment must be covered by a regularisation scheme and undergo regularisation. The measures listed under the policy define the process of acquiring and preparing land for development, allocation of space for public uses and development of infrastructure. 10.6.2.4 Dar es Salaam The Dar es Salaam Metropolitan Development Project—Implementation Report (138) describes in detail the process of land readjustment, sale of FAR in the transport corridor and utilisation of income from sale of development rights. The report argues that land readjustment is essential in enabling land value capture 78 BASELINE REPORT: HVT CITY RETROFIT FOR ALL mechanisms. The document states that for the process to be equitable, it must include local landowners and the prospective developers. 10.6.2.5 Mwanza Land readjustment is generally not discussed in the documents examined for Mwanza. 10.7 Affordable/low-income housing Since the implementation of TOD is often associated with an improved public realm and increased land values, it can result in higher housing costs and displacement. It is therefore important to understand provisions for affordability alongside TOD. This includes both policies towards subsidised or low-cost housing as well as informal settlements, both of which are sources of affordable housing. 10.7.1 Subsidised-housing provision Subsidised housing—sometimes referred to as social housing, affordable housing or public housing—is housing that is made more affordable through government subsidy. These subsidies can come in a variety of forms, including direct rental payments, government construction of housing, tax reductions for housing builder or the loosening of government regulations in exchange for the construction of lower-cost units. 10.7.1.1 Ethiopia Subsidised housing is generally not discussed in the national policy documents examined for Ethiopia. 10.7.1.2 Addis Ababa The Addis Ababa City Structure Plan Summary Report (125) points out the challenge of maintaining a diverse range of incomes (‘mixity’) in newer housing projects: ‘The process of keeping the social mix of dwellers in residential settlements (popularly known as ‘mixity’), which had also been an important aspect of the duality of Addis Ababa, is disappearing especially in new settlements’ (p. 11). This plan highlights the need for quality affordable housing and ensuring liveability: ‘One of the immediate challenges is how to provide affordable and adequate housing within a liveable environment’ (p. 85). The plan outlines the percentages of housing needed for different income groups. According to the plan, 35% of new housing should be earmarked for low-income groups, 50% for middle-income groups and 15% for high-income groups. The document specifies that ‘social housing’ (p. 90) will be built for homeless people. The plan also includes general guidelines for an urban form of this housing, such as ‘compact and green development’, ‘linear redevelopment’ along BRT lines and ‘inner-city renewal’ (p. 89). However, specific details about how to construct this housing and the responsible institutions are not included in the plan. The plan does, however, state that there are quite ambitious plans for housing in the city, with ‘the government’ (p. 94) planning to build one million houses in five years. Over the first five-year period of plan, 56% of housing will be on brownfields. During the next five-year period, greenfield development will dominate. According to the plan, the city will be better positioned to provide housing in this second phase: ‘By then, Addis Ababa will have sufficient revenue to provide services and infrastructure and promote housing and other related developments’ (p. 94). Affordable housing is included in the Terms of Reference (TOR) for Transit-Oriented Development (TOD) Project (126). This document outlines a broad strategy for including affordable housing in TOD projects. It orients potential contractors to provide details about ways in which to incentivise affordable housing. For example, implementation strategies ‘should include explicit incentives for the construction of affordable housing (e.g., bonus FAR awarded to projects that include units below 60 sq m/1bed room typology)’ (p. 24). Affordable housing is mentioned, but not emphasised, in the three documents that outline the TOD strategy for the LRT network (136, 137, 143). The TOD Framework Addis Ababa (136) mentions the need for affordable housing in TOD development and says that Addis Ababa has established percentages for affordable housing in new developments; ‘a benchmark standard of sliding-scale condominium projects (40%/60%, 20%/80% and 10%/90%)’ (p. 92). Despite mentioning ‘medium-income’ housing once (p. 50), this document generally emphasises the upper end of the housing range—for example, the international expatriate community at the Torhayloch station. 79 BASELINE REPORT: HVT CITY RETROFIT FOR ALL The TOD Addis Ababa Stage 4: TOD Concept and 3D (Master Plan) includes descriptions of four options for improving housing conditions(137). These are ‘1. On-Site Upgrading, 2. Sites and Services Schemes and Incremental Land Development, 3. Resettlement on Suitable Land and 4. Government-Led New Public Housing’ (p. 36). The TOD Addis Ababa Stage 6: Implementation Strategy (143) states that preliminary market analysis of each of the 11 TODs at LRT stations should include ‘low-, middle- and high-end housing’ and ‘government-backed housing’ (p. 31). However, in general this document emphasises housing for middle- and high-income residents. 10.7.1.3 Tanzania Provision of affordable housing is generally not discussed in the national-level policies and there are no general specifications for affordable-housing provision in the space standard regulations. 10.7.1.4 Dar es Salaam The Dar es Salaam City Master Plan 2016‒2036 (131) begins its discussion on affordable housing by pointing to the key challenge of the absence of national programs for affordable housing. Other challenges stem from lack of available buildable and serviced land and the lack of access to housing finance. The master plan points to opportunities coming from the support of the national government for settlement upgradation as a key way to foster affordable housing. The plan discourages the demolition of informal communities, as this would increase the demand for low-income housing. Provision of affordable housing is mentioned as one of the intended outcomes in the proposed approaches of the Dar es Salaam Metropolitan Development Project (133). The document calls for generating funding for affordable housing through land value capture. 10.7.1.5 Mwanza The Mwanza City Master Plan (134) acknowledges the high demand for affordable housing, and one of the objectives for housing development in Mwanza is incentivising the private sector to provide affordable housing units. The plan links affordable-housing development with the proposed medium-density housing development, shown on the map below (Figure 45) in lighter shade of orange in the example of the build-out scenario for 2035 in the Eastern Fringe Zone. Public investment and land banking are proposed as the primary methods to enable land consolidation to achieve a desirable plot ratio for affordable-housing development. Figure 45: Mwanza’s approach to targeting affordable housing in the medium-density development areas. From Mwanza City Master Plan Vol. 2 (134), p. 67. 80 BASELINE REPORT: HVT CITY RETROFIT FOR ALL 10.7.2 Improving informal settlements Another way to improve the lives of low-income people is to upgrade informal settlements. If done well, this can improve access to services and create communities in line with TOD principles without the need for largescale demolition and displacement. 10.7.2.1 Ethiopia The Urban Planning Proclamation (124) mentions improving informal settlements in a broad sense. For example, LDPs shall define ‘urban renewal, upgrading and reallocation intervention areas’ (p. 6). It also goes into some detail regarding how this will be achieved: ‘Urban upgrading shall... consist in an improvement... of slum areas by maintaining and partially removing structures and through the provision of infrastructures and amenities’ (p. 14). The Local Development Plan Manual (121) states that LDPs can be used to improve unplanned urban centres: ‘This predominance of unplanned development in Ethiopian urbanization poses a substantial need for replanning in all urban centres of the country’ (p. 6). 10.7.2.2 Addis Ababa In the TOD Framework Addis Ababa (136), some of the 11 proposed TODs at LRT stations include informal housing, which would be improved. These 11 stations include three types of urban development: ‘urban improvement’, ‘infill areas’ and ‘new development’ (p. 12). ‘Urban improvement’ is the upgrading of existing informal settlements with basic infrastructure and housing. ‘Infill’ is stitching existing development together. ‘Building on vacant land’ is greenfield development, which is seen as the most financially viable option. It is ‘more attractive to developers’ as it lowers the complexity and cost of development (p. 11). These three options are depicted in Figure 46 below. While ‘new development’ offers a blank slate to create orderly urban development and larger-scale buildings, ‘infill development’ still presents the opportunity for new buildings, depicted in orange. Finally, ‘urban improvement’ presents only limited potential for new buildings, also depicted in orange in the below figure. Figure 46: Types of TOD for Addis Ababa. From the TOD Addis Ababa Stage 4: TOD Concept and 3D (Master Plan) (136), p. 126. The Addis Ababa City Structure Plan Summary Report (125) emphasises the ‘in-situ redevelopment’ (p. 87) of kebele (government-built public housing) housing and legalization of informal settlements. The goal is to avoid having to move residents to other locales: ‘Relocation is avoided unless found necessary for safety, security, environmental reasons, etc.’ (p. 87). The plan emphasises the advantages of improving existing settlements through TOD. The advantages include efficiency in terms of reducing travel and related expenses for residents: ‘55.76% of the units will be built in brown land (through renewal, redevelopment and land readjustment). This requires the clearing of a large part of slums and inefficiently used land. Since the government is planning to build one million houses within the next five years, it is important that priority should be given to building these houses in the inner parts of the capital as this would allow using the existing 81 BASELINE REPORT: HVT CITY RETROFIT FOR ALL infrastructure as well as to efficiently exploit the built mass transit facilities. Besides, since most of the families that will be accommodated in these houses will be middle- and low-income groups, such locations will allow them to reside near their jobs. This will reduce transportation related expenses and congestion’ (p. 94). The Terms of Reference (TOR) for Transit-Oriented Development (TOD) Project (126) does not explicitly emphasise retrofit of informal settlements, but does talk about ‘re-development’. TOD sites should be ‘substantially underutilised, redevelop-able or undeveloped. In general, 80% of minimum-sized sites should be underutilised or undeveloped; the remaining 20% may contain existing viable uses’ (p. 10). This emphasis on underutilised, undeveloped land suggests that retrofitting existing settlements is not the main goal of this TOD project. However, it appears that some of the four target stations may include existing dense settlement, which may or may not be formal. 10.7.2.3 Tanzania Generally, Tanzanian national government policies tend to support upgrades of informal settlements over demolishing them due to many benefits. However, the upgradation efforts require an immense coordination effort entailing land surveying, provision of infrastructure, community participation and maintenance (131). The regularisation processes that are often part of settlement upgrades must be specified as a regularisation scheme, as explained in the Guidelines for Preparation of General Planning Schemes and Detailed Schemes for New Areas, Urban Renewal and Regularization (130). The regulation aims at minimizing resettlement in the process of preparation and execution of regularisation schemes. Recommendations to promote local community capacity and self-financing efforts connected to land tenure processes are mentioned in the National Human Settlements Development Policy (128). Neither of the aforementioned policies mention financing methods for settlement upgradation, and from references in the Dar es Salaam City Master Plan 2016‒2036 (131), it is known that many schemes that aimed to upgrade informal settlements were made possible by the support of multilateral development banks. One such case was the Sites and Services Upgrading Schemes under the Community Infrastructure Upgrading Program supported by the World Bank, with small contributions from the Government of Tanzania, local communities and the City Council. Yet the schemes were abandoned due to continued dependence on external funding (131). 10.7.2.4 Dar es Salaam The Dar es Salaam City Master Plan 2016‒2036 (131) examines morphologies of different informal settlements, looking at housing type, population density and level of formalization. Informal settlements are articulated in the master plan under the residential land-use category (see Figure 47), and several types of informal settlements are acknowledged: formalised settlements, regularised informal settlements, upgraded settlements, consolidating settlements and scattered settlements, as shown in the map below. Scattered informal settlements occupy most residential land uses, about 18% of total land uses (p. 54). In comparison, all planned built-out residential areas constitute about 16% of total land uses. The plan points out that high densities and tight random layout of the settlement structure increase costs of infrastructure and service provision. Further, the master plan recommends that regularisation efforts are necessary in saturated areas, but they are also recommended in early land occupation stages to minimise future time and money costs. 82 BASELINE REPORT: HVT CITY RETROFIT FOR ALL Figure 47: Dar es Salaam informal settlements (2016) (131), p. 70. 10.7.2.5 Mwanza The general approach for development in Mwanza, as stated in the Mwanza City Master Plan Vol. 2, is to make the informal settlements more liveable by providing all necessary public facilities. Informal settlements that find themselves on the path of the proposed BRT corridors will have an opportunity for redevelopment to capitalise on the opportunity to densify and improve the local conditions. One of the threats discussed in the master plan, deriving from the past attempts to regularise the informal areas, is that local government authorities do not have funding to provide infrastructure to newly upgraded settlements. Therefore, a careful approach should be devised in order to get proper allocation of funding for redevelopment, especially in the TOD areas. Next, the plan presents a thorough analysis of informal settlement characteristics, including infrastructure coverage, land value and development potential. The plan proposes detailed steps for the regularisation process and a strategy for short-, medium- and long-term upgrading. The figures below are excerpts of the analysis of informal settlements consisting of a map of locations and boundaries of individual informal settlements (Figure 48) as well as a map of informal areas determined for short-term redevelopment (Figure 49). 83 BASELINE REPORT: HVT CITY RETROFIT FOR ALL Figure 48: Mapping of Mwanza’s informal settlements. From Mwanza City Master Plan Vol. 2 (146), p. 190. Figure 49: Proposed short-term strategy for informal settlement redevelopment. From Mwanza City Master Plan Vol. 2 (146), p. 198. 84 BASELINE REPORT: HVT CITY RETROFIT FOR ALL 10.7.3 Land tenure Assigning and securing land tenure is often an important but challenging part of informal settlement upgrading. As informal settlements are often not legal, residents are subject to eviction at any time. Assigning ownership or occupancy rights can provide security and stability and help to build wealth. The process, however, can be complicated by levels of informal landownership and sub-rentals. 10.7.3.1 Ethiopia Land tenure is generally not discussed in the national policy documents examined for Ethiopia. 10.7.3.2 Addis Ababa The TOD Framework Addis Ababa (136) mentions the importance of knowing the status of land tenure in existing informal settlements in the 11 proposed TOD sites along the LRT lines and relates the tenure conditions to the need for public participation: ‘Knowledge of the site risk and the status of land tenure are critical. Site risks and tenure conditions vary from community to community, therefore different levels of community participation may be required in each case’ (p. 35). The TOD Addis Ababa Stage 4: TOD Concept and 3D (Master Plan) (137) states that a quarter of existing housing is not legally tenured: ‘25% of existing housing units do not have a legal deed, and tenure certificate units are built on illegally obtained land’ (p. 10). That document, does not, however, explore solutions for this situation. The Addis Ababa City Structure Plan Summary Report (125) includes tenure options for housing, including different types of rentals (40%), ‘the government’ (30%) and ‘real estates and individuals’ (15%) (p. 87), as depicted in Figure 50 below. Figure 50: Rental and ownership options for housing in Addis Ababa (125), p. 87. The plan suggests transferring ownership of kebele houses to tenants: ‘The most feasible strategy to upgrade the quality of these houses is conditional ‘privatisation’: transfer to sitting tenants under the condition that ownership will only be transferred when the houses are improved to a minimum level of standard’ (p. 88). 85 BASELINE REPORT: HVT CITY RETROFIT FOR ALL According to the document that describes the institutions responsible for the master plan of Addis Ababa (145), the organisations responsible for land tenure are the Addis Ababa Land Development and Management Bureau (‘land preparation, transfer and monitoring’, p. 1) and the AACPDC (‘solve local land-related issues that are reported at the mayor’s office’, p. 1). 10.7.3.3 Tanzania Land-tenure processes are prominently described in the National Land Policy (127). The main reasons that necessitated creation of this policy were the need for organised land for settlements, the desire to protect rural land from encroachment of sprawling development and investment opportunities on prime land in urban areas. The policy addresses land tenure and puts forward measures preventing land speculation and protecting land rights of vulnerable populations. The National Human Settlements Development Policy (128) states that the informal communities should be supported to form and run CBOs and NGOs for the upgrading processes, involving surveying of plots. A special revolving fund could be set up for plot development and other mechanisms for self-financed surveying. The Guidelines for Preparation of General Planning Schemes and Detailed Schemes for New Areas, Urban Renewal and Regularization (130) require mandatory surveying of households in affected informal areas in the process of preparation of regularisation schemes. The regularisation schemes generally facilitate formalisation of tenure systems and improvements of services and infrastructure. The Dar es Salaam City Master Plan 2016–2036 (131) notes that regularisation and formalisation of informal settlements in the past decades have led to provision of security of tenure and also municipal services. 10.7.3.4 Dar es Salaam Following the provisions of Guidelines for Preparation of General Planning Schemes and Detailed Schemes for New Areas, Urban Renewal and Regularization (130), the Dar es Salaam planning authority conducted a housing survey employing a highly collaborative method involving town planners, over a hundred local leaders and a sample of 1,687 households. The document also mentions that the customary land tenure system (one which involves community land titles or grandfathered land occupancy) is actually burdensome to planning authorities because of huge costs of compensation for plots that are locked in large land tracks under this system. Formalisation of tenure is part of the housing regeneration strategy discussed in the Dar es Salaam City Master Plan 2016‒2036 (131). 10.7.3.5 Mwanza While the Mwanza City Master Plan (146) proposes a detailed strategy for slum regularisation, it does not emphasise land tenure as the prominent feature of this process. The plan does, however, refer to national regulation calling for land tenure implementation in the regularisation schemes. 10.8 Creating TOD In the following subsection, we discuss the various processes that government have put in place to actively facilitate the creation of TOD. 10.8.1 Goals for TOD Below we describe how government policies in the target countries and cities present goals for TOD. 10.8.1.1 Ethiopia While the Street Design Standards for Urban Ethiopia (122) is not directly focused on TOD, it does mention TOD in a few places. For example, the guiding principles for the street design standards include ‘Pedestrian Oriented Developments’ and TOD. The document’s definitions of TOD emphasise compact, walkable development that reduces travel demand: ‘(TOD): is a development consisting of mixed, compact and walkable neighbourhoods connected with public transport passing over, across or through part/s of urban centres or city centre/s of the urban centre’ (p. 19), and: ‘Mixed land use, compact, poly-centred and decentralised developments reduce the need for travel and demand for transport. Such developments if supported with public transport at standard walkable distance will create Transit Oriented Developments (TOD)’ (p. 56). Further, these standards suggest that exclusive lanes for PT can support TOD. Exclusive lanes 86 BASELINE REPORT: HVT CITY RETROFIT FOR ALL ‘could start from only bus lanes, and then [be] developed to Bus Rapid Transit (BRT) and Transit Oriented Development (TOD)’ (p. 82). Similarly, the Ethiopia Non-Motorised Transport Strategy 2020–2029 (135), while not focused on TOD, does include the concept. TOD is to be promoted, with urban development concentrated within walking distance of PT nodes. The strategy exhorts planners to use land use strategically to create compact, high-density development with affordable housing and maximum off-street parking limits within 500 metres of BRT and high-frequency bus corridors. It also includes ‘adoption of TOD policies’ (p. 66) as a key indicator for monitoring progress of the national NMT strategy. 10.8.1.2 Addis Ababa The Addis Ababa City Structure Plan Summary Report (125) recommends TOD primarily in the context of areas outside of the existing urban core, termed ‘edge settlements’: ‘Any urban extension should consider transport as an organizing element’ (p. 42). The plan also introduces the concept of ‘NODs’: ‘Development of nodes with reasonable distance (NODs).’ NODs appear to be urban development based on existing urban centres. This plan presents TODs and NODs as part of an effort to contain urban growth and coordinate planning initiatives: ‘This will enable the coordination of efforts, especially the capital’s and of those municipalities at the edge of Addis Ababa….Managing the physical expansion of existing edge settlements (with the framework of managing from expanding farther) and preventing the creation of new ones is mandatory. Both concepts (TOD and NOD) will also provide the basis for spatial organization of Addis Ababa’ (p. 42). Although not explicitly using the term TOD, the plan does call for growth along PT corridors. One of the main strategies for growth is ‘Coordinating mixed-use housing development and redevelopment along mass transit lines and business corridors’. This is de facto TOD. The tender for TOD consultancy service in Addis Ababa (153) specifies that the contractors are to create a pilot project/case study that can be replicated in other locations in the city. The Terms of Reference (TOR) for Transit-Oriented Development (TOD) Project (126), which accompany the tender, call for detailed TOD plans for four LRT stations: Autobus Terra, Torhayloch, Saris Market and Megenagna. The TOR also says that Autobus Tera is the ‘station with best potential for TOD development’ (p. 13). This station area, depicted in Figure 51 below, includes planned LRT and BRT stations, a multimodal exchange with long-distance buses, paratransit, taxis and urban freight delivery. With the city’s largest market in the station area, the TOR says this site has potential to support high-density development around the planned transport nodes. 87 BASELINE REPORT: HVT CITY RETROFIT FOR ALL Figure 51: Autobus Terra area TOD development boundary. From Terms of Reference (TOR) for Transit Oriented Development (TOD) Project (126), p. 14. The TOR document refers to the TOD Standard (110), created by ITDP (2017) to measure the performance of TODs. The TOR presents principles of the standard—including prioritizing pedestrians, planning for mixed uses and incomes, and creating compact, dense settlements—as guidelines for the planning to be created for four TODs under the contract. Further, potential contractors are required to use the TOD Standard to present a score for each of the four potential TOD sites, and the TOR refers to the TOD Standard website. Three documents present a TOD strategy for the LRT network (136, 137, 143). The first document, the TOD Framework Addis Ababa (137), outlines TOD development at 11 LRT stations. The next plan, TOD Addis Ababa Stage 4: TOD Concept and 3D (Master Plan) (137), provides in-depth plans for four stations (Le Gare, Saint Lideta, Menelik II Square, Autobus Terra) along the LRT network. Finally, TOD Addis Ababa Stage 6: Implementation Strategy (136, 137, 143) emphasises the financial/commercial aspect of TOD implementation at the four LRT stations. The LRT network is depicted in Figure 52 below. It includes two main axes (East–West and North–South). The system is 31.6 km long, with 39 stations, and has been operational since 2015. 88 BASELINE REPORT: HVT CITY RETROFIT FOR ALL Figure 52: TOD locations on LRT network in Addis Ababa. From the TOD Framework Addis Ababa (136), p. 15. 10.8.1.3 Tanzania The national-level policies do not contain specific language on TOD. However, goals for orderly development and access to public infrastructure are related to TOD. 10.8.1.4 Dar es Salaam The Dar es Salaam City Master Plan (131) mentions TOD only a few times. However, it identifies areas with great TOD potential, such as the stretch of Morogoro Road close to Ubungo Sub-Centre. The images in Figure 53 below are examples of areas of TOD potential at major road and transport junctions. Figure 53: Examples of TOD potential areas of Dar es Salaam: Morogoro Road and Sam Nujoma junction (left) and a BRT stop along Morogoro Road (right). From Dar es Salaam City Master Plan (131), p. 419. The Dar es Salaam Metropolitan Development Project aims to enable TOD anchored around the BRT corridor. The primary focus for corridor development is to capitalise on the BRT investment, reflected in establishment of priority areas with the most strategic and attractive potential for TOD (133). 10.8.1.5 Mwanza While the Mwanza City Master Plan (146) generally promotes compact growth, TOD is not specifically articulated as a way to deliver it. However, volume 2 of the Master Plan introduces the idea of ‘self-sustaining neighbourhoods’ with examples of a neighbourhood anchored around a transport stop. However, the plan also proposes a neighbourhood anchored around car parking, showing that generally TOD is not uniformly applied as a concept and strategy. Yet volumes 3 and 4, Urban Design Guidelines and Zoning Regulations, of 89 BASELINE REPORT: HVT CITY RETROFIT FOR ALL the same Master Plan document series, speak about a 150-metre transit overlay along the proposed BRT corridor with higher density and mixed use (139, 146). 10.8.2 Implementation strategy Below, we describe the strategies that governments in the target countries and cities have identified for implementing TOD. 10.8.2.1 Ethiopia The documents for Ethiopia did not provide information specifically for TOD implementation but did provide guidelines for implementation that could be applied to TOD. The Local Development Plan Manual (121) provides guidance for the preparation of implementation plans for LDPs—which could, of course, be for TOD projects. The Ethiopia Non-Motorised Transport Strategy 2020–2029 (135) covers the implementation of walking and cycling strategy in considerable detail, describing plans, framework, planning, funding, capacity, monitoring and evaluation. 10.8.2.2 Addis Ababa The Addis Ababa City Structure Plan Summary Report (125) has plans for implementation (not specifically for TOD, but the plan is TOD-oriented, as described above) has implementation plans for ‘1st & 2nd Five Year’ development. There are maps for the PT network, corridors and urban centres, with ‘1st & 2nd Five Year’ development. Although no such map specifically details TOD, taken together, these maps would present an implementation plan for TOD in the city. Also, although not TOD-specific, much of this plan is comprised of a section titled ‘Implementation Strategies and Tools.’ For every section (including the transport network, housing and urban centres) there are subsections for ‘implementation strategies’ or ‘implementation tools’. These are broad guidelines rather than specific steps for implementation. For example, for the transport network this includes ‘Reserve appropriate lanes for mass transit lines’ (p. 208), and for city centres, ‘Developing adequate Urban Design Guidelines for development of the centres’ (p. 212). The plan does include a TOD-specific proposal for the urban centre of Kality (a sub-city of Addis Ababa in the southern portion of the city). The plan for Kality emphasises inclusive TOD: it ‘adapts the principles of Transit Oriented Development; optimisation of connectivity (easy access to modal shift); pedestrian-friendly compact development and social mix (social inclusion)’ (p. 227). A proposal for Main City Centre (MCC) development, while not specifically for TOD, does emphasise planning for pedestrians, including a ‘car-free zone’ (p. 223) and includes a ‘Multimodal Central Station’ (p. 224). This could be a de facto TOD. While two of the three planning documents on TOD for the LRT network (136, 137) do not present details on implementation, the TOD Addis Ababa Stage 6: Implementation Strategy (143) largely concentrates on financial forecasting of the four TOD projects. The latter document has a chart that includes phases of the TOD project (planning and initiation, feasibility, commitment, construction, management and operation, pp. 25–26), but the majority of these steps are not detailed elsewhere the document. The TOR tender for TOD consultancy services in Addis Ababa (153) calls for the TOD plans to be implemented in five years. The accompanying Terms of Reference (TOR) for Transit-Oriented Development (TOD) Project (126) says contractors should developing a TOD implementation framework, policy, strategy and guidelines ‘with clear goals, action-oriented plans and performance indicators of the TOD program’ (p. 29). 10.8.2.3 Tanzania The national policy documents we reviewed for Tanzania did not provide information specifically for TOD implementation. However, implementation of TOD plans has to be done in accordance with the national Guidelines for Preparation of General Planning Schemes and Detailed Schemes for New Areas, Urban Renewal and Regularization (130). These guidelines include detailed provisions for creating and executing land development schemes (plans) as well as all the necessary elements that must accompany them, such as mapping, surveying, participatory planning, evaluation and monitoring, among others. 90 BASELINE REPORT: HVT CITY RETROFIT FOR ALL 10.8.2.4 Dar es Salaam The Dar es Salaam City Master Plan 2016–2036 (131) proposes a development strategy where the first phase (between 2016 and 2021) will focus densification to the existing city, particularly within the outer ring road, and accommodate about 2.5 million people. 10.8.2.5 Mwanza The Mwanza City Master Plan (146) proposes an elaborate densification strategy along the proposed BRT corridors. Though this strategy is not called TOD, it does feature TOD characteristics, including a 500-metre high-density zone on either side of BRT corridors, walking and cycling interventions, affordable housing and informal settlement redevelopment along the BRT corridors. (See ‘Integration of land use and transport’ and ‘affordable housing provision’.) 10.8.3 Institutions responsible for TOD We describe below the institutions that governments have identified to implement TOD policies. 10.8.3.1 Ethiopia While not specific to TOD, the Local Development Plan Manual (121) says LDPs shall prepare ‘institutional plans’ (p. 46) to decide responsibilities and detailed duties for creating and implementing LDPs. The manual includes the possibility of PPPs. The manual emphasises identifying and working with relevant institutions for all stages and aspects of LDP planning and implementation. These institutions, however, are not specified. This is understandable, as the document is applicable to the entire country, and relevant institutions likely vary across locales. 10.8.3.2 Addis Ababa The TOD Addis Ababa Stage 6: Implementation Strategy (143), which details the implantation of TOD at LRT stations, highlights the ERC (Ethiopian Rail Corporation) and the City of Addis Ababa as the main institutions related to TOD. While these institutions are certainly relevant, the lack of other relevant institutions to be involved with the development of these TODs may raise a flag. The TOR for Transit-Oriented Development (TOD) Project (126) names the AALDMB (Addis Ababa Land and Development Management Bureau), AAPDCo (Addis Ababa Plan & Development Commission), AARA (Addis Ababa Road Authority) and AALRT (Addis Ababa Light-Rail Transport) as the principle government institutions related to TOD. The TOR provides an overview of why the TOD strategy for the LRT network (136, 137, 143) failed. According to the TOR, ERC pushed TOD as a means to pay for the LRT investment by capturing the land value around the LRT stations. However, the AAPDCo ‘does not have the same vision for TOD and fears that development at such scale will disrupt the existing neighbourhoods and adversely affect city governance’ (p. 4). The AAPDCo also had concerns regarding equity and widespread access to transit, as well as implementations challenges, including: ‘1) Planning and operational capacity; 2) access to finance; 3) establishing PPPs; 4) high investment cost and 5) lengthy and contentious land acquisition process’ (p. 4). While not specifically about TOD, the Addis Ababa City Structure Plan Summary Report (125) mentioned staffing and capacity issues as a main challenge for the implementation of the previous master plan (Addis Ababa City Development Plan (2004–2014): ‘Frequent staff turnover and lack of organised data which inhibit institutional memories have in turn limited the level of implementation’ (p. 13). This concern is echoed by the TOR for Transit-Oriented Development (TOD) Project (126), which includes institutional capacity-building, knowledge transfer and implementation as important components: ‘Capacitybuilding development to facilitate TOD implementation/knowledge transfer for decision-makers and local professionals/assistance for formulating TOD implementation program’ (p. 27). 10.8.3.3 Tanzania The Guidelines for Preparation of General Planning Schemes and Detailed Schemes for New Areas, Urban Renewal and Regularization (130) is a good source to help understand the intricate institutional roles in Tanzanian urban development where roles of national and local government authorities are delineated with relation to carrying out the development schemes. The minister responsible for town planning, in consultation with the local government authority, declares new planning schemes. The minister also approves 91 BASELINE REPORT: HVT CITY RETROFIT FOR ALL planning schemes. Local government authorities are responsible for the drafting and execution of planning schemes and for passing resolutions for preparation of general planning schemes. Those authorities also have the power to propose alternative approaches to the scheme after consultation with the city council and the ministry. 10.8.3.4 Dar es Salaam The Dar es Salaam Metropolitan Development Project—Appendix C Implementation Report (138) analyses institutional structures of agencies responsible for planning and implementing development plans. It also analyses issues in the institutional setup, proposing changes to the levels of responsibility and reporting that would allow local governments more flexibility. The institutional setup in Dar es Salaam is challenging. Municipalities report to the President’s Office for Regional Administration and Local Government (PO-RALG), and therefore the Dar es Salaam City Council does not have direct authority over municipal activities. Some of the recommendations for institutional changes include a proposal to set up a citywide agency responsible for transport planning (Dar es Salaam Transport Authority, or DUTA), and strengthening the role of city councils by allowing them to be the intermediate bodies that report to the President’s Office. They would also be granted the ability to delineate priority zones for TOD, a responsibility that presently lies with the minister. The following graph (Figure 54) illustrates the proposed institutional setup and responsibilities of agencies and authorities. Figure 54: Existing and proposed institutional structure for planning and delivery of infrastructure and development. From the Dar es Salaam Metropolitan Development Project (138), pp. 24‒25. The Dar es Salaam City Master Plan 2016–2036 (131), on the other hand, proposes two new institutions that can help bridge the silo between the local and the national levels of government. The proposed Dar es Salaam Metropolitan Authority would coordinate planning activities throughout the metropolitan area, manage municipal and district councils, and deliver integrated and comprehensive development plans. This authority would report to the PO-RALG, in place of councils. The Metropolitan Planning Authority would be the executing entity that will manage citywide and metropolitan transportation and infrastructure projects and execute the metropolitan development plan. 10.8.3.5 Mwanza The Mwanza City Master Plan (146) proposes a specific institutional setup to enable delivery of the master plan and implementation of the catalyst projects. Under this setup, a special Master Plan Implementation Unit (MPIU) should be in charge of implementation of urban design proposals and should lead activities such as market feasibility, tender preparation, supporting investors in identification of opportunities and monitoring adherence of proposals with the Design Guidelines. The City Council will remain the main planning authority overseeing the MPIU. The document also promotes public–private partnerships to create stronger focus on the delivery of catalyst projects (p. 90). 92 BASELINE REPORT: HVT CITY RETROFIT FOR ALL 10.8.4 Funding and land value capture To implement TOD, governments require funding to pay for street improvements, parks and investments in public transport, among other areas. These investments often result in increases in the value of the surrounding land. Government may implement policies to capture some of that increase in value back to the city, so the TOD investments do not simply boost the wealth of landowners in the area. Below, we discuss this process of land value capture along with other means of funding TOD implementation. 10.8.4.1 Ethiopia The national policy documents we reviewed for Ethiopia did not provide information specifically for funding and land value capture. 10.8.4.2 Addis Ababa The Addis Ababa City Structure Plan Summary Report (125) mentions funding and financing repeatedly. This is not specific to TOD, but it is relevant, as the plan is TOD-oriented overall. The plan details the existing financial situation of the city, including expenditures, tax and revenue sources, and revenue forecasts for the years 2009-2014. The financial needs of the different components of the plan, e.g., the transport network and housing, are also detailed in the plan. The total cost of the Structure Plan is depicted in Figure 55 below, with total costs in Birrs (£1 = 51.84 Birr in December 2020). The largest costs are for housing and development, environment (this includes solid waste, sanitation and parks), and streets and transport (174.0, 62.3 and 41.7 billion Birrs, respectively). These funding items, as well as ‘centres’, another large-ticket item at 30.16 billion Birrs, could directly support TODs in the city. Figure 55: Total required finance for Addis Ababa. From The Addis Ababa City Structure Plan Summary Report (125), p. 219. Potential revenue sources include loans, sales of bonds, an improved tax collection system, broader tax base, cross-subsidies for public services (this is mentioned but not described in detail) and involvement of the business sector in social development and in activities that improve local infrastructure. The tender for a TOD consultancy service in Addis Ababa (153) seeks to promote density through TOD to help recoup investments in PT. It aims to promote ‘higher density, more compact, mixed-use walkable development within easy walking distance of mass transit, such as the BRT and LRT stations that will maximise transit ridership potential, which, in turn, will create a revenue return from transit investments in Addis Ababa, Ethiopia’ (p. 1). It also calls for potential contractors to include financing and consider PPPs: ‘Review and make recommendations for TOD projects approval of business cases with full feasibility recommendations and financial (including PPP/other mechanisms modalities)’ (p. 29). Financing through value capture was central to the project that sought to create TOD on the LRT network, as outlined in three documents (136, 137, 143). The TOD Framework Addis Ababa (136) includes a ‘Financial Vision’ section for each of the 11 TODs at LRT stations with financial analyses. These include construction 93 BASELINE REPORT: HVT CITY RETROFIT FOR ALL costs and incomes from leases of land at the TODs. The TOD Addis Ababa Stage 6: Implementation Strategy (143) is largely about financing and possible revenue streams from the four TODs for which it provides indepth plans. The document includes the costs of implementation and income from land leases and property sales. While this document does not mention value capture explicitly, the aim of this project is to harness the wealth created by improving access in the areas surrounding the LRT stations. The TOD project for LRT stations (120) relates the availability of land for development with the profitability of the TOD, where more space for urban infill and new development makes a TOD perform better and be more profitable: ‘For St. Lideta Mariam Station, when compared to other TODs, it has one rather significant parcel available for new development, coupled with a plethora of urban infill land available plus a great amount of land available for urban improvement. This increases performance and profitability’ (p. 19) 10.8.4.3 Tanzania The Guidelines for Preparation of General Planning Schemes and Detailed Schemes for New Areas, Urban Renewal and Regularization (130) stipulates that community members should be mobilised to contribute materials, labour and finances. The central government and local authorities will provide financial and technical support, and more resources will be solicited from development partners, including donors, NGOs, CBOs and other private institutions to implement regularisation. To reduce project costs and ensure effective participation by beneficiaries, land for public use shall be accessed through contribution by individual community members. In exceptional cases, acquisition by the central and local government through fair compensation or purchasing from the landowners shall be for public use. 10.8.4.4 Dar es Salaam The Dar es Salaam Metropolitan Development Project—Implementation Report (138) provides detailed recommendations on land value capture processes as a way of funding TOD in the transport corridor. Land readjustment, transfer of development rights and the sale of FAR are critical steps in this process, allowing the city to capture the value which the city can use later in the process of land acquisition in the transport corridor. This is meant to capitalise on the transport corridor and to be a way to offset the otherwise sub-optimal and random development that occurs due to a lack of framework facilitating development in strategic areas. The guidelines discourage the excessive use of public funds and taxation; rather they make a case for land value capture and private investment. The plan proposes a Development Corporation Model which is an entity composed of stakeholders who combine or redistribute parcels for sale or development, auction them and share the profit from the sale or development. Such development corporations can include the government, DART and municipalities of Dar es Salaam as well as NGOs. 10.9 Vulnerable Groups Below are the results of policy documents with regards to vulnerable groups, particularly women, elderly, children, disabled, ethnic and religious groups and the poor. This is a cross-cutting domain that has overlaps with the other domains mentioned above. Included here are results not included in other sections—for example, while the poor were covered under low-income housing, this section includes language relative to the poor that is not included under that topic. 10.9.1 Ethiopia Interestingly, the LDP manual (121) from 2006 is perhaps the document that gives the most attention to vulnerable groups. Generally speaking, this document focusses much of its attention on existing social fabrics in places of LDP interventions. It orients professionals carrying out LDPs to examine existing indigenous social and financial institutions (e.g., Mahibir, Idir and Equb), women’s groups, as well as levels of ‘beggary’ (p. 35), prostitution, drug addiction, sexual abuse and trafficking, ‘streetism’ (p. 35), as well as ‘major social problems’ 94 BASELINE REPORT: HVT CITY RETROFIT FOR ALL (p. 36), among others. The manual also recommends speaking to representatives’ groups of elderly populations and religious and ethnic groups. The Street Design Standards for Urban Ethiopia (122) pays considerable attention to disabled populations, the elderly and children. These are mostly design considerations for these groups to create accessible infrastructure, such as sidewalks and ramps. It also mentions that public festivities of religious and ethnic groups should be accommodated by providing appropriate space and traffic operations. Similarly, the Ethiopia Non-Motorised Transport Strategy 2020–2029 (135) emphasises creating favourable conditions for women, children and people with disabilities on urban streets. It particularly emphasises gender equity and the need to ensure that women and girls are comfortable walking, biking and using public transportation. 10.9.2 Addis Ababa The Addis Ababa City Structure Plan Summary Report (125) covers some vulnerable groups in detail, namely religious groups, the poor, elderly, children and women. Regarding religion, it includes recommendations for the creation of additional places of worship and cemeteries for different faiths to ensure that these are equitably represented in the city. Religious institutions are included in the land-use map of Addis Ababa created for the plan. Similar to the above-mentioned documents, for the street network, the plan highlights the need to create streets that respond to the needs of the elderly, children and people with disabilities. The plan also covers the financially vulnerable, including elderly and populations with very low or no incomes. It provides recommendations for dealing with ‘beggary’, including improving access to services and public resources. Interestingly, the plan notes the potential of urban and peri -urban agriculture (UPA), defined as ‘the growing of crops and trees and rearing of livestock within or on the fringes of urban areas’ (p. 141). The plan emphasises the potential of UPA to improve conditions for vulnerable groups: UPA may function as an important strategy for poverty alleviation and social integration (social inclusion) of disadvantaged groups like women, the youth, HIV/AIDS victims, discriminated minority groups, disabled people, elderly people without pensions and other vulnerable and marginalised community groups to find work and generate income, and be self-reliant’ (p. 161). Women were also mentioned in the context of dairy farming, an activity that can be an excellent source of income for women: ‘Above-normal profits are earned with very low capital input by even the owners of the smallest-scale backyard dairy units in the city, who are generally women’ (p. 139). Similar to its reference in the LDP manual (121), the structural plan also pointed out the importance of indigenous social institutions and practices (‘Edir, Equb, Mahiber, Kircha and ‘Coffee Ceremony’ and the traditions of celebrating holidays with neighbours’), and that these were often lost when communities were relocated, placing additional strain on the social fabric of financially vulnerable populations (p. 99). 10.9.3 Tanzania In our review of national land development policies, we found two documents that address the issues of equity, particularly from the gender and age perspectives. The National Human Settlements Policy (128) talks extensively about inequity for women seen in issues such as much higher unemployment rates (60% for women compared to 22% overall) and unequal access to land, housing ownership and opportunities. Housing ownership, especially through inheritance, still typically favours women. The settlements policy addresses these issues broadly by calling for provision of adequate and affordable shelter to all income groups in Tanzania. Further, the policy objectives call for ‘serviced land available for shelter and human settlements development in general to all sections of the community, including women, youth, the elderly, disabled and disadvantaged’ (p. 27). The policy also addresses public participation of women, recognising that development plans must be gender-sensitive, and thus calls for legislation and programmers to reflect perspectives of gender and vulnerable groups. Lastly, the policy indicates the necessity to create performance indicators specifically able to disaggregate information on gender inequities in order to track implementation progress of development policies and plans. 95 BASELINE REPORT: HVT CITY RETROFIT FOR ALL The Land Policy of Tanzania (127) addresses the issues of gender from the standpoint of women rights to access land and landownership, as women generally have inferior land rights relative to men under the customary land law. These laws enabled village councils to discriminate against women and allocate land to heads of households, who are usually men (p. 12). The policy statement stipulates that women should be equally able to access land and secure their tenure through land purchase and land allocations. However, this policy does not apply to custom of ‘inheritance of clan land’, if not contradicting constitutional law. Local policies tend to approach equity from the standpoint of provision of housing and services to all income levels, including low-income populations, examined in earlier chapters. 10.9.4 Dar es Salaam The Dar es Salaam Master Plan 2016–2036 (131) includes references to vulnerable populations as a whole, and makes a statement that ensuring equity and welfare of the most vulnerable creates a sense of a collective society and enables everyone to participate in the realisation of city’s visions (p. 5). Further, the plan links social vulnerability to the impacts of climate change and subsequent social and economic challenges. Climate adaptation in plans and education of the public are the main actions that can lessen those impacts on vulnerable populations. 10.10 Policy and planning documents—baseline assessment 10.10.1 Ethiopia, Addis Ababa and Bahir Dar The capital of Ethiopia appears to be relatively well-equipped to implement TOD. Numerous documents at the federal and municipal level include TOD as a central, organising principle for urban development. The central planning document for Addis Ababa, the Addis Ababa City Structure Plan Summary Report (125), explicitly includes TOD as a strategy for settlements on the periphery of the city. The strategy for urban growth includes many TOD elements: building on existing urban centres, connecting these with PT, prioritising pedestrians and densifying along PT corridors. The city has also undertaken projects that seek to create TOD, and the planning work completed to date has been substantial. Although the project for TOD at the LRT stations (136, 137, 143) did not prosper, the planning work was completed, and it contains a wealth of information on which subsequent TOD initiatives, one of which has already includes a tender and TOR, can build. In fact, both the newer project and the older one have one TOD location in common: Autobus Terra. Called the ‘station with best potential for TOD development’ (p. 13) in the TOR (126), this area seems to be a logical location for TOD. Beyond TOD-specific documents, the national and municipal levels appear to have considerable support for the urban-planning tools needed to create such development. This includes guidelines for planning processes, the ability to expropriate, a solid understanding and knowledge of existing zoning and building controls, and the ability to use these to create the density needed for TOD. National-level plans (122, 135) also emphasised PT, walking and cycling. The documents showed the federal government plays a prominent role in landrelated issues and housing provision. Taken together, these elements could prove to create an environment conducive to the creation of inclusive TOD. The policy documents do not, however, show a consensus on the best way to provide affordable/low-cost housing as part of TOD. While the Addis Ababa City Structure Plan Summary Report (125) emphasised improving existing kebele housing and informal settlements as opposed to relocation, other documents for TOD (126, 136, 137) emphasised infill or greenfield development and included affordable, government-built housing in those developments, citing the elevated cost of retrofitting existing settlements. Initiatives for TOD in the city will need to balance the advantages of retrofitting existing settlements (avoiding relocation, taking advantage of existing infrastructure, reducing new travel) with the economic advantages of infill and greenfield developments. While the documents showed a consensus that PT (including LRT and BRT), walking and cycling were desirable paths for transport, there was little recognition of the predominance of informal public transport. Two documents (136, 137) did mention existing minibus taxi stops, but they did not suggest how informal public transport can be improved. Although this may be beyond the scope of a TOD project, improving paratransit services will be an important challenge. 96 BASELINE REPORT: HVT CITY RETROFIT FOR ALL Participation was not a strength of the documents for Ethiopia and Addis Ababa. While this topic was included in proclamations, plans and manuals, our analysis did not encounter details on how participation should be carried out or evidence of projects that were strongly based on participative methods. This could be an area for improvement for TOD initiatives in the city. Some documents suggest evidence that stronger institutional capacity is needed to support TOD in the city. The city’s current master plan (149) mentions staffing and capacity issues as a main challenge for the implementation of the previous master plan, and the TORs for TOD in the city (126) include capacity-building for local government and private-sector stakeholders as a main component. The documents show that creating TOD in Addis Ababa will be a complex endeavour. The documents for the project for TOD at the LRT stations (136, 137, 143) are evidence of a well-funded, sophisticated planning effort. However, this project had enough drawbacks to cause it to be abandoned. That project was not consistent with the city’s own master plan, raised concerns about equity and was too strongly oriented toward value capture for the LRT system, according to the TOR for the subsequent TOD project in the city (126). This project underscores the importance of stakeholder coordination for planners who wish to promote TOD in Addis Ababa. Although we did not analyse any documents specific to Bahir Dar (as explained in the ‘data’ section), since the city generally follows national guidelines and the national government plays a strong role in urban development, we can infer some tentative conclusions about the baseline for TOD in the city. In general, this analysis suggests that the concept of TOD is much more established in Addis Ababa than in Bahir Dar, as evidenced by the relative wealth of planning documents for TOD in the former city. However, TOD is included in some national-level planning documents we analysed. Specifically, the Street Design Standards for Urban Ethiopia (122) and the Ethiopia Non-Motorised Transport Strategy 2020–2029 (135) include TOD as an urban growth strategy to support efficient, safe, environmentally friendly and equitable transport modes. In addition, planning for Bahir Dar has succeeded in establishing a well-connected street grid, providing a good basis for the adoption of further TOD policies. It seems possible that TOD planning will percolate to other national-level policies regarding urban growth, which would shore up the case for TOD in Ethiopian cities other than Addis Ababa. However, to date this does not appear to be the case. Although not specific to TOD, LDPs appear to be an established planning tool in the documents we encountered (121, 124). While LDPs do not focus on TOD, they are for exactly the correct scale for an individual TOD project—the neighbourhood or project scale. LDPs are quite complete in terms of covering various aspects of planning, including building controls, zoning, participation and implementation. As such, they could be a very appropriate planning tool to use for TODs in Ethiopian cities, including Bahir Dar. 10.10.2 Tanzania, Dar es Salaam and Mwanza Generally, the National Government of Tanzania creates policies and regulation for land development that localities must follow. The development policies discuss the need for adequate living conditions, new or upgraded housing, municipal infrastructure and services (128), preservation of rural land and planning mechanisms, including development schemes or upgrade programs (130). There is no mention of the necessity to foster compact cites and urban fabrics where development is supported by mass rapid transit. Those aspirations for compact growth are found in documents from Dar es Salaam and Mwanza. The regulation related to space, land use and buildings are said to be too prescriptive and not flexible to municipalities, which have a hard time delivering their development plans (128). For example, existing regulations are too stringent to apply in upgrading or regularisation of informal areas where plots are smaller than the national standard. Master plans for Dar es Salaam and Mwanza, while generally supportive of TOD, cannot take a full advantage of TOD potential because of stringent standards such as parking minimums, building height restrictions and FAR maximums. Another issue is a lack of national regulation for walking, cycling and public transport. While the policies support access, namely the Urban Planning Act (129) and the National Human Settlements Development Policy (128), the space standards do not highlight provisions for these modes. Policies and regulations to promote affordable housing are also lacking, although there is some mention of upgrading informal settlements. On the flip side, this process seems supported at the local level, albeit without sufficient funding. 97 BASELINE REPORT: HVT CITY RETROFIT FOR ALL There is also a general misalignment of roles and responsibilities of institutions fostering urban development. Planning authorities implement national building regulations, issue building permits and exercise development control within their jurisdiction. However, the national ministry issues regulation and mandates new planning schemes that the localities deliver. The local planning authorities (typically representatives of the municipal council) report to the President’s Office for Regional Administration and Local Government (PORALG), and therefore the municipal council does not have a full authority over municipal activities. Cities have come up with creative recommendations for institutional relations. For example, the Dar es Salaam Metropolitan Development Project—Appendix C Implementation Report (138) proposes the creation of a special transport and development planning authority and calls for having the city council report directly to the president. On the other hand, the Dar es Salaam City Master Plan 2016–2036 (131) proposes creation of a Metropolitan Planning Authority. In Mwanza, a special planning unit was proposed to facilitate implementation of the master plan. The goal of fostering TOD is generally absent from national-level policies. Since planning decisions are highly centralised at the national level in Tanzania, this may present a large challenge for municipalities seeking to undertake general or detailed planning schemes focussed on TOD. Both Dar es Salaam and Mwanza feature recent master plans, both focusing on TOD. In Dar es Salaam, the BRT corridor development project has its own suite of guidance documents endorsed but not yet approved by the President’s Office Regional Administration and local government. We did not find evidence that the Dar es Salaam City Master Plan 2016–2036 (131) is aligned with the Corridor Development Strategy. The land assembly methods that enable orderly development, namely land readjustment and tenure formalisation, are generally supported by the national government. The national government may also pursue land acquisition through fair compensation of landowners. Fair compensation and participation processes are strongly highlighted in the high-level land development policies. 10.10.3 General conclusions Both Ethiopian and Tanzanian cities present a set of unique dynamics in terms of their potential for inclusive TOD. Overall, we can say that the concept of TOD is much more present in planning documents from the capital cities (Addis Ababa and Dar es Salaam) than in the national-level documents or those that pertain to the secondary cities included here (Bahir Dar and Mwanza). The documents point to different degrees of centralisation in planning regulations. In Addis Ababa, the city administration has a high degree of autonomy in setting local planning regulations, while in Tanzania, key planning regulations are developed at the national level, and local plans require approval by officials at the national level. While policy and planning documents appear to provide planning tools that can support the creation of TOD in Ethiopia, in Tanzania, overly stringent policies may hamstring TOD. However, some planning tools of relevance to TOD appear to be stronger in Tanzania, including provisions for participation, land regularisation, tenure and land acquisition with fair compensation. The concept of TOD is embedded in the master plans of both Addis Ababa and Dar es Salaam. The former city has examined TOD in greater detail, with preliminary planning for one project completed (for TOD at LRT stations) and another in development (as evidenced by the TOR for a TOD consultancy). Although the project for TOD at LRT stations did not prosper, it may prove to be a foundation upon which to build future TOD initiatives. While the documents created for this project are quite sophisticated, it is worth pointing out that these were prepared by an international consulting firm (ARUP). As such, it is not clear to what degree this project created local capacity for TOD planning. In any case, these documents and those for the current TOD project do provide evidence that the concept of TOD has considerable traction in Addis Ababa. Providing affordable housing, a key aspect of inclusive TOD, appears to be a challenge in both countries. Policies and plans from both countries aim to minimise resettlement and prioritise improving existing informal or sub-standard housing, but we did not encounter documents that showed clear paths for this to happen. In fact, TOD documents from Addis Ababa favoured infill and greenfield development due to the economic advantages of these approaches. However, in Tanzania (Dar es Salaam and Mwanza), improving informal settlements is seen as a form of securing low-income housing. In Addis Ababa, the feasibility of using TOD to upgrade existing informal settlements appears to be an open question, while in Dar es Salaam and Mwanza, this was the preferred strategy in the policy and planning documents we analysed. 98 BASELINE REPORT: HVT CITY RETROFIT FOR ALL The ‘transit’ and pedestrian aspects of TOD are well supported by policy and planning documents in both countries. An existing LRT and planned BRT network in Addis Ababa, an existing BRT network in Dar es Salaam and a planned BRT system in Mwanza can provide the high-capacity PT needed to support TOD. Likewise, walking and cycling are firmly embedded in national- and municipal-level strategies and plans. An open question in both countries is paratransit: While informal PT dominates in both places, the role of informal operators in PT provision and TOD was not well covered in the documents we examined, with the exception of Mwanza, which includes plans to transform informal (dala dala) operators into a formal PT system. Finally, the inclusion of vulnerable groups in planning processes in the city varied across locales. While Ethiopia and Addis Ababa included language on women, the poor, different religious groups, elderly, children and disabled people, documents from Tanzania included gender inequalities, the elderly and disabled, and one from Dar es Salaam addressed vulnerable groups as a whole. We did not find language on different ethnic groups or sexualities. These might be important topics for future planning and policy documents. Ethnic groups may be of particular relevance for planning for equitable TOD in the region; for example, as the literature revealed, planning for the urban area of Addis Ababa breached the territorial divides between the Oromo, Tigrayans and Amhara ethnic groups, fuelling conflict (73). 10.10.3.1 Policy documents and the TOD Standard planning principles An interesting comparison for the policy documents we examined is the TOD Standard (154), a comprehensive tool that enables cities, decision-makers and practitioners to assess performance of built environment against a framework consisting of eight core principles. All principles—Walk, Cycle, Connect, Transit, Mix, Densify, Compact and Shift—when implemented together, support walkable, mixed-use and mixed-income neighbourhoods anchored around accessible transit, or what we define here as equitable TOD. National land-development policies in both study countries generally call for urban conditions that are very broadly in line with TOD objectives, such as adequate housing options accessible by quality roads and paths, supported by public infrastructure and services. However, these policies lack sufficient specificity to declare that they would, by themselves, lead to the creation of equitable TOD. Local policies, plans and regulation more closely reflected TOD planning objectives as outlined in the TOD Standard. In Tanzania, master plans for Dar es Salaam and Mwanza called for compact growth and densification along transit corridors and main trunk roads and emphasis on infill rather than greenfield development, an approach that is in line with TOD Standard objectives. The current master plan for Addis Ababa used a similar approach, but the TOD-specific documents associated with planning for TOD along the LRT line in that city favoured infill, and especially greenfield, development, as these are the most viable options in economic terms. Further, Mwanza uses 500 metres as a proxy for increased density along BRT corridors, a threshold of a walkable distance that is in line with TOD Standard. Both Tanzanian cities also put forward strategies that foster walkability, as does Addis Ababa. Increased pedestrian access, connectivity of pedestrian routes, frontage activity and permeability are especially highlighted in the urban design guidelines for Mwanza, and those are also core aspects of the TOD Standard framework. Capitalising on transit service to foster affordable housing was highlighted in the Mwanza City master plan, and protection and improvement of pre-existing informal communities as a form of affordable housing is a strategy for Dar es Salaam, also recognised by TOD Standard. As described in the previous section, the integration of affordable housing and improvement of informal settlements through TOD was not as clearly defined in Addis Ababa. However, it is worth noting that one document, the tender for TOD consultancy service in Addis Ababa (153), directly refers to the TOD Standard, and even includes the eight core principles outlined above as guidelines for consultants to follow. In conclusion, the national-level policies we examined were quite far from including the elements included in the TOD Standard, and municipal-level documents came much closer. One could argue that the elements for achieving equitable TOD are present in the policy documents but not necessarily bound together under the umbrella of equitable TOD. With the exception of one policy document (the above-mentioned tender), we cannot say that most documents we examined specifically outlined clear paths to achieving equitable TOD. 99 BASELINE REPORT: HVT CITY RETROFIT FOR ALL 10.10.4 Summary of policy and planning documents found and ranking of support for TOD The table below illustrates the relevant policies and official documents found on a given topic. Further, the findings are ranked based on the relevance to support TOD. Table 4: Policies and planning documents found and ranking of support for equitable TOD. Topic Policies and Planning Documents Found and Ranking of Support for Equitable TOD Ethiopia Addis Ababa Bahir Dar Tanzania Dar es Salaam Mwanza Urban Growth and Planning Urban Growth Strategy (121) ✔ (122) ✔ (123) ✔ (125) ✔ (126) ✔ _ (127) ✔ (128) ✔ (129) ✔ (130) ✔ (132) ✔ (133) ✔ (134) ✔ Urban Development Plans (124) ✔ (121) ✔ _ _ (128) ✔ (129) ✔ (130) ✔ (133) ✔ (134) ✔ Public Participation (121) ✔ (124) ✔ (135) ✔ (136) ✔ (137) ✔ (125) ✔ (126) ✔ _ (128) ✔ (129) ✔ (130) ✔ (138) ✔ (139) ✔ Transportation Planning Integration of Transport and Land Use _ (140) ✔ (125) ✔ _ (129) ✔ (128) ✔ (132) ✔ (133,138,141,1 42) ✔ (134) ✔ Public Transportation (121) ✔ (122) ✔ (124) ✔ (136,137,143) ✔ (144) ✔ (125) ✔ (145) ✔ _ (128) ✔ (129) ✔ (133,138,141,1 42) ✔ (146) ✔ Walking and Cycling (121) ✔ (122) ✔ (135) ✔ (136,137,143) ✔ (125) ✔ (126) ✔ _ (147) ✔ (133,138,141,1 42) ✔ (146) ✔ Regulatory Tools Land Use/Zoning (121) ✔ (124) ✔ (122) ✔ (135) ✔ (136,137,143) ✔ (150) ✔ (125) ✔ (126) ✔ _ (151) ✔ (131) ✔ (133,138,141,1 42) ✔ (134) ✔ (146) ✔ 100 BASELINE REPORT: HVT CITY RETROFIT FOR ALL Building Controls (121) ✔ (124) ✔ (135) ✔ (136) ✔ (137) ✔ (143) ✔ (150) ✔ (149) ✔ (125) ✔ (126) ✔ (145) ✔ _ (147) ✔ (128) ✔ (152) ✔ _ _ Parking _ (126) ✔ _ (147) ✔ (133,138,141,1 42) ✔ (146) ✔ Street Layouts (121) ✔ (122) ✔ (135) ✔ (136) ✔ (137) ✔ (150) ✔ (149) ✔ (144) ✔ (125) ✔ (126) ✔ (145) ✔ _ (129) ✔ (147) ✔ (132) ✔ (133) ✔ (146) ✔ Land Assembly Tools Land Expropriation (123) ✔ (124) ✔ (137) ✔ (125) ✔ _ (128) ✔ (132) ✔ (133,138,141,1 42) ✔ (134) ✔ Land Readjustment _ (125) ✔ (143) ✔ (145) ✔ _ (130) ✔ (138) ✔ _ Affordable/Low-Income Housing Affordable Housing Provision _ (125) ✔ (126) ✔ (136,137,143) ✔ _ _ (132) (133) (124) Improving Informal Settlements _ (124) ✔ (121) ✔ (125) ✔ (126) ✔ _ (131) ✔ (130) ✔ (128) ✔ (131) ✔ _ Land Tenure _ (136) ✔ (137) ✔ (145) ✔ _ (127) ✔ (128) ✔ (130) ✔ (131) ✔ _ Creating TOD 101 BASELINE REPORT: HVT CITY RETROFIT FOR ALL Goals for TOD (122) ✔ (125) ✔ (136,137,143) ✔ _ _ (131) ✔ (133) ✔ (134) ✔ (139,146) ✔ Implementation Strategy (121) ✔ (135) ✔ (125) ✔ (136,137) ✔ (143) ✔ (153) ✔ _ _ (132) ✔ _ Institutions Responsible for TOD (121) ✔ (126) ✔ (136,137,143) ✔ _ (130) ✔ (138) ✔ (146) ✔ Financing Land Value Capture _ (125) ✔ (153) ✔ (126) ✔ (136,137,143) ✔ _ (130) ✔ (138) ✔ _ Vulnerable Groups Women, Elderly, Children, Disabled, Ethnic and Religious Groups, the Poor (121) ✔ (122) ✔ (125) ✔ - (128) ✔ (127) ✔ (131) ✔ Symbol key: ✔ Indicates that the policy does not address the indicated topic either directly or indirectly. ✔ Indicates that the policy may broadly address the given topic, or it may indirectly imply it, as related to TOD. ✔ Indicates that the policy closely addresses the given topic, as related to TOD. 11. TOD Baseline Interviews As part of our effort to establish a baseline for TOD in the four sample cities, we conducted interviews with staff employed in various departments of municipal governments in the four sample cities. This section briefly outlines the methodology of the interviews, followed the interview results and concludes with an analysis of the interviews in the four cities. 11.1 Methodology We conducted four interviews in each of the primary cities (Dar es Salaam and Addis Ababa) and two in each of the secondary cities (Mwanza and Bahir Dar) for a total of 12 interviews. Study participants were senior and mid-level municipal employees. Participants were both a convenience sample (based on previous contacts with ITDP) and recruited with the snowball method (asking participants to recommend additional participants). To minimise the risk of any negative consequences for study participants, we do not include their names, employers or positions in this document. The interviews were open-ended and about 30 minutes long. To minimise the risk of COVID-19 transmission, the interviews were not conducted in person. Twelve interviews were conducted over the phone. Two participants from Addis Ababa sent their responses to the interview questions via email. This was done at the request of the participants because of the logistical difficulties of holding an interview over the phone. Three 102 BASELINE REPORT: HVT CITY RETROFIT FOR ALL interviews in Ethiopia were conducted in Amharic and later translated into English, the remaining interviews were conducted in English. We gathered the interviews in November and December 2020. The interview analysis employed the ‘lean coding’ approach described by Creswell (p. 184) (105). In this process, we: 1. Scanned the interview transcripts in their entirety, at least once and up to three times. 2. Created shorthand labels for thematic topics. For example, ‘creating TOD’ and ‘urban growth’. We started with the topics identified before the research began (outlined in the project proposal) and expanded as necessary. 3. Organised the content in a central spreadsheet. We then organised the topics identified above into three overarching topics with various sub-topics. 4. Summarised the interview data in the ‘results’ section. The results section also includes some background information to provide context for the participants’ statements. We clarified this supplemental information, not gathered in the interview, by adding it in footnotes. After presenting the results, we provide an analysis of the interview data. 11.2 Interview results This section presents the qualitative data gathered through the interviews in the four sample cities. We have grouped the results into three overarching topics: urban growth and informality, perceptions of TOD and tools for TOD creation. Each of these topics has multiple sub-topics. These topics and sub-topics emerged through our analysis of the interview data. 11.2.1 Urban growth and informality When asked about urban growth in their cities overall, many study participants immediately brought up topics related to informal human settlements. Study participants from Dar es Salaam emphasised rapid growth, especially alongside major infrastructure projects and specifically along road projects, including highways and district roads. This included clustered, nuclear settlements as well as linear development along roads. Participants from Dar es Salaam also noted the trend of residential areas changing to commercial uses. This change in use also included the building of ‘high-rise’ development in some places, and particularly in Central Business Districts (CBDs), due to the shortage of open land. Similar to participants from the other three cities we examined, participants from Dar es Salaam directly linked urban growth to informal human settlements. A participant mentioned that the growth of informal housing in the city is linked to lower cost of such housing. Another informed us that as formal, surveyed plots became increasingly scarce, informal settlement had been ‘growing at an alarming pace’. The municipal government and the Local Government Authorities (LGAs)11 were not meeting plot demand for the everincreasing population, according to this participant. Another participant noted that informal growth occurred along new roads in ‘peri-urban areas’ as well as in the urbanised areas that had changed from residential to commercial, as noted above. Another participant noted that growth in the peri-urban areas had ‘mushroomed’. Participants from Addis Ababa observed multiple dynamics related to informal settlements in that city, which are ‘increasing acutely’. One participant from Addis Ababa said that in the inner city, informality is characterised by illegal commercial spaces and inadequate slum housing, while on the outskirts, speculative residential developments are being constructed informally with the promise of future legalisation. This 11 Additional information not included in original interview transcript: There are six LGAs in Dar es Salaam—Dar es Salaam city council (an umbrella council), Kigamboni municipal council, Ilala municipal council, Temeke municipal council, Kinondoni municipal council and Ubungo municipal council. 103 BASELINE REPORT: HVT CITY RETROFIT FOR ALL participant also observed a recent intensification of informal development in environmentally sensitive places of the city: ‘Particular to the last three years the informal land-grabbing in green areas, river buffer, expansion, etc. spaces is much prominent’. Another participant from Addis Ababa observed two prominent growth trends, one informal and another formal. On the one hand, people are settling on the open spaces and then asking permission from the municipality to own the land informally, and on the other, the government is building large residential housing developments. Another participant from the same city estimated that over 75% of buildable land was already occupied. A participant from Bahir Dar emphasised growth on the outskirts of the city, in places like Abay Mado. This participant observed an increase in informal settlements in the city, as well as a trend of turning farmland on the edge of the city into residential land: ‘people tend to buy a plot of agricultural land from farmers and settle there’. Interestingly, a participant from Dar es Salaam pointed out the heterogeneity of informal settlements. Some informal settlements included a wide range of income groups, including low-, middle- and high-income residents: ‘Informal areas have brought people of all walks together’. A participant from Addis Ababa noted that there are several types of informal settlements in that city. This includes settlements on land claimed by squatters in less preferable and habitable locations such as mountains, riversides and quarries; informal settlements in structured neighbourhoods without legal rights (without registration and title deeds); and settlements with inadequate housing and infrastructure (slums). This participant said that future research and initiatives on informality should provide clear definitions of which types of informal settlements are being discussed. 11.2.1.1 Infrastructure In the context of urban growth and informality, study participants brought up basic urban infrastructure as an important issue to be addressed. For informal settlements in Mwanza, the largest challenge was the lack of infrastructure such as roads, electricity, water, proper sanitation and drainage. An additional challenge in that city was the risk of landslides and rockslides during the rainy seasons. Informal settlements in Dar es Salaam also lacked necessary infrastructure such as roads and sanitation. A participant from that city reported that about 40% of the residential areas in the city are informal settlements without properly laid out streets and with poor drainage systems that were prone to flooding during the rainy seasons. Another participant from Dar es Salaam observed that low-income residents often lived in informal, unplanned areas with deficient, or entirely lacking, basic infrastructure such as potable water and sewage systems, and with poor access to other parts of the city because of incomplete street networks. Because land is subdivided into smaller plots in such places, delivering hygiene and sanitation facilities is difficult. A participant from Dar es Salaam pointed out that because authorities had not been able to control informal development, the quality of the housing in these areas is not assured. Participants from Mwanza also emphasised rapid growth, characterised by increases in informal settlements. This growth was particularly intense in hilly areas around the city’s CBD. One participant from that city said the municipal administration was addressing this by formalising 56,000 plots annually. A participant from Bahir Dar said that infrastructure and utilities like electricity, water and sanitation are not formally provided to informal settlements, but residents in these places connect to these services informally from nearby services. 11.2.1.2 Displacement, relocation and compensation A participant from Dar es Salaam observed that displacement was an issue in that city, where low-income residents shifted to other areas as land appreciated in value. This was echoed by another participant from Dar es Salaam, who noted that in some areas where roads were improved and land use was changed, land value had increased, forcing low-income residents to move to other areas. Further, a major challenge for programs that sought to upgrade informal areas in Dar was lack of finances for compensation. 104 BASELINE REPORT: HVT CITY RETROFIT FOR ALL A participant from Addis Ababa pointed out that although a national proclamation favoured easy expropriation for the state, it also stipulated that the government must be sensitive to residents of preexisting settlements and consider on-site or nearby relocation or be compensated proportionally through calculated social–economic impacts imposed. Another participant from the city posited that housing programs worked well for people who were relocated, as they received the housing at no cost, but that it did not work well for people who had to pay to gain access to this housing. However, relocation also presented challenges related to social ties. A participant noted that the ‘dispersed relocation’ of residents of informal settlement into different areas of the city was challenging, as ‘the accustomed socio-economic tie is no more existent’. Another participant from Addis Ababa noted that although studies show that TODs reduce transport costs for their residents, land value in those places increases, creating economic hardships for low- and middle-income residents. 11.2.1.3 Corruption Some participants mentioned corruption in the context of informality and housing programs. According to one participant from Addis Ababa, the 10 sub-city administrations had the administrative ability to curb the growth of informal settlements but did not do so. These administrators ‘should have been in charge of people not to build on illegal places, but due to corruptions, we have seen so many informal settlements’. This was echoed by a participant from Bahir Dar, who said that corruption in the municipality had ‘allowed a lot of informal development in the city’. However, in the last year, the present mayor of the city had taken strict measures to avoid the growth of informal developments. A participant from Addis Ababa said that a previous municipal administration not only failed to contain informal settlements but actually encouraged their growth by providing infrastructure as a way to gain political patronage. Further, legalising informal plots was also a source of illicit income for some brokers and administrators at the sub-city level, who might lose their jobs if caught, but could ‘leave with a lot of money’. Another participant from Addis Ababa mentioned corruption related to government housing units, which use a lottery-based system to distribute units to residents. A participant from Bahir Dar mentioned similar problems, where housing programs were in place but were ‘abused by corruption’. 11.2.2 Perception of TOD For municipal government staff in the sample cities, participants reported varying degrees of knowledge of the concept of TOD. In Mwanza, a participant noted that planners viewed the concept of TOD as ‘acceptable and useful’. A participant in Dar es Salaam noted that the concept was ‘well known’ to most government officials. A participant from Addis Ababa noted that most experts engaged in urban and transport planning in that city ‘have a clear idea of the positive outcomes from the implementation of TODs’. However, for political appointees in higher roles, the concept was new. As such, creating TOD in Addis Ababa needs ‘boundless commitment’ from a broad spectrum of stakeholders. Another participant from that city said that most professionals at the plan commission do not have a clear understanding of TOD in general. Echoing this perception, another participant said that they thought most municipal staff were not well-informed about the concept of TOD, and that ‘only people who are working in the land use departments and building permits know it’. A participant from Bahir Dar said that TOD is a new planning concept for the city and that it was ‘not widely understood’ by engineers and planners in the city. Participants expressed optimism that TOD could bring a range of additional benefits to their cities. One participant from Addis Ababa said that TOD could have the ‘possibility of transforming the city’. A participant from Dar es Salaam said, ‘TOD has a potential to improve living standards’, and another said the concept could improve the city’s functionality and aesthetics, that there was ‘huge potential to transform our city through TOD implementation. TOD will beautify the city by bringing in proper and better harmonised land-use plans’. 105 BASELINE REPORT: HVT CITY RETROFIT FOR ALL Related to the issues of infrastructure for informal settlements, a participant from Addis Ababa viewed infrastructure provision as the largest challenge for creating TOD in that city: ‘The problem [for creating TOD] will be infrastructure provision like elevators, water and other to the large buildings’. One participant from Addis Ababa noted that the concept of TOD needed to be tailored and contextualised to fit the reality of existing socio-economic and landownership characteristics in that city. If that were achieved, TOD could play an important role in improving Addis Ababa: ‘[TOD] has to go in line with a good understanding of strategic planning as a city of limited economic resources. With enough attention and emphasis on its detailed execution methodologies, once backed with proper legal and organisational endorsements, I believe the TOD approach will play a meaningful role in guiding the urban transformation of the city’. 11.2.2.1 Compact growth and housing Several participants said planners in their cities viewed TOD as a way to reduce sprawl by creating more compact urban settlements. This was true in Dar es Salaam and in Mwanza. A participant from the latter city expressed this clearly: ‘The pace at which our city is growing forces the city authority to embrace TOD to curb urban sprawl. The demand for TOD is very high’. Another official from the same city posited that although the concept was new, planners viewed TOD as a way to ensure compact, mixed-use development. Participants from Addis Ababa also saw TOD as a way to promote compact development. One participant highlighted the potential to reduce ‘sparse and scattered development throughout the large city of Addis Ababa’ through TOD, while another specifically stated that the concept could promote density along PT corridors: ‘I see TOD as a tool to improve the transport corridor in the city; as an example, the city recommends the high-density development along BRT and LRT lines. We make sure the developers follow the regulations’. Another participant from the same city highlighted using the density created through TOD for residential development: ‘The [TOD] program, if implemented properly, could benefit from getting more density for housings’. This was echoed by another participant who was optimistic about the possibility of TOD helping provide housing in Addis Ababa: ‘If existing mass transit corridors and station areas are mainstreamed with the guidelines of the master plan of the city, I believe TOD will contribute in enhancing housing provision’. This sentiment was echoed by a participant from Bahir Dar, as well as by a participant from Dar es Salaam, who stated that TOD ‘has a potential to create housing for all’. A participant from Bahir Dar saw the potential of compact urban centres, TOD nodes with PT, with ‘high-rise and mixed developments, connected via arterial streets’. The same participant thought TOD could help create housing for low-income residents: ‘Yes, [TOD] can work well and include the informal settlements’. One participant from Addis Ababa emphasised public participation as the best way to meet the need of lowincome housing with TOD, saying this could be best achieved ‘through direct engagements of the low- and middle-income residents in the TOD-related projects’. 11.2.2.2 Reducing transport costs and travel time All participants from Dar es Salaam saw reductions in transport costs and travel times as one of the major advantages of TOD. According to one participant from that city, reducing travel costs and times through TOD would ‘contribute to national and individual economies’. A participant from Bahir Dar made the same point, explaining that an average government employee pays at least 25% of their salary for transport. Further, due to the horizontal expansion of the city, transport service provision had become a major challenge that TOD could help solve. Related to this, another participant from Dar es Salaam saw the potential of TOD to bolster the existing and planned BRT corridors; implementing TOD could activate these corridors and create ridership for the BRT. 106 BASELINE REPORT: HVT CITY RETROFIT FOR ALL Easing the burden on Dar es Salaam’s transport system was another advantage of TOD. This was reflected in a comment by a participant from Addis Ababa, who saw in TOD the potential to ‘alleviate the enormous challenges of transportation’ in that city. 11.2.3 ‘De facto’ TOD While the concept of TOD had been developed to varying degrees in the four sample cities, study participants posited that work had been done on urban development that, while not being explicitly identified as ‘TOD’, nevertheless contained elements of such urban development. We identify such development as ‘de facto’ TOD. In Dar es Salaam, new bus terminals containing markets, hotels, business centres and apartments had been developed. Although the intention to create TOD was ‘not clearly stated’, this was, in fact, what had been built, according to a participant from that city. Another participant from that city saw improvements to the road network and accompanying changes in land use as having contributed to TOD. Study participants from Addis Ababa noted that the latest master plan (the Addis Ababa Structural Plan) laid out urban growth based on concepts that were de facto TOD. As one participant from that city noted, ‘TOD is new for the city and myself, but the city master plan had put the land use that recommend high-rise development along the mass transport corridors’. This was echoed by the other participants from that city, who observed that the Structural Plan was, in fact, based on TOD concepts. A participant from Addis Ababa pointed out that building heights detailed in the plans were consistent with the TOD goal of creating dense places, that building heights in the plan ‘impact on creating compact, sustainable places’. Another participant noted that this had also occurred in recent LDPs created in Addis Ababa that were developed to be consistent with the Structural Plan, further promoting de facto TOD. Another participant from that city noted that de facto TOD was being created not only in the city’s master plan but also in practice: ‘There are no rules prepared only for TOD, but when we give permission to the developers, we use the regulations to make sure there are high-rise developments along the mass transport corridor’. A participant from Bahir Dar noted that the city’s new master plan, although not yet released, emphasises mixed-use development, development of the CBD and ‘node developments’. This participant said of urban centres in the plan, ‘we can consider them as a TOD or centre areas’. As such, this forthcoming plan may also present an example of de facto TOD. Another participant posited that similar to Addis Ababa’s Structural Plan, Bahir Dar’s forthcoming master plan will be an important step toward to creating TOD, if not in name, in practice: ‘There is no rules prepared only for TOD, but the land-use plan states and promotes the mixed-use development and having the mass transport lines’. Two participants said that some building blocks of TOD were in place in certain areas and projects, albeit with one crucial element missing: transit. A participant informed that recently built government-sponsored housing development in Dar es Salaam was compact and mixed-use but was lacking links to ‘well-established public transport’. These housing developments included a broad range of income groups, but most residents were middle- and low-income. Despite the lack of PT, according to a participant, these settlements ‘can be considered to be TOD-oriented’. A similar situation may soon exist in Bahir Dar, where a participant reported that the municipal government has plans for mixed-use development with residential units above commercial uses together with ‘axions’ or a ‘share company’. 12 These developments, however, are not well-connected to PT. 12 Additional information not included in original interview transcript: ‘Axions’ or ‘share companies’ refers to a situation whereby existing small shop owners form an association and get a long-term loan from the national bank. This arrangement is common for commercial mixed-use building development. 107 BASELINE REPORT: HVT CITY RETROFIT FOR ALL 11.2.4 Tools for TOD creation This topic comprises institutional, procedural, legal and physical elements brought up by the study participants that can be used for the creation of TOD. It includes the following sub-topics: institution and programs, policies and plans, land tenure, land assembly and streets and travel modes. 11.2.4.1 Institutions and programs Participants mentioned various institutions and programs that were related to urban development, housing and TOD creation in their respective cities. Table 5 below presents the results from the participants. After this table, we include any commentary participants provided about these programs and institutions. Table 5: Institutions and programs. Level of Governance Institutions and Programs Responsibilities (if Mentioned) Tanzania National Ministry of Lands, Housing and Human Settlements Development Issues policies and regulation, approves local plans and development schemes National President’s Office for Regional Administration and Local Government ‘Deals with urban development’ 13 Public Utility Institutions TANESCO — electric company DAWASA — water connection TARURA — rural and urban roads, parking management TANROADS — national roads, BRT infrastructure DART — BRT agency Dar es Salaam, Tanzania Local Local Government Authorities: Dar es Salaam City Council, Ilala Municipal Council, Kinondoni Municipal Council, Temeke Municipal Council, Kigamboni Municipal Council and Ubungo Municipal Council Execute schemes and facilitate adequate implementation of regulation and policies Sub-Local Lower village governments/mtaa Private Sector Engaged in the process of land surveying Mwanza, Tanzania Local Local Government Authorities: Mwanza City Council, Ilemela Municipal Council Manage land development, approve land assembly process Private Sector Engaged by the authorities to plan and survey plots in localities Ethiopia National Federal Housing Corporation Creates low-income housing through the Condominium Housing Program National Ministry of Urban Development and Construction 13 Additional information originally not included in the interview: Presumably the President’s Office Regional Administration and Local Government focussing on delivery of services to localities and coordinating rural and urban development: https://participedia.net/organization/1081 108 BASELINE REPORT: HVT CITY RETROFIT FOR ALL Addis Ababa, Ethiopia Local Infrastructure Integration and Building Permits Office Integrates infrastructure projects, issues building permissions and enforces housing requirements Local City Planning Commission Enforces land-use plan Local Land Management Office Manages land developments, including land provision for housing Local Addis Ababa Housing Construction Project Office Creates low-income housing through condominiums Local Kebele Administration Creates and manages low-income housing Local Integrated Housing Development program (10/90, 20/80 & 40/60) Provides a percentage of development for residential and commercial uses Bahir Dar, Ethiopia Local City Administration Provides land and allocates budget Local Kebele Administration Registers the poor and groups people in their jurisdiction Local Maheberat (associations of low-income residents formed by the municipality) Organize associations of low- and middleincome residents in order to receive government-built housing14 Local Yedeha Deha (unemployed/disabled) Provides housing for residents with very low or no income Local Urban Planning Institution Develops neighbourhood development plan, develops housing plans and allocates parcels and plots Local Bahir Dar Cadastre Office Facilitates land readjustments and blocklevel plans Generally the interviewees from Dar es Salaam and Mwanza tend to agree on the institutions responsible for implementing TOD. The participants distinguished national institutions that regulate and approve TOD projects, namely the Ministry of Lands, Housing and Human Settlements Development (MoLHHSD), which issues policies and regulations and approves local plans, and the local-level institutions, consisting of Local Government Authorities (LGAs) and City Councils, which are the local planning authorities that execute schemes and facilitate adequate implementation of regulation and policies. Additionally, one interviewee from Dar es Salaam pointed out that lower village/mtaa governments can also initiate certain planning and development processes such as land assembly initiatives.15 In Addis Ababa, a variety of institutions and policies related to TOD were described by interview participants. A participant from Addis Ababa emphasised the importance of kebele16 housing. The participant said that although this housing is of deficient quality, ‘they are still serving the citizen...they still serve large number of populations [sic]’. Another participant from the same city mentioned the Integrated Housing Development Program of the Addis Ababa Housing Development Project Office. The goal of this program is to integrate low-income with marketrate housing in various configurations 10/90, 20/80 and 40/60. The scheme numbering indicates the financing 14 Additional information not included in original interview transcript (responsibility of Maheberat). 15 Additional information not included in original interview transcript: Mtaa governments are the smallest administrative units of local governments. In urban settings, mtaa may include several blocks. 16 Additional information not included in original interview transcript: Kebele is the smallest unit of local government and refers to housing for low-income residents built during the Derg regime, which ruled Ethiopia from 1974‒1987. 109 BASELINE REPORT: HVT CITY RETROFIT FOR ALL ratio for each development. For example, under the 10/90 scheme, the recipient pays a 10% down payment while 90% of the cost of the flat is covered through a loan. This program was intended to replace the condominium housing scheme started in 2002. However, the program had a ‘questionable result in the overall success’. In addition, the government launched a bank-financed housing scheme where residents of the city will save for housing. Another participant from Addis Ababa confirmed the lack of success of the integrated housing program. This program was not well implemented and instead of residential units, lead to building for commercial uses: ‘In the building permit office there are rules for some of the cities buildings are obliged to build 60% of the mixed-use development for housing but they end up having 100% for commerce or office—this program was expected to serve the housing shortages’. The importance of the municipal administration in the enforcement of laws regarding land use in the creation of TOD and housing was emphasised by another participant from Addis Ababa: ‘TOD will be useful for the city administration to manage land properly, and the housing demand could be resolved if we properly allocate the building floors to housing [rather] than the other uses. In Addis Ababa, most developers don’t want to build housing; rather, they will focus on mixed-use and offices to rent and get more profit’. According to a participant from Addis Ababa, the Condominium Housing Program is effective and serves ‘a lot of residents’, although that program had its own issues; ‘the limitations are obvious to us, we know it has so many challenges’. One participant in Addis Ababa said that housing provided by the government was not actually affordable: ‘The housing provided by the government are not financially viable for the society; for example, the average government official’s salary is around 10,000 ETB but the cost for the condominium is around 700,000 for a studio type of house, so saving for the condominium is difficult’. A participant from Bahir Dar described a similar situation in that city: ‘The major issue is that the government plan for providing housing for low-income do not match with the resident’s income. The G+1 houses initial payment is around 130,000 ETB and small G+0 houses initial saving 40,000 ETB we can imagine how it will be [im]possible to be pay this for the low-income people’. Another participant from that city pointed that because much government housing is built on the periphery of the city, residents faced long distances to travel to the city centre. In Addis Ababa, participants noted the lack of institutions and programs related to informality. One said that the government had done little to address informal settlements ‘other than demolishing and redeveloping those areas’. Another participant from that city noted the dearth of institutions, policies and programs related to informal settlements; other than the national proclamation related to expropriation and compensation (Expropriation of Landholdings for Public Purpose and Payment of Compensation), there is ‘no evident urban development institution concerned with the informal settlement and low-income housing’. A participant from Addis Ababa said that the local government provides land for the associations or group of people who want to develop the ‘social housing’. The same participant suggested that NGOs could play a crucial role in the effort to implement TOD in the city. The participant suggested that ‘technical assistance from concerned NGOs and prioritizing areas with intensive feasibility study will make TOD practicable in the city’. According to a participant from Bahir Dar, the government of that city had experienced success in terms of incorporating residents with lower incomes into redevelopment schemes. One project successfully redeveloped an open-air market, including lower-income residents: ‘Bahir Dar city [has] an existing practice of incorporating the low-incomes—we have the city centre area marketplace where the government want to renew the informal market area, and it used to be huge open 110 BASELINE REPORT: HVT CITY RETROFIT FOR ALL market. The municipality [develops] a G+4 buildings and wants to incorporate the low-income groups and they succeed. Now the people who own shop in the city centre were low-income groups’.17 In Bahir Dar, there are two programs for low-income housing, according to a participant from that city. One program for employed residents with lower incomes assigns government-built units via a lottery, which residents then pay back on favourable terms. Another program helps residents with very low incomes, yedeha deha (unemployed/disabled), receive ‘mud houses, very low quality’ from the local governments. The program for condominium housing, however, ‘is not working the city anymore’. Another participant from the same city spoke of the local associations of low-income residents formed by the municipality called maheberat, whose mission is to provide housing. According to the same participant from Bahir Dar, the public sector largely determined the nature of urban growth in that city: ‘City life depends more on the government-related works than the service and commercial development’. 11.2.4.2 Policies and plans The participants from Mwanza Municipality mention the most recent Mwanza City Master Plan 2015–2035, while the participants from Dar es Salaam municipality agree that the main plan guiding growth and development is the Dar es Salaam Master Plan 2015–2035. Additionally, there are detailed local development plans, as in case of the Kigamboni District plan, as well as detailed town plan drawings. One interviewee from Mwanza mentioned ‘broader city master plan’. A participant from Addis Ababa said that the city’s master plan, the 2017 Structural Plan, was the ‘only meaningful plan’ in the city. According to this participant, a plan to implement TOD along the LRT network failed because it was not aligned with the 2017 plan. Another participant from the same city cited the Structural Plan, LDPs and ‘neighbourhood plans’ prepared by the Housing Development Agency of Addis Ababa for the provision of affordable housing as the most important plans for urban growth. Another participant also mentioned national proclamations related to urban planning and expropriation in relation to informal settlements. A participant from that city said that although LDPs were ‘useful’, they were often used to relocate groups of people living in informal areas in the city centre to the outskirts. Despite the existence of the regulations, policies, programs and plans mentioned above, a participant from Addis Ababa said that actors in the sphere of urban growth, including political and administrative authorities, find ways around them to further their own interest. According to this participant, legal frameworks are ‘full of loopholes’ that actors use to avoid regulations related to urban growth. Another participant from that city observed that urban growth and large infrastructure projects have not followed the city’s master plan. A participant from Bahir Dar described a similar situation, where previous master plans and legal tools had not had their desired effects: ‘The Bahir Dar city administration has a master plan that was planned 10 years ago and already expired’—in addition, there are different urban planning proclamations over the past years. Each of these plans and proclamations were not useful enough to the city’. 11.2.4.3 Land tenure The interviews from Tanzania confirm that both formal and customary land tenure systems occur in both Mwanza and Dar es Salaam. In the formal process, land can be granted a long-term lease of 33, 66 or 99 years to the landowner or a developer who seeks to develop it. In such cases, the lease owner has the rights to both the land and the property, secured by a certificate of occupancy. The informal system of land tenure, also called a customary tenure, is widely practiced, even though it does not guarantee security of landownership. In such a process, the land can be re-sold or transferred to different owners over time, yet, one can only be issued a temporary five-year residential license for the property, not for the occupied land and subject to renewal. Other sections of interviews give insight as to why this scheme 17 In this case, ‘G+4’ means a five-story building (ground floor plus four stories). 111 BASELINE REPORT: HVT CITY RETROFIT FOR ALL is so common: With fast population growth, the cities do not have enough capacity to perform land surveys quickly enough. Long-term land occupancy certificates can be issued to individual landholders or groups of landholders in informal areas when they agree to apply through a joint formalization process, as reported in one interview from Dar es Salaam. In this process, the group must submit for a planning consent from the Local Government Authority, which assists them with the land survey and drafting of a plan that is next submitted to the Ministry of Lands, Housing and Human Settlements Development (MoLHHSD) for approval. After the plan is successfully approved, the landowners are granted long-term occupancy certificates. Settlements that undergo upgradation must follow a process of land surveying and regularization of land tenure. In formal areas, there is a possibility for landowners to buy adjacent plots and apply for resurvey, in which case one occupancy certificate will be issued for the whole area (initially containing two or more plots). This process is also possible for two or more landowners who plan to join several plots with a purpose of joint investment. Participants from both Ethiopian cities (Addis Ababa and Bahir Dar) noted that there are two options for tenure. While all land in the country is owned by the state, options for tenure include ‘lease-holding’ and ‘free-holding’. While the first option allows for a 99-year lease, the second option is for informal tenure. However, a participant from Addis Ababa mentioned the existence of a process to go from free-holding to lease-holding. 11.2.4.4 Land assembly Land assembly process allowing amalgamation of land parcels for development was described by the participants as a common practice in both cities in Tanzania. Yet, as one interviewee from Mwanza indicated, land amalgamation is a new concept. All interviewees described the process of land assembly and institutions involved in it. First, landowners must submit their application to the LGA, which presents it for public hearing and then submits it to the city council and further to the MoLHHSD for approval. One interviewee from Dar es Salaam mentioned ‘lower village/mtaa government as the lowest unit of government that assists with the land assembly processes’. Participants stated that there was no legal process for land assembly in Addis Ababa and that the practice was not common there. In Bahir Dar, however, land assembly was underway as a part of urban renewal and upgrading projects laid out by the city’s land-use plan in the city master plan, according to a participant from that city. Another participant from the same city said that this practice was not common there. 11.2.4.5 Streets and travel modes Participants from Dar es Salaam and Mwanza said street typologies, dimensions for right of ways and layouts are defined in the town-planning schemes prepared by the municipality and approved by the MoLHHSD. In one interview, the respondent mentions the road specifications, including: arterial roads of 120 m in width, distinct roads (60 m), collector roads (30 m) and access roads (10 m). A participant from Addis Ababa highlighted the organic street pattern in that city, where streets were often created without a plan. This participant emphasised the need to realize the full potential of streets for community life, to ‘take streets as public spaces for social activities and economic means for residents’. There was room for improvement of street networks, which were characterised by missing links and a lack of alternative routes. Another participant from the same city underscored missing links in the street network, as well as the need to improve ‘small streets’. The same participant mentioned problems with congestion, as well as the need for better PT on the city’s streets. In the city, while major streets are laid out by the master plan, local streets can be defined by LDPs, according to another participant from Addis Ababa. This is also true in Bahir Dar, although in that city these plans are called ‘Neighbourhood Development Plans’, said a participant from the secondary city. A recent directive in Addis Ababa established the requirement to leave a 10-m minimum setback for high-volume PT (‘LRT and MRT lines’) on corridors slated to receive mass transit. A participant from Addis Ababa highlighted the need to improve streets, especially for pedestrians. In Bahir Dar, the city also seeks to improve streets for people walking and cycling. The new master plan includes ‘full consideration of the NMT transportation’ and seeks to consolidate the culture of these low-emissions modes, 112 BASELINE REPORT: HVT CITY RETROFIT FOR ALL said a participant. The same participant also emphasised re-establishing the city’s cycling culture by providing additional protection for these vulnerable users: ‘Cycling and walking are the major culture, and especially the cycling was a culture, but they didn’t operate well now, but due to the increase of the number of threewheelers, people are afraid’. Street networks in Bahir Dar’s older settlements follow illogical patters (streets ‘zigzag and are not properly aligned’) because street networks were designed around plots of land belonging to wealthy residents, according to a participant from that city. However, the municipality is currently remedying this situation by ‘designing and fixing the plots’. The same participant stated that newer settlements in the city are designed with well-laid-out street networks, but that there remain challenges with integrating infrastructure and road transport in those places. 11.3 Interview data analysis Participants described rapid urban growth in the four sample cities, characterised by a rapid increase in informal settlements. Much of this growth is occurring in city peripheries, creating issues for transport. In Dar es Salaam, informality had created places that brought different groups of income levels together. A participant from Addis Ababa suggested that future initiatives related to informal settlements recognise the wide heterogeneity of those types of places. The challenge of informality in these cities is enormous, and government actions are often problematic. In Addis Ababa, municipal administrations stimulated informal settlements through political patronage by providing infrastructure in exchange for support in elections. Government employees received payments for (illegally) legalizing informal growth. Participants from Addis Ababa and Bahir Dar said housing programs had their own issues, including lack of affordability and corruption. Participants from Addis Ababa described the relocation of residents of informal settlements to government-provided housing in other places as both favourable, because these residents received free housing, and problematic, because the relocation severed existing socio-economic ties. Displacement of low-income residents was common in Dar es Salaam, and a participant from Addis Ababa flagged displacement as an issue for future TOD in that city. Basic urban infrastructure and utility delivery was also crucial in the four sample cities. Participants emphasised the challenges of delivering water, sewage disposal and electricity to existing informal settlements and newly planned neighbourhoods, including future TOD projects. Some participants related this challenge to retrofitting existing settlements, or creating new ones, with suitable road networks. Although basic infrastructure delivery is costly, it is a requirement for liveable urban development and inclusive TOD. Participants described a range of existing institutions, programs and tools for urban growth, housing and infrastructure, and utility delivery at various levels of governance, from national to village governments. Municipal governments also had ongoing efforts to improve street networks and bolster walking and cycling. Participants reported initiatives to formalize land tenure to residents of informal settlements, and there was evidence of processes for land assembly in Dar es Salaam, Mwanza and Bahir Dar. While these institutions, programs and processes have issues, they represent ongoing structures and efforts relevant to solving the challenges of rapidly expanding cities with limited financial resources. The interview data also showed that in Tanzania, local leadership, financing and autonomy to regulate and lead projects is often constrained by overlapping jurisdiction with national authorities. Future efforts to bolster inclusive TOD should learn as much as possible about these institutions and programs and build on their strengths. Initiatives for inclusive TOD should consider them full stakeholders in planning, implementation and operation. Participants reported that familiarity with the concept of TOD varied considerably. While the concept is new for some people, particularly in Bahir Dar, the concept was generally well-known among government officials, especially in Dar es Salaam and Mwanza. Moreover, participants reported that the technical staff in Dar es Salaam, Mwanza and Addis Ababa city offices have considerable knowledge of the concept. Participants from all four sample cities displayed optimism that TOD could help improve urban development in myriad ways, including providing housing for residents with varied income levels and creating compact, mixed-use urban growth that reduces the need to travel long distances. A participant from Addis Ababa flagged infrastructure delivery as a major challenge to creating TOD, while a couple of participants from Dar 113 BASELINE REPORT: HVT CITY RETROFIT FOR ALL es Salaam claimed that roadblocks to implementing TOD were coming from the fact that a few individuals within government can oppose plans for TOD in fear of displacing vulnerable populations. In Dar es Salaam, Addis Ababa and Bahir Dar, participants emphasised the existence of projects, plans and development patterns that bring together TOD elements in practice but not in name, or ‘de facto’ TOD. Taken together, the favourable view of TOD held by the study participants, the familiarity with the concept by some government staff and the existence of de facto TOD could represent fertile ground for dissemination of the concept and the beginning of focussed efforts to implement TOD in the sample cities. These three factors (a favourable view of TOD, familiarity with TOD and ‘de facto’ TOD) represent an opportunity to increase familiarity with the concept for a broader base of stakeholders. As a participant from Addis Ababa pointed out, NGOs can play a key role in making TOD a viable option for urban development. One way to do this is for NGOs to use the existing knowledge of TOD, the presence of de facto TOD and previous and ongoing efforts related to the concept to increase stakeholder buy-in to build critical support for TOD projects and policies. This includes engagement with governments and local institutions. 114 BASELINE REPORT: HVT CITY RETROFIT FOR ALL SECTION 4: KEY TAKEAWAYS The following section details key takeaways from the baseline assessment. It appears that the existing assemblage of plans supports the many goals of and provides the tools for creating TOD, a key method for creating accessible, compact urban development and minimizing urban sprawl and its negative effects, which disproportionately fall on more vulnerable groups. While these cities may not have unified plans or strategies for TOD, the legal, planning and institutional elements needed to create TOD appear to be in place. The quantitative data show that there are opportunities for TOD growth in the four cities. In demographic terms, the fast (Addis Ababa and Bahir Dar) and vertiginous (Dar es Salaam and Mwanza) population growth was confirmed in the quantitative analysis as well as in the qualitative data (documents and interviews). There is an opportunity to manage this growth through inclusive TOD to improve liveability and equity. However, the rapid growth could also create particularly challenging conditions for planning authorities. Public resources may be strained in the effort to provide the institutional support, planning efforts and infrastructure needed to support TOD. TOD planning efforts must address the large number of residents living in informal settlements in both countries. The interview data described the enormous challenge of informality in the sample cities. Study participants highlighted the need to upgrade existing informal settlements, create new low-income housing and deliver basic infrastructure such as sanitation, water, electricity and street networks. Viewing the policy documents from this perspective, municipal governments may currently be under-equipped to deal effectively with this issue, pointing to the need for effective planning mechanisms and greater institutional capacity to address informal housing in TOD strategies. The policy documents, particularly at the city level and for the larger cities, also showed a good understanding of the multiple challenges that the cities face in terms of urban growth, housing, informality and transport— all elements that are critical to creating inclusive TOD. Further, solutions such as mixed land use, compact growth, compact development, transit-oriented zoning and improved walkability and bikeability appear to be firmly embedded in the cities’ planning approaches, including plans for a ‘car-free zone’ in Addis Ababa. The biggest exception was a focus in Dar es Salaam on the establishment of new satellite cities, which could exacerbate sprawl by extending the metropolis into peripheral areas beyond the reach of the city’s planned mass rapid transit network. The above finding was confirmed in the interviews, where participants identified de facto TOD in plans and projects in the four sample cities. Further, the study participants expressed a strong desire for compact urban growth and mixed-use zoning, also supporting the findings of the policy documents. The quantitative data showed that many of the most important elements of TOD, such as density and proximity to services, are already present in the target cities. The data also show opportunities for infill development within the existing urbanised area as well as opportunities for densification of existing urbanised areas. Some transport infrastructure favouring low-carbon modes (PT, walking and cycling) is in place in the four sample cities. The interview data revealed that cycling may have special potential in Bahir Dar, given the historical prominence of cycling there. High-capacity PT systems exist in two of the cities: an LRT system in Addis Ababa and a BRT in Dar es Salaam, with active plans to implement new BRT corridors in both cities. Anecdotally, however, there are many issues with the existing transport systems and infrastructure. Many streets lack footpaths entirely or footpath conditions are poor. The LRT in Addis Ababa has low frequencies, with a maximum of six trains per hour, leading many people on the LRT corridors to continue to use buses and informal transport. The BRT in Dar es Salaam experiences heavy crowding, and many urban residents in all four cities rely on buses and informal transport, which have well-documented issues with comfort, safety and reliability. To address some of these challenges, the DART agency has launched a tender with a new business model with better service-quality monitoring for BRT operations. The promise of shorter travel distances and reduced travel costs of TOD was highlighted in policy documents and confirmed in the interviews. Robust PT is an essential element of TOD, and while the cities appear to understand this in their policies, there likely remains much work to be done to achieve high-quality services. The quantitative data show that grade separated highways—a bane to liveability and low-carbon modes—are largely absent from the target cities, presenting perhaps a unique opportunity to create places structured around TOD. However, there are already roads in Addis Ababa with some aspects of grade separation, and 115 BASELINE REPORT: HVT CITY RETROFIT FOR ALL there is ongoing construction of flyovers in Dar es Salaam, indicating that the lack of highways may not last much longer. The choice to build freeways and flyovers now could impact the form of the cities for many decades to come. A dense street grid is a foundational element for TOD, and it can be extremely challenging to improve the street network once settlements, especially formal ones, have been established. The quantitative data showed that Addis Ababa and Bahir Dar have excellent mean block density, meaning that the structure for favourable pedestrian environments appears to be in place. However, the large percentage of urban population living in informal settlements may make the street network less stable, as housing redevelopment and formalisation may close off sections of the informal pedestrian network. Further, interview data from Addis Ababa spoke of the large challenge of ‘missing links’ in the street network in that city. The quantitative indicator for street networks was less favourable in Dar es Salaam and Mwanza, where the street grid is lacking, creating strong challenges to walkability and TOD. In addition, Tanzanian cities also have large percentages of their population living in informal settlements, so the existing street networks in these areas may also be unstable and subject to closures that reduce walkability. The Tanzanian situation appears to be particularly challenging for the development of TOD. While Dar es Salaam was excellent in terms of proximity to car-free spaces, all cities had planning documents that provide strong foundations for the creation of high-quality spaces for pedestrians, which could improve public space. A planning document for Addis Ababa (125) called specifically for the creation of a car-free space in the city centre. Additionally, the policy document showed a recognition, particularly at the city level, that excess parking was detrimental to development goals. The planning documents call for a reduction in parking requirements (Mwanza) and the establishment of parking maximums in TOD zones (Addis Ababa). Documents from Dar es Salaam, however, only include a vague call to ‘limit surface parking’. Despite this positive policy language, all cities currently mandate minimum parking requirements, leading to more car-oriented development. In terms of institutional structure, a major challenge is conflicting responsibilities for planning between city and national governments, particularly in Mwanza and Dar es Salaam, but potentially also in Bahir Dar. The Tanzanian cities are actively making plans, but they are subject to broad national-level regulations that restrict their options and sometimes make it unclear which entity is responsible. Another challenge for all four cities for TOD is institutional capacity—particularly for the secondary cities, whose municipalities are very dependent on the national governments. A planning document from Addis Ababa recognises the need to strengthen institutional capacity, a sign that there may be fertile ground for improvement in this area. Frequent staff turnover and a lack of organised data were cited in policy documents from Addis Ababa as key barriers to transferring knowledge to new practitioners. This likely reduces the ability of government staff to implement policy in the city. Addis Ababa is a large city with more resources than smaller cities, which likely have smaller budgets, fewer staff and even less capacity to effectively implement policy. The interview data from Addis Ababa, Bahir Dar and Dar es Salaam regarding corruption, particularly linked to informal settlements and housing programs, indicate the possibility of additional challenges to institutions involved in creating TOD. Finally, while the need for affordable/low-income housing was abundantly clear, the documents we examined did not provide definitive guidance on how this need would be fulfilled through TOD. Additional work would be needed to further define how affordable-housing provision can be used to create inclusive TOD. While documents highlighted the social advantages of retrofitting existing informal settlements (especially in Mwanza and Dar es Salaam), others, especially in Addis Ababa, noted that infill or greenfield development was a more financially viable option. Future TOD projects will have to strike a balance between these social and economic costs. Further, the interview data showed the enormous challenges that informal settlements present. Existing programs related to low-income housing did not come close to meeting the demand and were often problematic and led to the displacement of low-income residents. Despite these difficulties, several study participants expressed optimism that TOD could help meet the demand for housing in their cities. Generally, all cities in the sample appear to have many of the planning foundations required to enact TOD polices, and all cities have existing strengths on which to build (high population densities and often high block densities). All sample cities are growing rapidly, so there is great opportunity for policies to affect much of the 116 BASELINE REPORT: HVT CITY RETROFIT FOR ALL urban areas. However, there remain key challenges to successful implementation: Complicated or overlapping institutional structures, the rapid pace of urban growth and high levels of informality create significant challenges for implementing TOD-related policies. Given these conditions, one possibility for promoting TOD in this context is to create policies that are as simple as possible, building off existing strengths and minimising the capacity needed to implement. Such policies could target the most urgent and crucial needs of rapid urbanisation while postponing other aspects of TOD for future policy interventions. For example, establishing well-connected street networks can facilitate subsequent densification, utility upgrades and public transport service expansion. This could mirror a ‘sites and services’ approach, which has successfully provided housing for low-income groups in developing countries (152), but focused on more inner urban areas. The forthcoming analysis of case study policies—the second part of this research project—will help to improve our understanding of what kinds of policies might be most effective for achieving TOD in the context of rapid urban growth with limited economic resources. 117 BASELINE REPORT: HVT CITY RETROFIT FOR ALL Bibliography 1. Urban sprawl and climate change: A statistical exploration of cause and effect, with policy options for the EU. Land Use Policy. 2010 Apr 1;27(2):283–92. 2. Angel S. Making room for a planet of cities. 2011. 3. State of Knowledge Final Report on Urban Transport [Internet]. HVT. [cited 2020 Nov 20]. Available from: http://transport-links.com.w01c1b50.kasserver.com.w01c1b50.kasserver.com/download/final-report-high-volume-transport-urban-transporttheme-2/ 4. Planned City Extensions: Analysis of Historical Examples [Internet]. [cited 2018 Oct 5]. Available from: https://unhabitat.org/books/planned-city-extensions-analysis-of-historical-examples/ 5. Cervero R. Transit-Oriented Development’s Ridership Bonus: A Product of Self-Selection and Public Policies. Environment and Planning A. 2007 Sep;39(9):2068–85. 6. Thomas R, Pojani D, Lenferink S, Bertolini L, Stead D, van der Krabben E. Is transit-oriented development (TOD) an internationally transferable policy concept? Regional Studies. 2018;52(9):1201– 13. 7. Bertolini L, le Clercq F, Kapoen L. Sustainable accessibility: a conceptual framework to integrate transport and land use plan-making. Two test-applications in the Netherlands and a reflection on the way forward. Transport Policy. 2005 May;12(3):207–20. 8. Chava J, Newman P, Tiwari R. Gentrification in new-build and old-build transit-oriented developments: the case of Bengaluru. Urban Research & Practice. 2019 Jul 3;12(3):247–63. 9. Papa E, Bertolini L. Accessibility and transit-oriented development in European metropolitan areas. Journal of Transport Geography. 2015;47:70–83. 10. Jackson KT. Crabgrass frontier: The suburbanization of the United States. Oxford University Press; 1987. 11. Carlton I. Histories of transit-oriented development: perspectives on the development of the TOD concept. Working Paper; 2009. 12. Cappellano F, Spisto A. Transit Oriented Development & Social Equity: From Mixed Use to Mixed Framework [Internet]. Vol. 11, Advanced Engineering Forum. Trans Tech Publications Ltd; 2014 [cited 2021 Jan 12]. p. 314–22. Available from: https://www.scientific.net/AEF.11.314 13. United Nations. Drivers of Migration and Urbanization in Africa: Key Trends and Issues [Internet]. UN; 2018 Aug [cited 2020 Nov 8]. Report No.: UN/POP/EGM/2017/12. Available from: https://www.unilibrary.org/economic-and-social-development/sustainable-cities-human-mobility-and-internationalmigration_a11581d8-en 14. Lall SV, Henderson JV, Venables AJ. Africa’s Cities: Opening Doors to the World [Internet]. Washington, DC: World Bank; 2017 [cited 2020 Nov 9]. Available from: http://hdl.handle.net/10986/25896 15. United Nations, Department of Economic and Social Affairs, Population Division. World urbanization prospects: the 2018 revision. 2019. 16. UN Habitat. The Ethiopia Case of Condominium Housing: The Integrated Housing Development Programme. 2010. 118 BASELINE REPORT: HVT CITY RETROFIT FOR ALL 17. World Bank. PRIORITIES FOR ENDING EXTREME POVERTY AND PROMOTING SHARED PROSPERITY. 2016. 18. Lall SV, Henderson JV, Venables AJ. Africa’s cities: Opening doors to the world. The World Bank; 2017. 19. J. Gwaleba M. Urban Growth in Tanzania: Exploring Challenges, Opportunities and Management. IJSSS. 2018 Nov 20;6(12):47. 20. Kironde J. Good Governance, Efficiency and the Provision of Planned Land for Orderly Development in African Cities: The Case of the 20,000 Planned Land Plots Project in Dar es Salaam, Tanzania. Current Urban Studies. 2015 Jan 1;03:348–67. 21. Olvera LD, Plat D, Pochet P. Transportation conditions and access to services in a context of urban sprawl and deregulation. The case of Dar es Salaam. Transport Policy. 2003 Oct;10(4):287–98. 22. Worrall L, Colenbrander S, Palmer I, Makene F, Mushi D, Kida T, et al. BETTER URBAN GROWTH IN TANZANIA. :90. 23. TULab. Harnessing Urbanisation for Development: Roadmap for Tanzania’s Urban Development Policy [Internet]. Paper for the Coalition for Urban Transitions; 2019. Available from: http://newclimateeconomy.net/content/cities-working-papers 24. MLHSSD. Tz_Habitat III report.pdf [Internet]. MINISTRY OF LANDS, HOUSING AND HUMAN SETTLEMENTS DEVELOPMENT; 2015. Available from: https://uploads.habitat3.org/hb3/TanzaniaHABITAT-III-NATIONAL-REPORT.pdf 25. Norman AS, Massoi L. Decentralisation by devolution: Reflections on community involvement in planning process in Tanzania. ERR. 2010 Jun 30;5(6):314–22. 26. Preparation and implementation of a general planning scheme in Tanzania: Kahama strategic urban development planning framework. Habitat International. 2002 Jun 1;26(2):281–93. 27. Community involvement in land regularization for informal settlements in Tanzania: A strategy for enhancing security of tenure in residential neighborhoods. Habitat International. 2006 Dec 1;30(4):1066–81. 28. Urban management in developing countries. Cities. 1998 Dec 1;15(6):463–71. 29. Worrall L, Colenbrander S, Palmer I, Makene F, Mushi D, Kida T, et al. BETTER URBAN GROWTH IN TANZANIA. 2017;90. 30. Department for International Devlopment. Examining the Urban Land Nexus and Inclusive Urbanisation in Dar es Salaam, Mwanza, and Khartoum. 2020. 31. Urban_Land_Nexus_-_Synthesis_Report (1).pdf. 32. Ministry of Urban Development, Housing and Construction. The Urban Land Development and Management Policy and Strategy. 2013. 33. Ministry of Urban Development, Housing and Construction. Urban Housing Provision Strategic Framework. 2013. 34. World Bank Group. Ethiopia Urbanization Review : Urban Institutions for a Middle-Income Ethiopia [Internet]. 2015. Available from: https://openknowledge.worldbank.org/handle/10986/22979 119 BASELINE REPORT: HVT CITY RETROFIT FOR ALL 35. Terfa BK, Chen N, Liu D, Zhang X, Niyogi D. Urban Expansion in Ethiopia from 1987 to 2017: Characteristics, Spatial Patterns, and Driving Forces. Sustainability. 2019 May 24;11(10):2973. 36. Larsen L, Yeshitela K, Mulatu T, Seifu S, Desta H. The Impact of Rapid Urbanization and Public Housing Development on Urban Form and Density in Addis Ababa, Ethiopia. 2019;13. 37. MUDHCo. National Report on Housing & Sustainable Urban Development. 2014;75. 38. Bogale BD. The importance and challenges of low cost mobility modes for sustained socio economic and environmental development in cities in Africa. 2012. 39. Fitawok MB, Derudder B, Minale AS, Van Passel S, Adgo E, Nyssen J. Modeling the Impact of Urbanization on Land-Use Change in Bahir Dar City, Ethiopia: An Integrated Cellular Automata–Markov Chain Approach. Land. 2020 Apr 9;9(4):115. 40. Belete AW, Gezie WS. Assesment on Urban Density and Land Use Efficiency in the Ethiopian Cities. Civil and Environmental Research. 2017;9. 41. Wubie AM, de Vries WT, Alemie BK. A Socio-Spatial Analysis of Land Use Dynamics and Process of Land Intervention in the Peri-Urban Areas of Bahir Dar City. Land. 2020 Nov 15;9(11):445. 42. Porter G. Transport planning in sub-Saharan Africa II: putting gender into mobility and transport planning in Africa. Progress in Development Studies. 2008;8(3):281–9. 43. Porter G. ‘I think a woman who travels a lot is befriending other men and that’s why she travels’: mobility constraints and their implications for rural women and girls in sub-Saharan Africa. Gender, Place & Culture. 2011 Feb 1;18(1):65–81. 44. Porter G. Transport planning in sub-Saharan Africa. Progress in development studies. 2007;7(3):251–7. 45. Porter G. Living in a Walking World: Rural Mobility and Social Equity Issues in Sub-Saharan Africa. World Development. 2002 Feb 1;30(2):285–300. 46. Mitric S. Urban transport lending by the World Bank: The last decade. Research in Transportation Economics. 2013 Apr;40(1):19–33. 47. Venter CJ, Rickert TE, Maunder DAC. From Basic Rights to Full Access Elements of Current Accessibility Practice in Developing Countries. Transportation Research Record. 2003;1848(03):79–85. 48. Kumar A, Barrett F. Stuck in traffic: Urban transport in Africa. Africa Infrastructure Country Diagnostic (AICD) and the World Bank; 2008. 49. Jan A. Tz_Jan et al_2019.pdf. Harvard University Graduate School of Design; 2019. 50. Salon D, Gulyani S. Mobility , Poverty , and Gender : Travel ’ Choices ’ of Slum Residents in Nairobi , Kenya. Transport Reviews. 2010 Sep;30(No. 5):6451–657. 51. Gulyani S, Talukdar D. Inside Informality: The Links Between Poverty, Microenterprises, and Living Conditions in Nairobi’s Slums. World Development. 2010 Dec 1;38(12):1710–26. 52. Venter C. Transport expenditure and affordability: The cost of being mobile. Development Southern Africa. 2011 Mar;28(1):121–40. 53. World Bank. Tanzania Economic Update : Who Wants a Job? [Internet]. 2014. Available from: https://openknowledge.worldbank.org/handle/10986/18943 120 BASELINE REPORT: HVT CITY RETROFIT FOR ALL 54. Mkalawa CC, Haixiao P. Dar es Salaam city temporal growth and its influence on transportation. Urban, Planning and Transport Research. 2014 Jan;2(1):423–46. 55. Nallet C. The Challenge of Urban Mobility: A Case Study of Addis Ababa Light-rail, Ethiopia. :34. 56. UNICEF, editor. Cities and children: the challenge of urbanisation in Tanzania. Dar es Salaam, United Republic of Tanzania: UNICEF Tanzania; 2012. 95 p. 57. Mkalawa CC, Haixiao P. Dar es Salaam city temporal growth and its influence on transportation. Urban, Planning and Transport Research. 2014 Jan;2(1):423–46. 58. Bogale YA. Evaluating Transport Network Structure: Case Study in Addis Ababa, Ethiopia. :89. 59. Gebrehana BA. The Interactions between Land use change and Transportation Demand in Addis Ababa, Ethiopia (1988-2040). :17. 60. Meshesha, Fenta T. Demands for Urban Public Transportation in Addis Ababa. ITUP. 2014 Jul 25;81–8. 61. Koroso NH, Zevenbergen JA, Lengoiboni M. Urban land use efficiency in Ethiopia: An assessment of urban land use sustainability in Addis Ababa. Land Use Policy. 2020 Dec;99:105081. 62. Demdime FT. Integrating Public Transport Networks and Built Environment: :85. 63. Obeng-Odoom F, Ameyaw S. A new informal economy in Africa: The case of Ghana. African Journal of Science, Technology, Innovation and Development [Internet]. 2014 Nov 14 [cited 2020 Nov 17]; Available from: https://www.tandfonline.com/doi/abs/10.1080/20421338.2014.940172 64. Weheyaga S. Improving Addis Ababa Transport System by Using Transport Demand Management Strategy. :139. 65. Demdime FT. Integrating Public Transport Networks and Built Environment. 2012;85. 66. Peter LL, Yang Y. Urban planning historical review of master plans and the way towards a sustainable city: Dar es Salaam, Tanzania. Frontiers of Architectural Research. 2019 Sep 1;8(3):359–77. 67. Wolff SM, Kuch A, Chipman J. Urban land governance in Tanzania: Actors, processes, and local governance [Internet]. 2017 [cited 2020 Oct 10]. Available from: https://www.theigc.org/project/urban-land-governance-tanzania-actors-processes-local-governance/ 68. The regulatory framework, unplanned development and urban poverty: Findings from Dar es Salaam, Tanzania. Land Use Policy. 2006 Oct 1;23(4):460–72. 69. MLHHSD. Guidelines for the Preparation of General Planning Schemes and Detailed Schemes for New Areas, Urban Renewal and Regularization [Internet]. 2007 [cited 2020 Oct 10]. Available from: https://landportal.org/library/resources/guidelines-preparation-general-planning-schemes-anddetailed-schemes-new-areas 70. TULab. Harnessing Urbanisation for Development: Roadmap for Tanzania’s Urban Development Policy [Internet]. Paper for the Coalition for Urban Transitions; 2019. Available from: http://newclimateeconomy.net/content/cities-working-papers 71. Kironde JL. Improving land sector governance in Africa: the case of Tanzania. In: Proceedings of the Workshop on ‘Land Governance in support of the MDGs: Responding to New Challenges. 2009. p. 9– 10. 121 BASELINE REPORT: HVT CITY RETROFIT FOR ALL 72. Resnick D. Urban Governance and Service Delivery in African Cities: The Role of Politics and Policies. Development Policy Review. 2014;32(s1):s3–17. 73. Cartwright A, Palmer I, Taylor A, Pieterse E, Parnell S, Colenbrander S. Developing Prosperous and Inclusive Cities in Africa - National Urban Policies to the Rescue? :40. 74. Mitlin D, Colenbrander S, Satterthwaite D. Editorial: Finance for community-led local, city and national development. Environment and Urbanization. 2018 Apr 1;30(1):3–14. 75. Goodfellow T. Taxing the Urban Boom: Property Taxation and Land Leasing in Kigali and Addis Ababa [Internet]. Rochester, NY: Social Science Research Network; 2015 Jul [cited 2020 Oct 10]. Report No.: ID 2634036. Available from: https://papers.ssrn.com/abstract=2634036 76. Mahendra A, King R, Gray E, Hart M, Azeredo L, Betti L, et al. Urban Land Value Capture in São Paulo, Addis Ababa, and Hyderabad: Differing Interpretations, Equity Impacts, and Enabling Conditions. Lincoln Institute of Land Policy.; 2020. 77. World Bank. Stocktaking of the Housing Sector in Sub-Saharan Africa : Challenges and Opportunities [Internet]. 2015 [cited 2020 Oct 10]. Available from: https://openknowledge.worldbank.org/handle/10986/23358 78. Briggs J. The land formalisation process and the peri-urban zone of Dar es Salaam, Tanzania. Planning Theory and Practice. 2011;12(1):115–53. 79. Mitlin BC-B and D. ‘The devil is in the detail’: understanding how housing assets contribute to genderjust cities [Internet]. Gender, Asset Accumulation and Just Cities. Routledge; 2015 [cited 2020 Oct 10]. p. 129–46. Available from: https://www.taylorfrancis.com/ 80. Cotula L, Toulmin C, Hesse C. Land tenure and administration in Africa: Lessons of experience and emerging issues. International Institute for Environment and Development London; 2004. 81. Cirolia LR, Berrisford S. ‘Negotiated planning’: Diverse trajectories of implementation in Nairobi, Addis Ababa, and Harare. Habitat International. 2017 Jan 1;59:71–9. 82. The State of Planning in Africa, An Overview | UN-Habitat [Internet]. [cited 2020 Oct 10]. Available from: https://unhabitat.org/the-state-of-planning-in-africa-an-overview 83. Olvera L. Transportation conditions and access to services in a context of urban sprawl and deregulation. The case of Dar es Salaam. Transport Policy. 2003 Oct;10(4):287–98. 84. Andreasen MH, Møller-Jensen L. Access to the city: Mobility patterns, transport and accessibility in peripheral settlements of Dar es Salaam. Journal of Transport Geography. 2017 Jun 1;62:20–9. 85. Behrens R, Muchaka P, Ferro PS, Schalenkamp H, Zuidgeest M. Mobility and access in Sub-Saharan African Cities: The state of knowldge and research environments. Volvo research and Educational Foundation Workshop; 2015. 86. Carruthers R, Dick M, Saurkar A. Affordability of Public Transport in Developing Countries. 2005. 87. Cervero R. State Roles in Providing Affordable Mass Transport Services for Low-Income Residents. 2011 May 1 [cited 2018 Aug 30]; Available from: https://www.oecd-ilibrary.org/transport/state-roles-inproviding-affordable-mass-transport-services-for-low-income-residents_5kg9mq4f4627-en 88. Serebrisky T, Gómezâ€Lobo A, Estupiñán N, Muñozâ€Raskin R. Affordability and Subsidies in Public Urban Transport: What Do We Mean, What Can Be Done? Transport Reviews. 2009 Nov 1;29(6):715–39. 122 BASELINE REPORT: HVT CITY RETROFIT FOR ALL 89. Das a. K, Takahashi LM. Evolving Institutional Arrangements, Scaling Up, and Sustainability: Emerging Issues in Participatory Slum Upgrading in Ahmedabad, India. Journal of Planning Education and Research. 2009 Dec;29(2):213–32. 90. Satterthwaite D. Upgrading Slums: With and For Slum-Dwellers. 2010;xlv(10):12–6. 91. Renne JL. From transit-adjacent to transit-oriented development. Local Environment. 2009;14(1):1–15. 92. Vale DS. Transit-oriented development, integration of land use and transport, and pedestrian accessibility: Combining node-place model with pedestrian shed ratio to evaluate and classify station areas in Lisbon. Journal of Transport Geography. 2015;45(March 2016):70–80. 93. Arrington GB, Cervero R. Effects of TOD on housing, parking, and travel. Washington, D.C: Transportation Research Board; 2008. 58 p. (TCRP report). 94. Cervero R. Built environments and mode choice : toward a normative framework. 2002;7:265–84. 95. Guo JY, Chen C. The built environment and travel behavior: Making the connection. Transportation. 2007;34(5):529–33. 96. Calthorpe P. The next American metropolis: Ecology, community, and the American dream. Princeton architectural press; 1993. 97. Suzuki H, Cervero R, Luchi K. Transforming cities with transit: Transit and land-use integration for sustainable urban development. First. The World Bank, Washington DC; 2013. 233 p. 98. Saberi M, Wu H, Amoh-Gyimah R, Smith J, Arunachalam D. Measuring housing and transportation affordability: A case study of Melbourne, Australia. Journal of Transport Geography. 2017;65(May):134–46. 99. Cervero R, Dai D. BRT TOD : Leveraging transit oriented development with bus rapid transit investments. Transport Policy. 2014;36:127–38. 100. Chava J, Newman P. Stakeholder Deliberation on Developing Affordable Housing Strategies: Towards Inclusive and Sustainable Transit-Oriented Developments. Sustainability. 2016 Oct 13;8(10):1024. 101. Curtis C. Delivering the ‘D’ in transit-oriented development: Examining the town planning challenge. Journal of Transport and Land Use. 2012;5(3):83–99. 102. Carlson C. Financing Transit Oriented Development: Barriers in Four Geographic Contexts. 2009; 103. Suzuki H, Murakami J, Hong Y-H, Tamayose B. Financing Transit-Oriented Development with Land Values: Adapting land Value Capture in Developing Countries. Washington DC: World Bank; 2015. (Urban Development). 104. Joshi R, Narayanan P, Mennon A, Ramesh A, Godbole S. Local Area Plan for Transit: An illustrated handbook for Indian cities. 1st ed. CRDF, CEPT University; 2019. 105. Ardila-Gomez A, Ortegon-Sanchez A. Sustainable Urban Transport Financing from the Sidewalk to the Subway [Internet]. World Bank Studies; 2016. Available from: https://openknowledge.worldbank.org/handle/10986/23521 106. Schlossberg M, Brown N. Comparing transit-oriented development sites by walkability indicators. Transportation research record. 2004;1887(1):34–42. 123 BASELINE REPORT: HVT CITY RETROFIT FOR ALL 107. Hickman R, Hall P, Banister D. Planning more for sustainable mobility. Journal of Transport Geography. 2013 Dec 1;33:210–9. 108. Banister D. Viewpoint: Assessing the reality—Transport and land use planning to achieve sustainability. Journal of Transport and Land Use. 2012 Dec;5(3):1–14. 109. ITDP. Pedestrians First: Tools for a Walkable City [Internet]. 2020 [cited 2020 Nov 21]. Available from: https://pedestriansfirst.itdp.org/ 110. TOD Standard [Internet]. Institute for Transportation and Development Policy. 2017 [cited 2018 Oct 5]. Available from: https://doi.org/10.1016/S0197-3975(96)00059-8 111. Cervero R, Sarmiento OL, Jacoby E, Gomez LF, Neiman A. Influences of Built Environments on Walking and Cycling: Lessons from Bogotá. International Journal of Sustainable Transportation. 2009 Jun 23;3(4):203–26. 112. Grundy C, Steinbach R, Edwards P, Green J, Armstrong B, Wilkinson P. Effect of 20 mph traffic speed zones on road injuries in London, 1986-2006: controlled interrupted time series analysis. BMJ. 2009 Dec 10;339(dec10 3):b4469–b4469. 113. United Nations. Home .:. Sustainable Development Knowledge Platform [Internet]. Sustainable Development Goals. [cited 2019 Feb 1]. Available from: https://sustainabledevelopment.un.org/ 114. UN-Habitat. Metadata for Sustainable Development Goal Indicator 11.1.1 [Internet]. [cited 2020 Dec 23]. Available from: https://unstats.un.org/sdgs/metadata/files/Metadata-11-01-01.pdf 115. UN-Habitat. Metadata for Sustainable Development Goal Indicator 11.6.2 [Internet]. [cited 2020 Dec 23]. Available from: https://unstats.un.org/sdgs/metadata/files/Metadata-11-06-02.pdf 116. Global Human Settlement - Urban centres database 2018 overview - European Commission [Internet]. [cited 2020 Nov 17]. Available from: https://ghsl.jrc.ec.europa.eu/ucdb2018Overview.php 117. Gascon M, Triguero-Mas M, MartÃnez D, Dadvand P, Forns J, Plasència A, et al. Mental Health Benefits of Long-Term Exposure to Residential Green and Blue Spaces: A Systematic Review. International Journal of Environmental Research and Public Health. 2015 Apr;12(4):4354–79. 118. Florczyk A, Melchiorri M, Corbane C, Schiavina M, Pesaresi M, Panagiotis P, et al. Description of the GHS Urban Centre Database 2015. 2019. 119. Bowen GA. Document Analysis as a Qualitative Research Method. Qualitative Research Journal. 2009 Aug 3;9(2):27–40. 120. Creswell JW. Qualitative Inquiry and Research Design: Choosing Among Five Approaches. SAGE Publications; 2013. 473 p. 121. Ministry of Works and Urban Development. Local Development Plan Manual. 2006. 122. Ministry of Urban Development and Housing. Street Design Standards for Urban Ethiopia. 2017. 123. Federal Negarit Gazeta. Expropriation of Landholdings for Public Purposes and Payment of Compensation Proclamation. 455 Jul 15, 2005. 124. Federal Negarit Gazeta. A Proclamation to Provide for Urban Plans. 574 May 16, 2008. 125. Addis Ababa City Planning Project Office. Addis Ababa City Structure Plan Summary Report 2017-2027. 2017. 124 BASELINE REPORT: HVT CITY RETROFIT FOR ALL 126. Addis Ababa City Plan and Development Commission. Terms of Reference (TOR) for Transit-Oriented Development (TOD) Project. 2020. 127. Ministry of Lands, Housing and Human Settlements Development. National Land Policy.pdf. 1997. 128. Ministry of Lands, Housing and Human Settlements Development. National Human Settlements Development Policy.pdf. 2000. 129. Ministry of Lands, Housing and Human Settlements Development. Urban Planning Act, 2007.pdf. 2007. 130. Ministry of Lands, Housing and Human Settlements Development. Guidelines for Preparation of General Planning Schemes and Detailed Schemes for New Areas, Urban Renewal and Regularization.doc. 2007. 131. Ministry of Lands, Housing and Human Settlements Development. Dar es Salaam City Master Plan 2016-2036 vol. 2 Technical Supplements.pdf. 2018. 132. Ministry of Lands, Housing and Human Settlements Development. Dar es Salaam City Master Plan 2016-2036.pdf. 2018. 133. The President’s Office Regional Administration and Local Government. Dar es Salaam Metropolitan Development Project, Executive Summary.pdf. 2018. 134. Surbana Jurong. Mwanza City Master Plan: vol. 1 Master Plan.pdf. 2016. 135. Ministry of Transport. Ethiopia Non-Motorised Transport Strategy 2020‒2029. 2020. 136. ARUP, Ethiopian Railway Corporation, P3 Africa. TOD Framework Addis Ababa. 2015. 137. ARUP. TOD Addis Ababa Stage 4: TOD Concept and 3D (Master Plan). 2015. 138. The President’s Office Regional Administration and Local Government. Dar es Salaam Metropolitan Development Project, Appendix C.pdf. 2018. 139. Surbana Jurong. Mwanza City Master Plan: vol. 3 Urban Desin Guidelines.pdf. 2016. 140. Ministry of Transport. Transport Policy Of Addis Ababa [Internet]. 2011 [cited 2020 Nov 14]. Available from: https://chilot.me/wp-content/uploads/2011/08/transport-policy-of-addis-ababa.pdf 141. The President’s Office Regional Administration and Local Government. Dar es Salaam Metropolitan Development Project, Appendix A.pdf. 2018. 142. The President’s Office Regional Administration and Local Government. Dar es Salaam Metropolitan Development Project, Appendix B.pdf. 2018. 143. Ethiopian Railway Corporation, P3 Africa. TOD Addis Ababa Stage 6: Implementation Strategy. 2015. 144. Addis Ababa City Plan Commission. Street and Transport Network. Addis Negari Gazeta No 52 Page 1169. Addis Ababa City Administration; 2017. (Structure Plan Of Addis Ababa). 145. Addis Ababa City Plan Commission. Addis Ababa Plan Preparation, Monitoring and Implementing Agencies. 2020. 146. Surbana Jurong. Mwanza City Master Plan: vol. 4 Zoning Report.pdf. 2016. 147. Ministry of Lands, Housing and Human Settlements Development. Urban Planning (Planning Space Standards) Regulations, 2018.doc. 2018. 125 BASELINE REPORT: HVT CITY RETROFIT FOR ALL 148. Addis Ababa City Plan Commission. Addis Ababa Existing Land Use 2015. Addis Ababa City Administration; 2016. (Structure Plan Of Addis Ababa). 149. Addis Ababa City Planning Project Office. Land Use. Addis Negari Gazeta No 52 Page 1168. Addis Ababa City Administration; 2017. (Structure Plan of Addis Ababa). 150. Addis Ababa City Government Infrastructure development Coordination and Construction Permit and Control Authority. Architectural design reviewing Check list 1. 2017. 151. Ministry of Lands, Housing and Human Settlements Development. Urban Planning (Use Groups and Use Classes) Regulations, 2018.doc. 2018. 152. Ministry of Lands, Housing and Human Settlements Development. Urban Planning (Building) Regulations, 2018.docx. 2018. 153. Addis Ababa City Roads Authority. Request for Expressions of Interest (Consulting Services - Firms Selection). 2020. 154. Institute for Transportation and Development Policy. TOD Standard, 3rd Edition [Internet]. 2017 [cited 2020 Nov 19]. Available from: https://itdpdotorg.wpengine.com/wpcontent/uploads/2017/06/TOD_printable.pdf APPENDIX A: POLICY AND PLANNING DOCUMENTS Title Author Year Topic Brief description City/country Expropriation of Landholdings for Public Purposes and Payment Compensation Proclamation Federal Democratic Republic of Ethiopia 2005 Land expropriation The proclamation clearly states the power and responsibilities of the national and local governments. Ethiopia Local Development Plan Manual Ministry of Works and Urban Development 2006 Local Development Plans (LDPs) This manual standardises the process for developing LDPs. Ethiopia Urban Street Design Standard by MUDC Ministry of Urban Development and Construction 2017 National Urban street design standards The document is one of the three street design guidelines in the country. It contains a standard for how the different urban streets should be developed in the country. Currently ITDP and UN Habitat are working with the MUDC to create a harmonised street design guideline. Ethiopia Ethiopia NonMotorised Transport Strategy 2020–29 Ministry of Transport 2020 Walking and cycling National Strategy for NMT Ethiopia Transport Policy of Addis Ababa Ministry of Transport 2011 Transport Provides an overview of issues concerning transport in Addis Ababa and offers broad solutions. Addis Ababa TOD Framework for Addis Ababa Addis Ababa city Plan Commission (Prepared by ARUP) 2015 TOD framework for Addis Ababa The study was conducted by the Ethiopia railway corporation as part of the land value capture by developing 11 LRT stations. It was not approved by the city, because it was not aligned with the city master plan. Addis Ababa TOD Concept and 3D Illustration for Addis Ababa Ethiopian Railway Corporation and P3 Africa, ARUP 2015 TOD framework for Addis Ababa The study was conducted by the Ethiopia railway corporation as part of the land value capture by developing 10 LRT stations. It was not approved by the city, because it was not aligned with the city master plan Addis Ababa TOD Addis Ababa Stage 6: Ethiopian Railway Corporation and P3 Africa, ARUP 2015 TOD framework for Addis Ababa Provides in-depth financial plans for development of four (of the 11 stations Addis Ababa Implementation Strategy described in the above document) stations along the LRT network. Addis Ababa Existing Land Use 2015–16 Addis Ababa City Plan Commission 2017 Existing land use The existing land use are the surveyed in 2015 to identify the existing land use in the city. Addis Ababa Addis Ababa City Land Use Plan 2017 Addis Ababa City Plan Commission 2017 Land use planning This the working document with which the city develops the land. Addis Ababa Addis Ababa Building Permit Checklist Addis Ababa City Government Infrastructure Development Coordination and Construction Permit and Control Authority 2017 Officials’ architectural design review checklist form The checklist includes criteria for document, checking plan agreement and building permit application requirements. Addis Ababa Addis Ababa City Building Height Regulation 2017– 32 Addis Ababa City Plan Commission 2017 Building height regulation This regulation is the working document with which the city decides the limitation of floor height, FAR and setback Addis Ababa Addis Ababa City Road and Transport Plan 2017–32 Addis Ababa City Plan Commission 2017 Road and transport network plan The plan includes different hierarchies of street. If the municipality is implementing the mass transport plan, this includes BRT, LRT and other MRT. Addis Ababa Addis Ababa City Structure Plan Summary Report Addis Ababa City Plan Commission 2017 Addis Ababa city structure plan summary report This report includes: land use plan; street and mass transport network; building height; and development strategy for five and 10 years. Addis Ababa Tender for TOD Consultancy Service in Addis Ababa Addis Ababa City Road Authority 2020 Tender for the consultancy service to study a TOD in Addis Ababa Addis Ababa has posted a tender document under the World Bank Fund to hire a consultancy service in Addis Ababa to study a TOD urban design on selected four LRT stations. Addis Ababa TOR for TOD Consultancy Service in Addis Ababa Addis Ababa City Road Authority 2020 TOR for tender for the consultancy service to study a TOD in Addis Ababa Addis Ababa has posted a tender document under the World Bank Fund to hire a consultancy service in Addis Ababa to study a TOD urban design on selected four LRT stations. Addis Ababa Addis Ababa Plan Preparation, Monitoring and Implementing Agencies Addis Ababa Planning and Development Commission 2020 Institutions This table defines institutions and roles in urban planning processes Addis Ababa National Land Policy Ministry of Lands, Housing and Human Settlements Development 1997 Policies on land use and land tenure Promote and ensure a secure land tenure system to encourage optimal use of land resources; facilitate broad-based social and economic development of land. Tanzania National Human Settlements Policy Ministry of Lands, Housing and Human Settlements Development 2000 Policies, land use Promote development of human settlements that are sustainable and facilitate provision of adequate and affordable housing to all income groups in Tanzania Tanzania Guidelines for Preparation of General Planning Schemes and Detailed Schemes for New Areas, Urban Renewal and Regularization, August 2007 Ministry of Lands, Housing and Human Settlements Development 2007 Policies, land use Contains guidelines for the preparation and implementation of general planning schemes and detailed schemes for new areas, urban renewal and regularisation Tanzania Urban Planning Act, 2007 Ministry of Lands, Housing and Human Settlements Development 2007 Land use legislation in urban areas Fundamental principles of urban planning and land use planning. The Act provides for orderly and sustainable development of land in urban area, to: preserve and improve amenities; provide for the grant of consent to develop land and powers of control over the use of land; and to provide for other related matters. Tanzania The Urban Planning Act, The Urban Planning and Space Standards Regulations Ministry of Lands, Housing and Human Settlements Development 2011 Dimensions, coverage, land uses Defines dimensions, plot coverage, building lines and setbacks for a wide range of uses. Tanzania Tanzania Urban Planning (Planning space standards) Regulations Ministry of Lands, Housing and Human Settlements Development 2018 Building control rules, setbacks requirement Sets out standards for residential area building height, building line and setbacks, floor area, plot coverage and plot ratio Tanzania The Urban Planning (Zoning of Land Use) Regulations, 2018 Ministry of Lands, Housing and Human Settlements Development 2018 Zoning of land use Regulates zoning of land in different categories as follows: (i) residential (ii) commercial (retail and wholesale) (iii) industrial (light, medium, heavy and service) (iv) institutional (v) public utilities (vi) beach, open spaces and recreational (vii) transportation, communication and microwave towers (viii) agricultural (ix) water bodies (x) conservation (xi) economic development Tanzania The Urban Planning (Use Groups and Use Classes) Regulations, 2018 Ministry of Lands, Housing and Human Settlements Development 2018 Planning and control of development Regulates planning and the control of development, all uses of land and buildings categorised in the use groups and use classes. Tanzania Urban Planning (Building) Regulations, 2018 Ministry of Lands, Housing and Human Settlements Development 2018 Building control Sets out process and procedures to be followed to erect building on planned land. Tanzania Dar es Salaam Metropolitan Development Project: Executive Summary The President’s Office Regional Administration and Local Government 2018 TOD along BRT corridors Strategy document for TOD along BRT corridors in Dar es Salaam. The TOD guidelines which are part of the project ought to be a key teaching and operational aid for people working in development control in the corridor. Dar es Salaam Dar es Salaam Metropolitan Development Project: Appendix A Executive Summary The President’s Office Regional Administration and Local Government 2018 TOD on BRT Corridors Methodology of surveys used in study. Dar es Salaam Dar es Salaam Metropolitan Development Project: Appendix B The President’s Office Regional Administration and Local Government 2018 TOD on BRT Corridors Maps of urban development on BRT corridors for a wide range of topics Dar es Salaam Dar es Salaam Metropolitan Development Project: Appendix C Implementation Report The President’s Office Regional Administration and Local Government 2018 TOD on BRT Corridors Detailed strategy document for implementation of TOD on BRT corridors. Dar es Salaam Dar es Salaam City Master Plan Vol. 1 2016–2036 Dar es Salaam City master Plan 2016– 2036 Vol. 2: Technical Supplements Mwanza City Master Plan Vol. 1 Surbana Jurong 2016 Zoning, transport Land use and transport master plan for the period 2015–2035 Mwanza Mwanza City Master Plan Vol. 2: Technical supplements Mwanza Mwanza City Master Plan Vol. 3: Urban Design Guidelines Mwanza Mwanza City Master Plan Vol. 4: Zoning Plan Mwanza Mwanza City Master Plan Stages 5 & 6: Urban Design Guidelines and Implementation Plan Stakeholder Meeting 2016 Urban design guidelines Presentation slides for meeting that show broad guidelines for redevelopment (urban design and implementation plan) of Mwanza, with maps, renderings, flowcharts and organograms Mwanza APPENDIX B: RESEARCH PROTOCOL—LITERATURE REVIEW 1. Overview The topics of the literature review are: 1. Urban Development Characteristics in Africa —urbanisation trends at local, national and regional scale 2. Government capacity to implement urbanisation measures/institutional structures to support that capacity (in Africa) 3. Specific planning interventions to create inclusive, equitable TOD in LICs and MICs —assessment of results This literature review is a summary of previously published research on the above topics. This includes academic research papers and reports by organisations. It will NOT include primary data, such as a recently released master plan by an African municipality that prioritises TOD. If you do encounter such documents, they may be of interest to the project, so please make a note of them and save them to be shared with the Africa team, which is gathering such primary data (policy documents). However, these will not be included in the literature review section. The original DFID ‘State of Knowledge’ review will contain relevant information for this literature review. The search for this review was completed roughly two years ago—we should make sure to include any relevant research published since. Please ensure that the sources included in the review are approximately equally distributed in the focus areas outlined above. For example, if the review focuses on research on places outside Africa, it will be of limited use. If anything, the sources should be more weighted towards research on Africa. At this point, the researchers (you) are looking for literature to include in the review and populate the outlines. You are: 1. Looking in the original DFID ‘State of Knowledge’ review for relevant literature that we have already summarised. 2. Searching for peer-reviewed literature on Google Scholar (or other database of your choice, e.g., ScienceDirect) or Searching for ‘grey’ literature (more on these two types of literature below) on organisation websites using search terms or methods described in the spreadsheet below. 3. Checking to see if the PDF is readily available (some will be). 4. Looking on Google Scholar for PDF—some papers will have a link directly to a PDF on the right of the title. However, many of the papers will not have the links, and some links will direct you to research libraries that you may not have access to. 5. Adding the PDF (if you have it) to the Google Drive folder for this project. 6. Taking the most essential information from the literature and adding it to the spreadsheet. If you don’t have the PDF yet, we will get it for you. For journal articles (peer-reviewed literature), just add the author, year and title in the spreadsheet, and we should have it for you (in Zotero and on the Google Drive) shortly. If you have the PDF, please fill in the spreadsheet. 5. (To be discussed with your team leader) You may add the most salient points of the literature to the relevant section of the draft outline. Please note that we do not need a specific number of citations for this review. This review should be thorough, but it does not need to be exhaustive. This is not for a review paper; rather it is a foundation for our research. 2. Peer-reviewed vs. ‘grey’ literature This review will provide the basis for a paper to be submitted to a peer-reviewed journal. A version of this review will also be included in that paper. This means that the paper (including the review section) will be analysed by experts (probably all academics) in the field and thoroughly checked for logic and rigor in research. For a peer-reviewed journal, literature from other peer-reviewed sources is most important. As such, please prioritise peer-reviewed research in this literature review. What is the difference between peer-reviewed and ‘grey’ literature? Peer-review is everything that comes from a scientific journal (for example, Transport Policy, Transportation Research Part A, International Journal of Sustainable Transportation, Transportation Research Record, Review of Policy Research, Journal of Empirical Legal Studies). Anything that is not published in a scientific journal, including books and book chapters, is ‘grey literature’. This will include all reports by organisations like the World Bank, WRI, ITDP and even university centres if they are not published in a journal. It also includes books, book chapters and manuals, such as ITDP’s TOD Standard. How can you tell if a paper is peer-reviewed? The easiest way is to make sure it was published in a reputable journal. First, check to see if the paper was in fact published in a journal. If you still can’t tell if it’s published by a reputable journal, check to see who the journal is published by. Most journals are published by five academic publishers: Elsevier, Springer, Wiley, Taylor & Francis and Sage. Further, you can look at the journal website, e.g., this is the one for Transport Policy. The journal is published by Elsevier, it says it is an ‘international refereed journal’ (refereed = peerreviewed). You can see the name of the editor, and it looks like a legitimate journal (and it is). Note: Some literature will appear in journals not published by the big five named above, especially from developing countries. For example, this paper: If you think we should include it, feel free to add it to the spreadsheet. Spreadsheet Columns—Descriptions Fig. 30 Sources tracker. Column title Description A Input by Whoever enters the information B Date of Input Date information was entered C PDF in Google Drive? ‘Y’ (yes) or ‘N’ (no) D Citation in Zotero? If it is in Zotero, ‘Y’, if not, ‘N’. This will let the Zotero manager know if the literature needs to be entered into Zotero or not. E Outline Section Where you think the paper belongs in the outline for the lit review? Please refer to the draft outline for the lit review created by your team leader. Remember that this outline is subject to change. F Search Term/Method Add the keyword or search method that you used to find the paper. Examples of possible searches include ‘transportation land use’ or ‘increase public transportation’. You may find many relevant sources in the ‘State of Knowledge’ (SoK) review conducted by ITDP for DFID in 2018. However, if you use these sources, you may want to use a method like ‘forward snowball’ (described in greater detail below) to ensure that you are not missing any more recent, relevant research. You will find much peer-reviewed literature through Google Scholar (or other database) searches. For the grey literature, you can search organisations’ websites and in particular their libraries. For example, for the World Bank, this is the ‘research and publications‘ webpage (more on this below). You will add the webpage where you found the grey literature in a later column. A list of possible organisations is included in the next section of this protocol. Other search methods include: Forward snowball: When you find a reference by seeing who cited a paper. You can do this by clicking on ‘cited by’ in Google Scholar; Backward snowball: When you find a reference in a paper, usually in the ‘references’ or ‘works cited’ section at the end of the paper. For example, perhaps you are reviewing the following paper: Redman, L., Friman, M., Gärling, T., & Hartig, T. (2013). Quality attributes of public transport that attract car users: A research review. Transport Policy, 25, 119–127. And you notice that Redman et al. cite this paper: Hensher, D.A., Mulley, C., Yahja, N., 2010. Passenger experience with quality-enhanced bus service: The Tyne and Wear ‘Superoute’ services. Transportation 37 (2), 239–256. You may wish to investigate the above paper by Hensher et al. to include it in this review (backward snowballing). G Where Found For many documents, this will be a Google Scholar search, in which case put ‘GS’ in the cell. You might find other documents, and especially grey literature, on organisation websites—in their digital libraries, for example: http://www.worldbank.org/en/research Some documents may come from the previous ‘State of Knowledge’ (SoK) review ITDP completed for DFID. If so, enter ‘DFID SoK’ here. This column ensures rigorous documentation of our searches. H URL This is for GREY LITERATURE. Add the exact web address of the document here, e.g.: https://unhabitat.org/planning-and-design-for-sustainableurban-mobility-global-report-on-human-settlements-2013/ This helps our Zotero manager to find the document quickly. I Topic The general topic that this literature addresses according to your section’s outline. J Author The literature’s author K Year The year the literature was published. L Title The title of the literature. M Geography The place that the literature studies or where the data came from. If the data came from many places, make a general statement about where the data came sources came from, e.g.: ‘Santander, Spain’ or if review: ‘Many (review), focus on Europe and North America’ N Peer-Review (PR) or Grey Lit (GL) PR or GL (see description above) O Type of Study/Report Types of scientific research studies are described in greater detail below. Types of ‘grey literature’ studies include reports, white papers and manuals. P Data sources This is where the data (qualitative or quantitative) came from. Possible sources include a national census, a survey, interviews and previously published literature. QR Key Impacts— Access, Environment, Efficiency, Health, Safety, Equity The DFID TOD research project aims to achieve impacts in these key areas: â— Improved access to opportunities and services â— Reduced environmental impact from transport â— More efficient use of resources from transport and land use â— Improved health outcomes from transport â— Improved safety from traffic crashes â— More equitable land use and transport decisions For more information, please see the Logical Framework for this project. As such, this literature review should note how the research in the sources is related to any of these six key impacts. For example, perhaps a study found that informal settlement upgrading along a BRT line increased access to jobs for many residents but made the settlement less affordable for the lowest-income residents. This should be reported in the ACCESS and EQUITY columns. W Main Takeaway for Review (1‒2 ideas separated by semicolon) Summarise VERY BRIEFLY the most salient point(s) of this study. E.g.: ‘Reliability and frequency are the most important quality attributes to attract car users to public transportation’. Or (with semicolon): ‘Reliability and frequency are the most important quality attributes to attract car users to public transportation; reduced-fare promotions can encourage car users to try public transportation’. Note: This is mainly to help your team structure the writing process for the review, so please be brief. X Notes (separate different ideas by semicolon) OPTIONAL—Briefly note anything else about the paper here. Here you may put things that you did not have room to include in the ‘Main Takeaways’. Y Case Studies OPTIONAL—If the literature contains any very relevant cases (e.g., BRT in Ahmedabad), please note them here. Z Quotes OPTIONAL—You can put quotes from the paper here if there are any that strike you as very relevant. Please include page numbers, e.g.: ‘… the shorter the uninterrupted length of roadway, the slower traffic will travel and the less severe crashes will be’. p. 354 V… OPTIONAL—Feel free to add subsequent columns that the research team can use to organise the work. However, please consult with your team leader before adding a column. Types of Research Studies Please see common types of studies in the table below. There are many other types, and there can be combinations of these categories; however, most of the studies you will encounter will fall into one of these categories. Fig. 30: Types of research studies. Type Description Example Quantitative Uses quantitative data—often from secondary sources, such as a census or data—on public transportation ridership. RodrÃguez, D. A., & Mojica, C. H. (2009). Capitalisation of BRT network expansions effects into prices of nonexpansion areas. Transportation Research Part A: Policy and Practice, 43(5), 560–571. Qualitative Uses data from qualitative sources, such as interviews and focus groups. Carreira, R., PatrÃcio, L., Jorge, R. N., Magee, C., & Hommes, Q. V. E. (2013). Towards a holistic approach to the travel experience: A qualitative study of bus transportation. Transport Policy, 25, 233–243. Review A survey of previously published literature. Reviews are also qualitative studies. Farahani, R. Z., Miandoabchi, E., Szeto, W. Y., & Rashidi, H. (2013). A review of urban transportation network design problems. European Journal of Operational Research, 229(2), 281–302. Metaanalysis Uses previously published quantitative studies to arrive at overall effects, often expressed as elasticities. For example, Ewing and Cervero find an elasticity of .39 for intersection density and walking, suggesting that for each unit increase in Ewing, R., & Cervero, R. (2010). Travel and the built environment: a metaanalysis. Journal of the American Planning Association, 76(3), 265–294. intersection density (for example, number of intersections per square kilometre), there is an increase in walking of about 40%. Mixed Methods Uses both quantitative and qualitative data. Heesch, K. C., Sahlqvist, S., & Garrard, J. (2012). Gender differences in recreational and transport cycling: a cross-sectional mixed-methods comparison of cycling patterns, motivators and constraints. International Journal of Behavioral Nutrition and Physical Activity, 9(1), 106 Case Study Looks at one or multiple examples in detail and uses data from several sources. Often studies cities, programs or initiatives. Can be single-case study (for example, about London) or examine multiple cases (for example, Delhi and Ahmedabad). Rizvi, A., & Sclar, E. (2014). Implementing bus rapid transit: A tale of two Indian cities. Research in Transportation Economics, 48, 194– 204. Sources of Grey Literature Much of the most relevant grey literature will not appear in Google Scholar searches. Therefore, we will conduct keyword searches on websites of leading organisations and databases in the field of urban development and transportation. These organisations include international and national development agencies, civil society organisations and private companies. Examples of organisation websites and databases to search include (the list below is not exhaustive and does not include many organisations that may be working on TOD; feel free to search for additional organisations): ï‚· World Bank ï‚· Inter-American Development Bank ï‚· Asian Development Bank ï‚· African Development Bank ï‚· CAF (Latin American Development Bank) ï‚· GIZ (German Technical Assistance) ï‚· ELTIS ï‚· European Union ï‚· United Nations ï‚· UN-Habitat ï‚· UNDP ï‚· WHO ï‚· Lincoln Land Institute ï‚· NACTO ï‚· Veolia ï‚· ARUP ï‚· McKinsey ï‚· C-40 ï‚· ITDP ï‚· WRI ï‚· ITF ï‚· UITP ï‚· Bloomberg Foundation ï‚· Bloomberg Cities ï‚· Rockefeller Foundation ï‚· DFID growth & Resilience ï‚· SSATP Please remember to note the organisation and database website where you found the research in the ‘Where Found’ column in the spreadsheet. APPENDIX C: RESEARCH PROTOCOL—POLICY AND PLANNING DOCUMENTS 1. Project overview: The purpose of this project is to identify opportunities for inclusive, equitable TOD development in Tanzania and Ethiopia. As part of that research, the Africa team will be gathering policy and planning documents for analysis. These documents may come from these geographies/administrative entities: ï‚· National (Tanzania and Ethiopia) ï‚· Region/State/Province/District (if relevant) ï‚· Municipal (Addis Ababa, Bahir Dar/Dar es Salaam, Mwanza). The above list may not include relevant geography/administrative entity or other relevant bodies; feel free to include them as needed. The documents will include policies, regulations and institutional characteristics regarding: 1. Urban growth 2. Creating TOD 3. Improving Informal settlements 3.A. Land readjustment 3.B. Urban land tenure 3.C. Regulations for street layouts 3.D. Regulations for building controls The topics noted above were included in the proposal for this project, so the search for documents must cover all of these topics. Researchers should gather all relevant documents prior to beginning their analysis. Researchers will deposit digital copies of these documents in this folder. Spreadsheets 1.1 Required Topics to Research To aid you in making sure that all of these topics have been researched for all relevant geographies, please use this spreadsheet. We anticipate that you may not find relevant documents for many of these topics, but we want to make sure that we have at least looked for all relevant documents. If you do find relevant documents, please enter the document title and year of publication. If you do not find any relevant material, please be sure to note that in the spreadsheet’s cells by entering NA. Please note that you may modify the ‘geography’ columns of this spreadsheet to meet the needs of the research team. For example, other possible geographies include metropolitan regions or districts. 1.2 Documents This is where you will add the information on the documents. 1.3 Spreadsheet Columns—Descriptions Fig. 31: Content search entries. Column Title Description A Input by Whoever enters the information B Date of Input Date information was entered C Author Enter the author. Documents may have institutional authors (e.g., Dares Salaam City Council). D Institution Enter the Institution the author is affiliated with. For institutional authors, this may repeat the information in column C. E Year The year the document was published. If the document does not have a date, add ‘n.d’. (no date). If the document does not have a date but you have an idea of when it was published, you may add a year and ‘approximate date’ afterward, e.g., ‘2016, approximate date’. F Title The title of the document G Topic The topic of the document. You may use the topics outlined above (also in the ‘required topics to research’ spreadsheet), and you may also create new (related) topics. H Geography This is the geography/administrative boundary that the document is related to. For example, the document could be national, regional or municipal. Other possible geographies include metropolitan regions or districts. I How Found How you found the document. You may have found it on an internal ITDP database, by a web search using a search engine or by searching on the webpage of an institution (please note the kind of web search). You may have received the document from a colleague or gathered it via another means (please specify). J Search Term If you did a web search, please enter the search term you used here. K URL Enter the web address of the document. L Brief Description Provide a brief overview of the documents’ contents. M Most Relevant information Briefly summarise the most relevant information contained in the document to the goal of creating inclusive, equitable TOD. NS Key Impacts—Access, Environment, Efficiency, Health, Safety, Equity The DFID TOD research project aims to achieve impacts in these key areas: â— Improved access to opportunities and services â— Reduced environmental impact from transport â— More efficient use of resources from transport and land use â— Improved health outcomes from transport â— Improved safety from traffic crashes â— More equitable land use and transport decisions For more information, please see the Logical Framework for this project. As such, this literature review should note how the research in the sources is related to any of these six key impacts. For example, perhaps a policy document on upgrading settlements provides guidance for upgrading settlements near public transportation corridors, thereby improving access to jobs for residents. You could note this in the ACCESS column. Risk Minimisation As with all phases of this project, as researchers we must do our utmost to ensure the safety and professional standing of people involved in the study. The research conducted for this activity does not directly involve human subjects and as such there little risk involved for researchers or other people involved in this phase of the project (document gathering and analysis). A potential risk could be if a colleague outside of ITDP or associated consultants (for example, someone who works in a municipal government) shares a document that is not considered public and then faces possible negative consequences for sharing that document. As researchers we must ensure that any such risk is minimised. As such, do your best to ensure that any documents gathered from colleagues outside ITDP and associated consultants can be used publicly, and that no colleagues outside ITDP will face any economic, legal, physical, psychological or social risks as a consequence of sharing documents with ITDP for this research.