
Overview
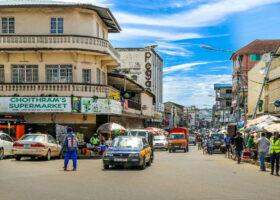
Armed with the know-how, lessons learnt, challenges, and successes of already implemented Tactical Transit Lanes (TTLs) across a spectrum of cities, this study considers the current provision of public transport in low-income cities in Sub-Saharan Africa, the impact of the COVID-19 pandemic on transport, and the potential benefits of TTLs on high-volume transport routes in terms of adding capacity to the city’s public transport provision and other consequential benefits. It was also important to investigate and show that proposals could be positioned as part of a long-term strategy and be tractable and scalable.
By using existing public transport data and the application of an assessment matrix, the study shows that significant benefits could accrue to case cities from the implementation of TTLs on the sections of the public transport network investigated, in terms of person throughput and in terms of time savings for workers and for operators (thus fuel and costs). The implementation of high-volume priority transport routes during the COVID-19 pandemic would therefore result in increased public transport services which would enable safer, more efficient, and more ‘carcompetitive’ public transport travel and have value beyond the immediate response to COVID-19. The scope of the technique proposed could also be broadened and applied in neighbouring areas as similar benefits could be accrued.
Publications with the same themes

Publications with the same study countries


Related news & events

News

Blog
Blog
News

News
News

Blog

News

Blog
PDF content (text-only)
COVID-19 Response & Recovery Transport Research Fund FINAL REPORT: Fast-tracking public transport priority: Investigating the potential of Tactical Transit Lanes in mitigating the impact of COVID-19 in cities in SubSaharan Africa February 2021 HVT029.L3M192 – Rahul Jobanputra, Gail Jennings This research was funded by UKAID through the UK Foreign, Commonwealth & Development Office under the High Volume Transport Applied Research Programme, managed by IMC Worldwide. The views expressed in this report are those of the authors and do not necessarily reflect the UK government's official policies, nor those of any individuals and organisations referred to in this report. IMC Worldwide Ltd, the HVT Programme and the UK government shall not assume any responsibility for the results of works based on the use of this report. Users accept this publication is a guidance document only. Users accept that they need to take their own technical and legal advice before issuing Agreements, Terms and Conditions and other legally binding documentation related to implementing any recommendations. Reference No. HVT029.L3M192 Lead Organisation/ Consultant R Jobanputra Partner Consultant(s) G Jennings Title Fast-tracking public transport priority: Investigating the potential of Tactical Transit Lanes in mitigating the impact of COVID-19 in cities in Sub-Saharan Africa Type of document Project Report Theme Low carbon transport Sub-theme Technology and Innovation Author(s) R Jobanputra, G Jennings, C Cap, G Ankunda, S Mugume Lead contact R Jobanputra Geographical Location(s) South Africa, Kenya and Uganda Abstract Armed with the know-how, lessons learnt, challenges, and successes of already implemented Tactical Transit Lanes (TTLs) across a spectrum of cities, this study considers the current provision of public transport in low-income cities in Sub-Saharan Africa, the impact of the COVID-19 pandemic on transport, and the potential benefits of TTLs on high-volume transport routes in terms of adding capacity to the city's public transport provision and other consequential benefits. It was also important to investigate and show that proposals could be positioned as part of a long-term strategy and be tractable and scalable By using existing public transport data and the application of an assessment matrix, the study shows that significant benefits could accrue to case cities from the implementation of TTLs on the sections of the public transport network investigated, in terms of person throughput and in terms of time savings for workers and for operators (thus fuel and costs). The implementation of high-volume priority transport routes during the COVID-19 pandemic would therefore result in increased public transport services which would enable safer, more efficient, and more 'carcompetitive' public transport travel and have value beyond the immediate response to COVID-19. The scope of the technique proposed could also be broadened and applied in neighbouring areas as similar benefits could be accrued. Keywords Low-income countries; Tactical Transit Lanes; COVID-19 Funding UKAid/ FCDO Acknowledgements We gratefully acknowledge the input of our interviewees, survey respondents and stakeholders who provided information, insights, and personal experiences. We are also grateful to Holger Dalkmann, HVT Technical Lead for his committed involvement and considered insights. Cover Photo Credit: Constant Cap, Nairobi, Kenya Citation: Jobanputra, R; Jennings, G; Cap, C; Ankunda, G; Mugume, S (2021). Fast-tracking public transport priority: investigating the potential of Tactical Transit Lanes in mitigating the impact of COVID-19 in cities in Sub-Saharan Africa. Project Report, COVID-19 Response and Recovery Research, UKAID through the UK Foreign, Commonwealth & Development Office, HVT Applied Research Programme. i FINAL REPORT: Fast-tracking public transport priority: investigating the potential of Tactical Transit Lanes in mitigating the impact of COVID-19 in cities in Sub-Saharan Africa CONTENTS Executive Summary vi 1 Introduction 1 1.1 Overview of transport responses to COVID-19 in the case cities 2 1.2 The transport challenges addressed by this research 4 1.3 Aims and objectives 5 1.4 Alignment with the HVT research themes, priorities, and programme objectives 5 1.5 Alignment with FCDO priorities 6 2 Method 7 2.1 Research activities undertaken 7 3 Background, context, and applications of TTLs 12 3.1 TTLs – Approach and innovation 12 3.2 Technology options and common challenges 15 4 Studies from case cities: Cape Town, Nairobi, Kampala 17 4.1 Identification of high-value priority public transport routes for TTL intervention(s) 17 4.2 General benefits of improved public transport 17 4.3 City 1: Cape Town 18 4.4 City 2: Nairobi 34 4.5 City 3: Kampala 49 5 Project findings 70 5.1 Key findings 70 5.2 Limitations of the approach 72 5.3 Barriers to TTLs or pop-up infrastructure in case cities 73 6 Research dissemination 77 6.1 Initial stakeholder dialogue 77 6.2 Research uptake 78 6.3 Project outputs 79 7 Conclusion 80 8 References 83 APPENDICES APPENDIX A: Original project schedule 85 APPENDIX B: Stakeholder Consultation – Tactical Transit Lanes Questionnaire 87 APPENDIX C: TTLs – Technology options, common problems, and a guide to planning 92 APPENDIX D: Poster describing the matatu sector in Nairobi 97 APPENDIX E: Assessment Matrix 98 APPENDIX F: Nairobi, example of temporary infrastructure intervention – Kidero Drums 99 ii FINAL REPORT: Fast-tracking public transport priority: investigating the potential of Tactical Transit Lanes in mitigating the impact of COVID-19 in cities in Sub-Saharan Africa TABLES Table 1: Alignment with HVT's research priorities 5 Table 2: Details of stakeholders consulted in cities 8 Table 3: Examples from the United States of selected recently implemented TTLs 14 Table 4: Examples from the United States of recent TTLs of a particular type 15 Table 5: Categories of public transport improvement benefits 18 Table 6: Cape Town - functional road classes and details 20 Table 7: Cape Town - assessment of proposed TTL on Long Street 27 Table 8: Cape Town - assessment of benefits of proposed TTL on Voortrekker Road 29 Table 9: Cape Town - assessment of benefits for proposed TTL on Victoria Road 33 Table 10: Nairobi - details of road network, in terms of condition and length 36 Table 11: Nairobi - number of trips by travel mode and purpose in 2014 37 Table 12: Nairobi - assessment of proposed TTL on Mombasa Road 44 Table 13: Nairobi - assessment of proposed TTL on Jogoo Road 47 Table 14: Nairobi - assessment of proposed TTL on Haile Selassie/Ngong Road 49 Table 15: Kampala - 2011 land-use data 50 Table 16: Kampala - travel times by public transport 57 Table 17: Kampala - assessment of proposed TTL on Jinja Road 62 Table 19: Kampala - assessment of proposed TTL on Kampala-Kira Road 65 Table 20: Kampala - assessment of proposed TTL on Entebbe Road 69 Table 21: Cape Town - review of policy/ statutory requirements in relation to infrastructure provision 73 FIGURES Figure 1: Different levels of access to workplaces in the three study countries 4 Figure 2: Study method: overview 7 Figure 3: Boston's 'cone pilot' on Washington Avenue 13 Figure 4: Example of a pop-up bus lane in Glasgow, Scotland 14 Figure 5: Expanded parking lanes, making room for bike lanes, in Everett, United States 16 Figure 6: Cape Town - population density per area 19 Figure 7: Cape Town - areas of economic activity 20 Figure 8: Cape Town - overview of the road and rail transportation system 22 Figure 9: Cape Town average morning peak period traffic levels, 2020 23 Figure 10: Cape Town - map of proposed corridors for TTL interventions 24 Figure 11: Cape Town - cross-sections of existing and proposed TTL on Long Street 26 Figure 12: Cape Town - cross-section of existing and proposed TTL on Voortrekker Road 29 Figure 13: Cape Town - Victoria Road, image of bus lane and temporary barrier 30 Figure 14: Cape Town - cross-section of existing and proposed TTL on Victoria Road 32 iii FINAL REPORT: Fast-tracking public transport priority: investigating the potential of Tactical Transit Lanes in mitigating the impact of COVID-19 in cities in Sub-Saharan Africa Figure 15: Nairobi - current land use map 35 Figure 16: Nairobi - person trip desire lines in 2013 35 Figure 17: Nairobi - overview of transport infrastructure 36 Figure 18: Nairobi City County - matatu routes 37 Figure 19: Nairobi - proposed BRT lines 38 Figure 20: Nairobi - existing public transport routes to the CBD 39 Figure 21: Nairobi - typical peak period traffic levels/speeds 40 Figure 22: Nairobi - proposed routes for TTLs 41 Figure 23: Nairobi - image of typical bus stop 42 Figure 24: Nairobi - existing and proposed cross-sections for Mombasa Road/Uhuru Highway 43 Figure 25: Nairobi - existing and proposed cross-sections for Jogoo Road 46 Figure 26: Nairobi - existing and proposed cross-sections for Haile Selassie/Ngong Road 48 Figure 27: Kampala - current land use map 51 Figure 28: Kampala - Population and employment densities per area 52 Figure 29: Kampala City road network, 2019 53 Figure 30: Kampala - Images of transport in Kampala City (before the pandemic) 54 Figure 31: Kampala - public transport routes 55 Figure 32: Kampala - typical traffic levels, afternoon peak 56 Figure 33: Kampala - Image of traffic congestion (before the pandemic) 56 Figure 34: Kampala - planned MRT and LRT corridors 58 Figure 35: Kampala - planned BRT routes 58 Figure 36: Kampala - location of proposed TTLs 59 Figure 37: Kampala - Images of the Kampala to Jinja Road 60 Figure 38: Kampala - existing and proposed cross-sections for Jinja Road 61 Figure 39: Kampala - image of Kampala Road (before the pandemic) 63 Figure 40: Kampala - Kampala Road to Kira Road, existing and proposed cross-sections 64 Figure 41: Kampala - image of Kampala–Entebbe Road (before the pandemic) 65 Figure 42: Kampala - Kampala to Entebbe Road, existing and proposed cross-sections 67 Figure 43: TTL 'technology' options: cones, armadillos, wands, plastic barriers, bus gates 92 iv FINAL REPORT: Fast-tracking public transport priority: investigating the potential of Tactical Transit Lanes in mitigating the impact of COVID-19 in cities in Sub-Saharan Africa ACRONYMS CBD Central Business District COVID-19 Novel Coronavirus 2019 FCDO Foreign, Commonwealth & Development Office GABS Golden Arrow Bus Services, scheduled bus service in Cape Town, South Africa GHG Greenhouse Gas GKMA Greater Kampala Metropolitan Authority HVT High Volume Transport Applied Research Programme IMC IMC Worldwide Ltd JICA Japan International Cooperation Agency KCCA Kampala Capital City Authority LIC Low-income country LRT Light Rail MaaS Mobility as a Service MBT Minibus-taxi, the most common paratransit vehicle in the case cities MRT Mass Rapid Transit NaMATA Nairobi Metropolitan Transport Authority NMS Nairobi Metropolitan Services NMT Non-motorised transport, mostly walking and cycling SSA Sub-Saharan Africa TTL Tactical Transit Lane VOT Value of Time DEFINITIONS AND TERMS USED Boda-bodas Motorcycle-taxis, a key mode of public transport in both Nairobi and Kampala, but non-existent in Cape Town Bus Lanes A bus lane, or a bus-only lane is a road lane dedicated to use by buses only. It is designed to speed up bus services in congested locations. v FINAL REPORT: Fast-tracking public transport priority: investigating the potential of Tactical Transit Lanes in mitigating the impact of COVID-19 in cities in Sub-Saharan Africa BRT Bus Rapid Transit is a high-quality bus-based transport system that is designed to deliver fast, comfortable, and cost-effective services at metro-level capacities. It does this through the provision of dedicated lanes, with busways and iconic stations typically aligned to the centre of the road, off-board fare collection, and fast and frequent operations. Physical distancing As defined by the World Health Organisation (WHO) which uses the term physical distancing and provides several guidance scenarios: • protect yourself and others from – physical distancing, wearing a mask, keeping rooms well ventilated, avoiding crowds, cleaning your hands, coughing into a bent elbow or tissue. • what to do keep yourself and other safe from: maintain a distance of at least 1-metre; make wearing a mask a normal part of being around other people. • how to make your environment safer: avoid the 3Cs – spaces that are closed, crowded, or involve close contact. • don't forget the basics of good hygiene – hand washing, touching your eyes, nose and mouth, clean and disinfect surfaces. Paratransit 'Paratransit' refers to demand-driven, unscheduled public transport provided by small operators, typically in mini- to medium-sized buses. Paratransit is sometimes called 'informal', but operators are not always informal businesses, and they are not necessarily unregulated. Paratransit accounts for between 50-98% of passenger trips in Sub-Saharan cities. Paratransit vehicles are known by different names in different countries: dala dalas in Tanzania, danfos in Nigeria, matatus in Kenya and Uganda, trotros in Ghana, car rapides in Senegal, gbakas in Côte d'Ivoire, chapas in Mozambique, and 'minibus-taxis' in South Africa. (1) Lockdown According to Collins Dictionary 2020, lockdown is defined as 'the imposition of stringent restrictions on travel, social interaction, and access to public spaces.' Tactical urbanism Tactical urbanism is either a city or a citizen-led, quick and affordable way in which to test and demonstrate change – it is an approach premised on using short-term, low-cost and scalable interventions as a way to catalyse long-term change'. (2) Tactical Transit Lanes (TTLs) In simple terms TTLs means the application of techniques that allow the creation of (initially) temporary mechanisms to create increased efficiency public transport lanes and/or enhance passenger experience vi FINAL REPORT: Fast-tracking public transport priority: investigating the potential of Tactical Transit Lanes in mitigating the impact of COVID-19 in cities in Sub-Saharan Africa EXECUTIVE SUMMARY The evolving and complex public health, environmental, and economic challenges that the COVID-19 pandemic of 2020-2021 is presenting shows how critical it is to have the flexibility to quickly adapt urban transport networks to new protocols or shifting demands. Various forms of long-term lockdown or 'workfrom-home' restrictions have limited non-essential travel and resulted in some of the lowest vehicle volumes in decades worldwide, but governments recognise that people still need (and want) to move around. Adaptation of existing modes and infrastructure needed to happen rapidly and be widely promoted – not only to comply with restrictions, but also because the resulting public transport capacity reductions may see the decades spent in trying to discourage private means of transportation (especially in the Global North) being lost and attitudes being reversed in just a few months. In Sub-Saharan Africa (SSA), workers are largely reliant on paratransit and public transport1 , and on walking, as their main forms of commute. SSA cities are also experiencing an (mostly) uncontrolled expansion of the use of motorcycles as a form of public transport (locally termed boda-bodas). The mode's popularity is its flexibility and ability to negotiate traffic congestion, albeit sometimes by using road verges or footpaths. Roadsides in cities are also often populated by traders or market stalls, which are frequently a commuter destination or stop. During 2020-2021, most countries in SSA imposed capacity limits on public transport, but in some instances have been unable to impose these on a resistant, unsubsidised paratransit sector. Lockdowns were eased or gradually lifted over the course of late 2020, resulting in travel demand that is now close to pre-pandemic levels. Overcrowded vehicles and facilities are acknowledged as being a risk for virus transmission, and compliance of physical distancing rules has meant reduced capacity, which is often insufficient to handle peak travel demands and has become a financial issue for operators. As a result, in Kampala and Nairobi, data collected confirms that paratransit operators increased fares by 50% or more, and many commuters were therefore forced to walk to and from their places of work. In this way, COVID-19 has exposed the tenuous nature of the paratransit business model, and the impact on public health when the workforce is dependent on profit-making transportation. (1) Fare increases should not be borne by public transport users alone, nor should users be exposed to the inherent risk of not complying with physical distancing needs. In a resource-constrained environment, the ability of government and relevant authorities, as well as private operators, to rapidly provide or modify transportation options for diverse needs is of paramount importance to the well-being of the population and to growing urban needs. Rapid adaptation of the existing public transport system to provide additional capacity on high-volume routes is essential for the life and livelihood of workers in SSA countries. But resource and time constraints mean that additional capacity is unlikely to be through capital means or via new infrastructure, which typically have long lead times. This capacity needs to be provided through quick, lowcost, light, and agile adaptation of the existing system, and that responds to the shifting, evolving economic landscape. Tactical Transit Lanes (TTLs) are one approach to developing rapid, flexible infrastructure adaptations. In simple terms, this means the application of techniques that allow the creation of (initially) temporary mechanisms to create increased efficiency public transport lanes and/or enhance passenger experience. A TTL is essentially a public transport lane tactically implemented in dense, congested areas. It can be short, or as long as several kilometres. Lanes can be permanent, semi-permanent, or temporary (for periods up to one month). They can be set up quickly at very little cost, and can be implemented with recycled materials, such as plastic barriers or benches; the benefits are rapid adaptability and ease of implementation, with minimal disruption on existing traffic or the environment. One of the most salient qualities of a tactical building approach is that it is intended as a learning experience. This is an approach not readily used in SSA cities, but because it is not a tech-heavy technique and could readily fit into the current structure of SSA cities, it may well be an option in these cities, and be able to provide the much-needed public transport capacity. 1 In this report, the terms public transport and paratransit are used interchangeably, unless specified otherwise. vii FINAL REPORT: Fast-tracking public transport priority: investigating the potential of Tactical Transit Lanes in mitigating the impact of COVID-19 in cities in Sub-Saharan Africa Tactical urbanism (see Definitions and Terms Used, above) is a tool all cities have at their disposal to facilitate this rapid adaptation, and many cities in the US and Europe quickly rolled out low-cost, flexible interventions to make public transport more attractive. Apart from projects undertaken in Latin America (e.g., Bogota), most recent projects completed have been in the Global North, with many having been completed before the pandemic. Despite this, lessons learned, and approaches could still be applicable in the Global South. Policy and implementation may be different, but the benefits shouldn't be, and appropriate and publicly accepted responses could be locked-in to provide permanent benefits. Benefits of TTLs include: • Increased public transport speed and thus travel time savings (reported to be more than 25%); (2) • Decreased variability in travel times; • Quick implementation times; and • Potential ridership gains. Several technical resources and design guides exist about how to plan, choose materials for, install, or adjust TTL projects (see for example (2)). Armed with the know-how, lessons learnt, challenges and successes of already implemented projects across a spectrum of cities, this study considers the current provision of public transport in three cities in SSA, the impact of the pandemic on transport, and the potential benefits of TTLs on high-volume transport routes. Studies were undertaken in Cape Town, South Africa, a middle-income African country, as a base comparative case; and cities in two low-income countries: Nairobi, Kenya, and, Kampala, Uganda2 . The objective of the study was to demonstrate that through the implementation of TTLs on sections of public transport corridors, there would be many benefits such as increased person throughput, operational benefits, and benefits to public transport users in terms of time and have value beyond the immediate response to COVID-19. It was also important that proposals could be positioned as part of a long-term strategy and be tractable and scalable. To achieve these objectives, background transport and related data was collected for each city and analysed for possible TTL implementation. A local, selected expert and stakeholder group was consulted on the concept, and on their views on key routes for interventions. In total over 230 responses were received, mostly through electronic means (on Google Forms) – the only method of achieving meaningful engagement given the COVID-19 situation in all countries. Routes or sections of routes were selected for interventions based on stakeholder suggestions, then refined and guided by local expert input. Cape Town was used as a test case for assessment, and the learnings from this were used to inform the approach for the other two cities. Key characteristics for routes were that they needed to be at least two-lane dual carriageways amenable to modification to include a TTL; they needed to be where there was a high volume of public transport; and be congested at least during peak periods. The nature of the secondary data available and the operational complexities of paratransit, particularly in LIC cities, meant that operations along corridors, travel distances and time needed to be aggregated. Allowances for the unscheduled nature of transport and inefficiencies also required a global and generally applied factor. However, this was not seen to be an issue because in any case, even more sophisticated transport models would require generalisations for operations of this nature, and the objective was to provide a likely scale of benefit through implementation of the proposal. A proof-of-concept through a pilot is the only way of assessing actual benefits or issues. 2 Definitions of country status from: https://www.un.org/en/development/desa/policy/wesp/wesp_current/2014wesp_country_classification.pdf viii FINAL REPORT: Fast-tracking public transport priority: investigating the potential of Tactical Transit Lanes in mitigating the impact of COVID-19 in cities in Sub-Saharan Africa The outcomes for all cases in this study indicate that significant benefits would accrue from the proposals for all corridors in all cities investigated in terms of person throughput; in terms of time savings for workers and for operators (thus fuel and costs). In Nairobi, assessment of the three locally workshopped and agreed interventions show that: • For a 11km TTL on Mombasa Road/Uhuru Highway, the person throughput could be increased by 1030 in the peak hour for all public transport modes; operators could save an average of 30 minutes per trip which could equate to over $401,500 per annum in fuel costs; and cumulatively, commuters would benefit from a value of time saving of around $502,780 per month or over $6 million per annum (average low-mid salary based); • For a 5km TTL on Jogoo Road, the person throughput could be increased by 941 in the peak hour for all public transport modes; operators could save an average of around 20 minutes per trip which could equate to $150,500 per annum in fuel costs; and cumulatively, commuters would benefit from a value of time saving of $578,035 per month or nearly $7 million per annum (average low-mid salary based); and • For a 2km TTL on Ngong/Haile Selassie, the person throughput could be increased by 190 in the peak hour for all public transport modes; operators could save an average of around 10 minutes per trip which could equate to $22,890 per annum in fuel costs; and cumulatively, commuters would benefit from a value of time saving of $102,667 per month or over $1 million per annum (average low-mid salary based). In Kampala, assessment of the three locally workshopped and agreed interventions show that: • For a 2.5km TTL on Jinja Road, the person throughput could be increased by 347 in the peak hour for all public transport modes; operators could save an average of 10 minutes per trip which could equate to over $22,780 per annum in fuel costs; and cumulatively, commuters would benefit from a value of time saving of around $47,480 per month or almost $570,000 per annum (average low-mid salary based); • For a 3.6km TTL on Kampala/Kira Road, the person throughput could be increased by 306 in the peak hour for all public transport modes; operators could save an average of 7 minutes per trip which could equate to over $29,455 per annum in fuel costs; and cumulatively, commuters would benefit from a value of time saving of around $15,564 per month or over $186,000 per annum (average low-mid salary based); • For a 6.5km TTL on Entebbe Road, the person throughput could be increased by 1028 in the peak hour for all public transport modes; operators could save an average of 14 minutes per trip which could equate to over $153,280 per annum in fuel costs; and cumulatively, commuters would benefit from a value of time saving of around $131,533 per month or over $1.57 million per annum (average low-mid salary based). Similar but less pronounced results were obtained for Cape Town, primarily because of the reduced public transport modal share (in relationship to private vehicles). Although monetised here, value of time savings3 are not necessarily strictly speaking actual savings. The assessed time saving should, however, reflect additional time that commuters could use to do many other things – possibly work overtime or find additional work, which could result in an additional income; but is not something that can be quantified. The assessments assume that boda-bodas would be restricted from using the proposed TTLs (because they can – and do – negotiate their way through normal traffic more easily). This may be difficult to achieve practically in Kampala, as most vehicles on the routes proposed are boda-bodas (see Section 4.5), so compliance will be difficult. In Nairobi, boda-bodas do not use the highways, which is where TTLs are proposed, so compliance may not be too much of an issue. 3 Value of time savings are based on an average salary in Nairobi and Kampala, which for the low-mid income level groups varies because of the nature of employment but is estimated at $560 per month for Nairobi and $240 per month in Kampala. Note that the cost of living is more than 25% higher in Nairobi3 so salary differences would not necessarily result in better living standards, but value of time could. ix FINAL REPORT: Fast-tracking public transport priority: investigating the potential of Tactical Transit Lanes in mitigating the impact of COVID-19 in cities in Sub-Saharan Africa Apart from the salary differences between the two cities, a comparison of the results shows that it could be concluded that the extensive use of boda-bodas in Kampala (and the lack of medium to large buses) reduces the TTL benefits calculated, particularly value of time. Regardless, TTLs on any corridor in these cities, where there is high-volume public transport usage, would provide significant benefits to the city in terms of person throughput (through which the impacts of transport in general would also be reduced), to operators and commuters. How well TTLs would work in each location is clearly linked to length, type, and extent of the proposals, as well as the current operations in terms of vehicles using the corridors. The focus of this assessment is purely the transport-related benefits that can be discerned from the datasets. There are many consequential benefits apparent that are not quantified in this research but that may further enhance the case for piloting TTLs. Tactical building, i.e., piloting proposals, the most salient feature of this proposal, is the way to provide a data-rich assessment of the interventions suggested, and the verification of benefits. That there will be benefits in implementing proposals, especially TTLs in cities where there is such a reliance on public transport, is not in question. The question is how this research can be disseminated to officials, and adopted, and pilots then implemented. A brief review of prevailing statutes, policies, and local by-laws shows that there is little or no policy guidance/ enabling environment or requirements for temporary infrastructure interventions, especially in the LICs. There is precedent (for instance in Nairobi) which has allowed temporary infrastructure modification for traffic management purposes, so the guidance and tools are available for future proposals. These aspects are seen as being positives, because experience in Cape Town suggests that overly bureaucratic compliance of regulation-led approaches serve as stumbling blocks to infrastructure innovation and trials such as TTLs. Experience from the Global North also shows that activism and political partnership has worked together to implement many projects in a matter of weeks. A second phase of this research – that of evaluation, acceptance and funding a pilot's implementation – is therefore vital, so that momentum is not lost, nor are the possibly favourable conditions for such an intervention created by the pandemic. The publishing and hosting of this research on websites, on transport blogs such as the HVT's transportlinks.com blog and our approach to further dissemination (see Section 6) may yield positive responses. Further, assuming the necessary political support, pilots once tested and refined, should lead to more permanent adoption of the intervention or interventions. The results should be benefits for operators, commuters and consequential benefits of a better transport system that is more carbon-neutral and a society that will become more resilient to future pandemics or shocks. Horizontal and vertical scalability of this research should also follow. 1 FINAL REPORT: Fast-tracking public transport priority: investigating the potential of Tactical Transit Lanes in mitigating the impact of COVID-19 in cities in Sub-Saharan Africa 1 Introduction Mobility and accessibility in Sub-Saharan African (SSA) cities are generally inadequate and problematic due to a reliance on historic infrastructure and employment generators located chiefly in the central areas, which encourage tidal patterns of movement (in the morning and evening peaks). African cities are characterised by the fastest population growth in the world, urban sprawl, poverty, and income disparities. This results in spatial mismatches between housing and jobs, and rapid changes in travel demand has exacerbated this situation. (3) Although current motorisation rates are lower in SSA than that of the Global North, these are increasing rapidly as affordability increases and thus, there is little in the way of managing or reducing reliance on the private car. (4) The spatial mismatch and reliance on inefficient road-based transport modes has led to serious congestion in SSA cities. In time, because of insufficient government appetite and/or ability to upgrade and improve public transport (either through investment or regulatory actions), what has transpired is a system of underfunded and dilapidated public transport systems, the emergence of privately funded, inadequately regulated paratransit, underdeveloped road infrastructure, inefficient traffic management, and land-use that tends to be unsupportive of efficient public transport. Paratransit (often referred to as semi-formal or informal transport) epitomises mobility in SSA. It started developing in the 1980s and 1990s following a period of structural adjustments in many countries after independence, which contributed to the fall of state-owned and subsidised bus companies. Paratransit services in such contexts are varied, ranging from mainly minibuses and midi-buses running along prescribed routes to motorbike services and illegal and informal services by all the foregoing. Poorly designed road networks and increasing levels of private motorisation allied to urban sprawl, make walking and cycling dangerous and difficult. In this context, paratransit services are often the only means of transportation for many and have contributed to the increasing reliance of this mode for most Africans. (5) Since 2000, public authorities have used different strategies to rationalise or improve paratransit services, ranging from abolition or absorption to acceptance and regulation. At the same time, there has been a growing momentum towards investing in new, fixed-route public transport systems in SSA cities, supported by a mixture of local and international consultants and financing instruments. New bus and rail systems have become operational in many cities, and reports show that that many more are planned. Led by the exemplar South American successes, most of these systems are planned to be Bus Rapid Transit (BRT) systems. However, implementation of BRT systems is time consuming and, as evidenced in many African cities such as in South Africa, they are expensive, take a long period to implement, are reliant on public subsidy to operate and, in many cases, may not accommodate the needs of the low-income groups without additional feeder systems. Other issues, such as the entrenched nature of existing privately operated and funded public transport systems, integration between modes, appropriate standards for BRT, and technologies adopted for BRT, are proving to be problematic where BRT has been adopted. (6) In the meantime, in SSA cities, congestion continues unabated, with several cities featuring prominently in global congestion indices4 . Unlike trains, road-based public transport in SSA must share the road with mixed traffic, meaning vehicles are slow and journey times are unpredictable. Compounding these issues is the government imposition of physical distancing measures on all public transport vehicles post-peak pandemic lockdown. This is likely to result in a triple-whammy: limited provision means workers will switch to private modes (where they can) leading to increased congestion; workers will be late or not show up for work, meaning the economy will continue to suffer; or there will be a lack of compliance of physical distancing rules, meaning the continued spread of the coronavirus. People in cities, including the urban poor in informal settlements and slums, are highly mobile and often have strong social relationships with specific parts of the country or beyond. The COVID-19 crisis and the resulting economic crisis will also affect mobility, social movements, and food security. Maintaining access to livelihoods is critical for people in informal settlements and slums, often relying on public transport. (7) 4 See for example the Tomtom or INRIX indices, although note that data is sparse in most LIC cities 2 FINAL REPORT: Fast-tracking public transport priority: investigating the potential of Tactical Transit Lanes in mitigating the impact of COVID-19 in cities in Sub-Saharan Africa This report presents the current transport responses to the pandemic of three cities in SSA, Cape Town, Nairobi, and Kampala. It develops and details an investigation of a proposal to mitigate the impact of mobility constraints in each city investigated – the rapid reallocation lanes on high volume roads to public transport only lanes. 1.1 Overview of transport responses to COVID-19 in the case cities 1.1.1 Transport situation in Cape Town, 2020 In South Africa, Lockdown Alert Level 5 was in place from midnight 26 March until 31 April 2020. Movement was severely curtailed: individuals were not permitted to leave home except under strictly controlled circumstances, such as to seek medical care, buy food, medicine, and other supplies, or collect a social grant. All long-distance and inter-provincial public transport was prohibited; public transport operations were prohibited except for transporting essential workers, and then only between 5am and 10am, and 4pm and 8pm. Vehicles were not permitted to carry more than 50% of their licensed seating capacity. Exercise outside of the home was prohibited. Alert levels gradually decreased with corresponding relaxations in transport regulations until 28 December, when the country was placed back in an Adjusted Level 3. All road-based transport was permitted to operate at 70% capacity, and trains could carry a maximum of 100% capacity. (However, at the time of writing, in Cape Town, only two train lines were in operation, with the provider, MetroRail, running a basic peak hour commuter service). Although paratransit was permitted to operate at all hours, within curfew, after April 2020, trips to work had reduced (see Figure 1) possibly because of an increase in working-from-home and because of reduced spending capacity of patrons. Operators of MBT agreed to use roster basis to ensure that members earnt an income. Many have since left the industry, and fares have increased by up to 20% (see stakeholder consultation in Section 4). General traffic levels in the peak are approximately 20% below 2019 levels on key corridors into the city centre (Figure 1). 1.1.2 Transport situation in Nairobi, 2020 In Kenya a total lockdown was declared from 8 April 2020 for an initial period of 21 days. This shutdown focused on stopping movement in and out of areas that had recorded infections, namely Nairobi, Kilifi, Kwale, and Mombasa. Movement of essential goods was allowed under police supervision, but people were not permitted to travel in or out of these districts, and neither paratransit nor public transport were permitted to operate. During this time a general national curfew was imposed from 7pm to 5am each day. Schools, institutions of higher learning, clubs, restaurants, and non-essential businesses were all closed, with workfrom-home guidelines. No specific trade restrictions were announced, but trade was subject to sanitation protocols and physical distancing of one metre. These measures have since eased. Current measures specific to transportation are as follows: • 14-seater matatus can carry 10 passengers including the driver and crew, and are to ensure that passengers wash their hands and are sanitised before boarding (this had started well but disappeared over time); • 33-seater matatus are allowed a seated capacity of 18, including the driver and crew; • 51-seater matatus are allowed a seated capacity of 30, including the driver and crew; • Motorcycle taxis (or boda-bodas) may only carry one pillion passenger; • Five-seater taxi-cabs are restricted to three passengers, while seven-seater cabs are restricted to five passengers at a time; • It is compulsory to wear face masks in public; and • A 10pm national curfew. Since June 2020, the new directives have generally been complied with, although, while en route, vehicles have been observed to carry an extra passenger or two. 3 FINAL REPORT: Fast-tracking public transport priority: investigating the potential of Tactical Transit Lanes in mitigating the impact of COVID-19 in cities in Sub-Saharan Africa 1.1.3 Transport situation in Kampala, 2020 Uganda was among the last countries in Africa to confirm cases of COVID-19 (in March 2020). Lockdown started on 22 March 2020, and included closing education facilities for a month, suspension of public transport (buses, matatus, and boda-bodas) for 14 days, closure of non-essential businesses, and a night curfew from 7pm to 6am. Food markets and outlets were permitted to stay open, and vendors were encouraged to sleep at markets and venues to avoid travel. Boda-bodas were banned from carrying passengers but could transport cargo/luggage. People walked to buy food, and if they had to either walk a long way or bought more than they could easily carry, they had to find 'trustworthy' drivers to take their goods back to where they lived. When public transport was permitted to return, in June 2020, not only were capacities limited to 50%, but the relevant government authority had attempted to take the opportunity to regulate the mode, with registration requirements, new, rationalised routes, and permits. This left many passengers stranded with fewer vehicles, and at times fare prices had doubled. Even ride-hailing was prohibited, and essential workers were expected to use cars; only when that was deemed unfeasible did the government start providing transport. Continuing mitigation measures are: • Compulsory wearing of face masks in public; • Restricting public transport to half capacity; • Limiting political rallies to 200 people; • Provision of handwashing and sanitisation facilities; and • A 9pm curfew. The directive to reduce to half capacity is generally complied with, except in a few cases when the minibustaxis are out of town or have travelled past points where they expect traffic police. However, the actual reduction is essentially 35-40%, for example in minibuses/matatus, they simply leave the middle column empty, and the same applies to buses, where they skip one seat between passengers on every row. To compensate, fares have more than doubled along some routes, especially during peak hours. Generally, an increase in fares of between 50%-100% in Kampala have been imposed and experienced by our authors resident in Kampala. 1.1.4 Summary of the impact of COVID-19 on transport in the three cities The impacts of the adoption of the restrictions to public transport capacity in all cities are clear in the following graphic (Figure 1); as shown, in November 2020, there were approximately 25% fewer visits made to workplaces. The reduction in trips is greater in South Africa, confirming the increased levels of workingfrom-home reported. However, the graphic confirms that despite on-going restrictions in public transport capacity, numbers of trips to workplaces in cities in Kenya and Uganda are almost back to 2019 levels. Trip levels to work in South Africa are, however, still 20% less than levels prior to the pandemic. 4 FINAL REPORT: Fast-tracking public transport priority: investigating the potential of Tactical Transit Lanes in mitigating the impact of COVID-19 in cities in Sub-Saharan Africa Figure 1: Different levels of access to workplaces in the three study countries Source: https://www.bsg.ox.ac.uk/research/research-projects/coronavirus-government-response-tracker – Accessed 30 Dec. 20 1.2 The transport challenges addressed by this research Even though most SSA countries have imposed capacity limits on public and paratransit, they have been unable to enforce limits on a resistant, unsubsidised paratransit sector. Operators (as in South Africa5 ) either argue that customers demand full-capacity trips, as they would otherwise have long waits for returning vehicles (which could result in increased roadside security risks and late arrival at work), or they simply fill to capacity when the opportunity arises. Of course, there has been some level of compliance in LIC cities, but this, along with increased sanitation requirements, has meant that fares have increased. Further, overcrowded public transport vehicles and facilities continue to be risky environments for the rapid spread of the virus (even with compulsory mask-wearing). Compliance with physical distancing rules and thus reduced capacity has resulted in too few vehicles to handle the peak demand of passengers. This has led to non-compliance of regulations by operators and users transferring to alternative modes where these are available. In Nairobi and Kampala, alternatives to public transport are generally walking or the use of bodabodas. The latter are cited as being a major cause or agent of road traffic injuries and a significant burden due to their transgression of traffic laws. (8) For cities whose workforces are mainly in the lower-income category and who rely on public transport for their livelihoods, all the scenarios above are problematic. There is little evidence of alternative thinking or solutions for long-term change. This study suggests that additional capacity could be provided cheaply and quickly, by re-purposing high-use transport routes for immediate reallocation as public transport-only lanes, based on data and decisionsupport systems, while keeping costs down and using technology and innovation. More specifically, it suggests that because of the reliance on public transport in the LIC city context, benefits would accrue: 5 In July 2020, a highly visible political disagreement emerged in South Africa, for example, between the leading trade union, COSATU, and the paratransit industry; the Union believes the insistence on high percentage occupancies puts profit before the health and safety of the workforce5 . Despite the profile of the case and inherent risks, the paratransit industry prevailed in its wishes and continues to carry fully or overloaded vehicles. 5 FINAL REPORT: Fast-tracking public transport priority: investigating the potential of Tactical Transit Lanes in mitigating the impact of COVID-19 in cities in Sub-Saharan Africa • To cities in terms of additional public transport person throughput; • To operators in terms of time savings, thus fuel and costs; and • To workers in terms of time savings. Further, as the economic landscape is re-evolving, any changes made need to be agile or flexible enough to accommodate shifts in travel demand, land-use, and policy. 1.3 Aims and objectives By identifying and analysing high-volume commuter routes in each city, we investigate the feasibility of prioritising and increasing public transport capacity and performance for suitable corridors through Tactical Transit Lane (TTL) interventions that would suit the cities being studied. Through an investigation of related data, we aim to show that: • Quicker turnaround of trips could increase the person throughput on each route, reduce operational costs, long waits, and non-compliance of physical distancing; and • Reduced travel times may make public transport more car-competitive – its increased use would reduce peak congestion and have value beyond immediate recovery to long-term climate resilience. Successful implementation of the output from this work, its monitoring, evaluation, and modification (where appropriate), would show the potential of long-term promise in that cities could 'lock-in' possible congestionmitigation, pollution, and road safety gains through the period of the pandemic and benefit further from reduced GHG emissions and car-competitive transport. Our objective is, therefore, to ensure acceptance of this work and an early adoption of either the actual proposals, modifications thereof or similar techniques, through the involvement of relevant expert groups and stakeholders from the outset. The aim is also to prepare and disseminate this work as widely as possible, especially to other LIC beneficiaries. 1.4 Alignment with the HVT research themes, priorities, and programme objectives A summary of this study's alignment with HVT's research themes, priorities and programme objectives is provided in Table 1. Table 1: Alignment with HVT's research priorities HVT Research Priority Response Climate change mitigation and adaptation Promotion of public transport as a car-competitive mode Inclusion, gender, and road safety Increased capacity for public transport for all and reduction of exposure through reduction in private vehicle travel, use of boda-bodas and, possibly walking because of reduced public transport capacity Policy and regulation (including engineering) The research investigates policy and regulation positions of LICs in respect of temporary changes to transport infrastructure and possible changes needed to facilitate the proposals made to modify infrastructure, including engineering (where appropriate). Technology and innovation (including data and decision support systems) The introduction of a relatively little used technique into SSA cities, through modified approaches to suit traveller numbers and local needs. Decision support will be based on existing usage data and potential benefits that could be accrued. 6 FINAL REPORT: Fast-tracking public transport priority: investigating the potential of Tactical Transit Lanes in mitigating the impact of COVID-19 in cities in Sub-Saharan Africa HVT Research Priority Response Fragile and conflict-affected states The approach proposed could help in minimising fare increase for the vast majority of workers in SSA cities who rely on public transport for their daily commute to work. Research uptake and capacity building Research uptake is elaborated on in Section 5 of this report. The following text expands on and provides details to support the responses provided above to demonstrate that that the adoption and implementation of proposals (or similar) from this research would have excellent alignment with most of HVT's research themes, priorities, and programme objectives. 1.5 Alignment with FCDO priorities In terms of alignment with FCDO's priorities, HVT's web site (https://transport-links.com/researchareas/) states that: 'The research areas to be investigated under the HVT programme are closely aligned to FCDO priorities such as strengthening global peace, security, and governance, promoting global prosperity, tackling extreme poverty and helping the world's most vulnerable. ' As demonstrated in Table 1, this project closely aligns with HVT's priorities which are closely aligned with those of FCDO. 7 FINAL REPORT: Fast-tracking public transport priority: investigating the potential of Tactical Transit Lanes in mitigating the impact of COVID-19 in cities in Sub-Saharan Africa 2 Method An overview of the method used to achieve the aims and objectives is indicated in Figure 2. An investigation in each of the three cities – Cape Town, Nairobi, and Kampala – was undertaken by a local expert who was tasked with providing expert input and gathering the information required. In keeping with government restrictions (local and international), the project was carried out by using electronic means and was largely reliant upon secondary data repositories or information from local officials. Supplementary primary data was obtained from surveys where required. As indicated, the tasks of data retrieval (for routes and city information) and analysis and stakeholder engagement for each city were undertaken locally and concurrently. The task of identifying and detailing policy frameworks related to this particular aspect of transport planning and implementation for each city was undertaken in the background, while waiting for data, evaluation processes and analyses. Further, as implementation of the proposals was excluded from the scope of this project, early stakeholder engagement was important to help rapid public transport route development and promotion by city transport planners to speed up sustainable, equitable transport solutions – not just in response to the current pandemic but also as a longer-term city resilience response. Figure 2: Study method: overview 2.1 Research activities undertaken A copy of the proposed original work plan is included in Appendix A. Highlights from this work plan are provided in the text below. 2.1.1 Literature review and adoption of appropriate responses Although TTLs have been studied and trialled elsewhere, the literature does not detail the existence of any in SSA cities, nor does it note that they seem to be being considered as a response. This could be because of the lack of publication in SSA, because of the complexity of the paratransit sector (both minibuses and bodabodas) as a part of the public transport mix, or because the focus of transport solutions in these cities is on other options. This research has therefore reviewed the literature available and has detailed pertinent approaches adopted worldwide, particularly regarding TTLs, but also similar approaches. A summary of most pertinent details of TTLs is included in Section 3. 8 FINAL REPORT: Fast-tracking public transport priority: investigating the potential of Tactical Transit Lanes in mitigating the impact of COVID-19 in cities in Sub-Saharan Africa In addition, in support of a possible uptake of proposals in this research, a scan of the current LIC or city policy framework in relation to infrastructure procurement is provided in this research. We have also identified including potential obstacles to the approaches proposed. 2.1.2 Stakeholder consultation At the outset, a stakeholder and expert reference group was established for each city to undertake frequent online and in-person engagement to provide input into key aspects of the project. Stakeholders identified included individuals/experts in the transport sector, government ministries, nongovernmental organisations (NGOs) and community-based organisations (CBOs), public transport operator groups and users of public transport users. Details of stakeholders who responded are included in Table 2 and elaborated on in the section following. Table 2: Details of stakeholders consulted in cities City No. of respondents Respondent Industry Sector Role(s) Cape Town 8 City of Cape Town Government Transport planning, decision making, provider, policy-maker. Future Cape Town NGO Promotion of social or political change locally or nationally NMA Transport operator Public transport operators or owners of vehicles UCT Private individuals Transport sector/professional Advisors, actors, or role-players in the transport industry or professional involved in the planning, design, or execution of transport projects Nairobi 49 Nairobi Metropolitan Services Government Transport planning, decision making, provider, policy-maker. Safer Cities Nairobi Initiative, C-40 Cities, FLONE Initiative NGO Drive policy through advocacy, knowledge development, research, and data collection Public transport staff at termini CBO Representation of community groups Matatu Workers Union Transport Workers Union of Kenya Public Transport Operators Union Transport operator Vehicle owners, drivers, conductors, touts, stage manager (see infographic in Appendix C) ITDP Independent Consultants Transport sector/professional Planners, engineers, researchers (consulting) Kampala 178 KCCA Ministry of Works and Transport Government Transport planners, decision makers, providers, policy-makers. Uganda Sustainable Transport Network ITDP NGO Technical expertise, policy guidance and direct advocacy for sustainable transportation 9 FINAL REPORT: Fast-tracking public transport priority: investigating the potential of Tactical Transit Lanes in mitigating the impact of COVID-19 in cities in Sub-Saharan Africa City No. of respondents Respondent Industry Sector Role(s) Training, Education & Empowerment for Neighbourhood Sustainability (TEENS), Uganda National Urban Forum (UNUF) CBO TEENS: Access to youth through networks of communities UNUF: Platform for dialogue and participation among stakeholders to influence the country's policy and legal reforms for sustainable urban development Engineers Registration Board Independent Consultants Transport sector/professional Engineers and researchers Stakeholder consultations were undertaken during November and December 2020. 2.1.2.1 Stakeholder consultation methods Questionnaires were developed for different categories of stakeholders i.e., government/city officials, advocacy groups, experts in the transport sector and users of public transport. The questionnaires were administered through several platforms depending on the stakeholders' convenience. The platforms used for consultation include following and show corresponding responses received; • Online meetings: three in Cape Town, three in Kampala, and five in Nairobi; • One-on-one interviews with observation of physical distancing protocols: three in Cape Town, four in Nairobi, six in Kampala; • Online survey Google Forms: 178 in Kampala (some duplication), 40 in Nairobi, not used in Cape Town due to limited requirement; • Emails to all stakeholders; • Telephone. The high number of responses in LIC cities was due to the number of requests sent out to our extensive networks there and the ease of use of Google Forms. A sample of the questionnaires used are included in Appendix B. 2.1.3 Data collection, issues, and key corridor identification Background data on peak travel demand was obtained from published sources, using our local experts and from our knowledge of each case city. Public transport priority options for possible options for interventions were considered and developed using this data. In many cases, available data was historic and outdated. Where this was found to be the case, short surveys were carried out to supplement data or confirm accuracy where background growth factors were applied to estimate current volumes. Other issues relate to passenger numbers on each mode, and particularly information about boda-bodas which are prone to take alternative routes, short-cuts and even use footpaths, making data collection and analysis difficult, especially average travel times. For the latter, local experience and stakeholder knowledge was relied on to assess the data used. Land-use mapping, confirmed with local knowledge assisted in identifying large employers or employment centres and residential areas within city boundaries and, from a combination of all data, a careful selection of the corridors deemed suitable for TTL type interventions were identified. 2.1.4 Develop indices for the proposed assessment matrix The limitations imposed by HVT in terms of project scale and timescale constrained the nature, extent and scope of the appraisal method used to evaluate proposed interventions to a spreadsheet model. More sophisticated computer models have been developed by economists and financial modellers, mainly to evaluate the economic value of particular transport options and for a particular mode or objective, such as 10 FINAL REPORT: Fast-tracking public transport priority: investigating the potential of Tactical Transit Lanes in mitigating the impact of COVID-19 in cities in Sub-Saharan Africa highway cost benefit models, and emission reduction models (see for example (6)). Other, more conventional transport models or techniques tend to focus on macro to micro scale evaluation. Outputs from such models (micro- or meso-scale would be appropriate in this case) can be used for evaluation purposes. However, given the constraints of the project, as well as the nature of the informal, unregulated, and unscheduled public transport in all cities investigated (except Cape Town which has both scheduled and unscheduled public transport), it is unlikely that any such transport modelling system would be able to replicate a realistic enough scenario of current transport operations and thus outputs from the modelling would equally be unreliable. 2.1.4.1 Intervention benefits – analysis and assessment criteria Data was analysed through our spreadsheet methodology to ascertain the benefits of the proposed public transport priority lanes in each city in terms of operator costs and potential commuter value of time savings and well as additional person throughput enabled by the priority lane (which would directly address COVID-19 capacity concerns) The limitations meant that the spreadsheet model used the following assumptions, criteria, and methodology. i. The number of public transport vehicles using the corridor in the morning or evening peak remain as reported in official documentation (i.e., prior to the pandemic) or as per surveys undertaken; ii. The occupancy per mode is used based on country restrictions imposed (i.e., no overloading); iii. Journey distances are averaged because the corridors selected will have many different route origins and destinations for each mode; iv. Journey times are based on the location of the 'average' origin and destination, either from travel surveys or Google Maps for the peak hour on an average weekday for each city; v. Estimated time benefits of the intervention type and vehicle type are based on free-flow conditions over the intervention length with appropriate reductions for friction; vi. Potential changes to boarding and alighting time because of TTLs have been omitted for all modes (and in all calculations); vii. Potential increases in person throughput due to more efficient public transport provision in the peak due to more rapid turnaround has been calculated assuming that the number of passengers per hour remains the same as does passenger carrying capacity of the vehicle (i.e., peak period demand remains constant and there is no mode shift). This will provide a conservative estimate. Further, any increases in person throughput that is less than the full carrying capacity of the vehicle type is ignored because in the peak, vehicles are unlikely to travel at part-full capacity; viii. From the average speed and fuel consumption profiles for each vehicle type, a potential fuel saving per vehicle type for its peak hour operation due to the TTL is calculated and quantified as an annual saving to the respective operator (assuming an aggregation of operators for the route assessed). This calculation assumes that the same morning and evening peak travel time saving would occur and thus, a combined value will accrue; ix. The estimated time saving per public transport vehicle type is monetised for commuters based on average monthly income for low and low-mid income level groups (who are assumed to be the main body of public transport users). This monetary value of time is presented as a cumulative monthly amount for all commuters on the mode they used; x. Anecdotally it is known that travel speeds for boda-bodas are faster. There is no reliable survey data for this because of the erratic nature of their journeys and use of road space. To account for this, they are assumed to travel 30% faster than other modes in all assessments. They are also known to have shorter journey lengths than other public transport modes, so these have been modified accordingly.; xi. Estimated benefits in terms of time savings are dependent on the traffic upstream and downstream flowing as before the intervention. However, with a TTL intervention, downstream traffic is likely to change, depending on the distance and type of intersection and control mechanisms. It should be noted that for all cities studied, most paratransit drivers (and conductors) work on a daily rental system (also referred to as the 'target' system). Only income above this rental can be considered as their daily earnings. This is clearly directly related to trip numbers and occupancy, hence the desire to make as many trips as possible, particularly in peak periods, and consequently their dangerous and erratic driving. TTLs will 11 FINAL REPORT: Fast-tracking public transport priority: investigating the potential of Tactical Transit Lanes in mitigating the impact of COVID-19 in cities in Sub-Saharan Africa enable quicker journeys over the section of intervention and will also encourage more users due to more efficient journeys and reduced waiting time. The indirect monetary benefit of time saving to the public transport commuter is the ability to increase time at work or other activities. Neither of these have specifically been quantified but are stated here as general local economic context benefits that apply to all proposed interventions. Potential impacts on private vehicles in terms of disbenefits of TTLs or congestion, have been omitted as it is expected that they have options in terms of alternative routes, journey timing and even the possibility of changing modes should their journey prove to be less attractive than public transport. Added to these broad assumptions are possible issues such as enforcement, induced traffic, changes to existing public transport operations, or mode shifts. The needs of the levels of enforcement are assumed and detailed in the options chosen and are assumed to be effective. Induced traffic is something that cannot be easily assessed and is thus ignored. Changes to existing operations are not particularly relevant as the proposals are supposed to be quick-wins and temporary. Probably, most of these aspects would need to be estimated for even any sophisticated modelling system, and therefore the TTL mantra – that an on-theground, properly executed pilot of an intervention is the best way of establishing its realistic benefit – still holds. Evaluations from trials will provide actual impacts of proposals (assuming that they are in-place for sufficient time) and thus, whether they should be adopted or adapted in the short or long term. 2.1.5 Stakeholder re-engagement and outreach As an addition to this research, and to ensure that its findings are more fully understood by stakeholders (leading to possible consideration of implementation of pilots), a further, but on-line, stakeholder reengagement and outreach session is due to be held in March 2021. The intention is to hold a joint case study city webinar but with a focus on the Nairobi and Kampala (as being the intended beneficiaries of this research). All stakeholders previously engaged will be invited again, in addition, a poster (see Appendix F) will be sent to various NGOs and professional bodies to generate further interest. At this online engagement, the intention is to present a summary of the outcomes of the previous stakeholder consultation; a summary of a background to TTLs, its potential benefits, challenges, successes elsewhere; and recommended routes for implementation of particular types of TTLs and their predicted preliminary outcomes from these interventions. The session will also include an extensive Q&A session to enable a discussion on the potential of TTLs in each city. As the intention of this webinar is to inform stakeholders of our findings and to consider any particular concerns with proposals (as well as to create interest among officials for potential uptake), it is proposed that relevant outcomes from this event are summarised and produced as an addendum to this report. The findings should not require changes to this report, but they may be material to the furtherance of any TTLs being considered for implementation. Additional research uptake will be facilitated as described in Section 6. 12 FINAL REPORT: Fast-tracking public transport priority: investigating the potential of Tactical Transit Lanes in mitigating the impact of COVID-19 in cities in Sub-Saharan Africa 3 Background, context, and applications of TTLs 3.1 TTLs – Approach and innovation Tactical Transit Lanes essentially encompass (initially) temporary interventions to create increased efficiency public transport lanes and/or enhance passenger experience. The term and methods used derive from 'Tactical Urbanism', an approach to urban design and the improving of local environments through short-term interventions with low risks and possibly high rewards. (10) 'Tactical urbanism has applications across several intervention areas, such as pedestrian and bicycle mobility, resolving conflicts between mobility and liveability, improved transit experience, placemaking, and wayfinding'. (11) Tactical urbanism as an approach has several benefits: • It helps deepen understanding of users' needs at the site for intervention through a rapid assessment of the existing challenges, opportunities, and constraints; • It serves as a proof of concept for a plan before committing large financial investments to a project. Conversely, it also helps expedite project implementation knowing that there is a buy-in from all stakeholders involved if the tactical urbanism project has received positive feedback postimplementation; • It helps to quickly address problems related to user experience in our streets through cost-effective interventions. It encourages residents, non-profits, local businesses, and government agencies to work together while using the system creatively. This helps widen public engagement by providing an opportunity for more effective conversations with citizens. A tactical urbanism project is a catalyst for change which eventually needs to be made permanent and each project must be a contextual creative response to specific issues on a street in a neighbourhood to be successful. Cities must acknowledge the need for permanent intervention to improve liveability in their public realms in the longer term. (11) As the UCLA guide 'Best Practices in Implementing Tactical Transit Lanes' (2) states: 'Borrowing from the notion of tactical urbanism, tactical transit references low-cost, agile alternatives to jump start virtuous cycles of increasing bus ridership by speeding up travel times, improving [the] passenger experience and enhancing overall perceptions of riding the bus.' 'A TTL is a bus-only lane tactically implemented in dense, congested areas to speed up transit without major capital improvements. Many projects described by other names, such as: dedicated bus lanes, transit corridors, bus priority lanes and business and transit lanes (BAT) are TTLs.' TTLs can be as short as 100m, or as long as several kilometres. They can be permanent, semi-permanent, or temporary/short term (for periods of up to one month) or be as simple as off-road bus stops. Compared to permanent methods, temporary arrangements can be set up very quickly and at little cost, and often can be implemented using recycled materials. The benefits are rapid adaptability; ease of implementation (and thus less disruption to traffic during implementation); reduced costs; and minimal impact on the environment6 . Other, more transport-related benefits have been determined from longer term monitoring and evaluation of trials and are provided in Section 3.2.1 TTLs are similar in many ways to BRT rights-of-way and bus-lanes, the obvious differences being length, cost, and that BRT rights-of-way and bus lanes are only for a single mode (buses) whereas TTLs allow other vehicular access. Significantly, TTLs are pilotable. 6 www.zicla.com/en/blog 13 FINAL REPORT: Fast-tracking public transport priority: investigating the potential of Tactical Transit Lanes in mitigating the impact of COVID-19 in cities in Sub-Saharan Africa A project can be considered a Tactical Transit project if it (adapted from (12): • is implemented on a much faster timeline than typical capital projects; • uses temporary or low-cost materials; • is executed with a much smaller budget than a typical capital project; • seeks to build upon existing infrastructure; • is short in length, but part of a larger or longer-term effort; • is used to accelerate implementation of new transportation infrastructure; or • all the above. TTLs are appropriate in dense, congested areas where traffic speeds are low and/or headway reliability between public transport vehicles would help trip planning and scheduling. Many TTLs are implemented in 'commuter corridors' where, removing public transport vehicles from mixing with general peak hour traffic yields the greatest benefits. Where congestion is not all day and unidirectional (i.e., tidal flow), TTLs can operate in one direction in the morning peak and the other in the afternoon. (2) Tactical urbanism is intended as a learning experience. At a time of increased competition for infrastructure funding, TTL projects should not only accelerate the delivery of public transport projects, but also help create a paradigm shift towards safer, more efficient use of streets. (12) 3.1.1 TTL projects implemented Although many Bus Lane projects have been implemented in, particularly, Europe, most recent projects which are termed TTL projects (and fit into this definition) have been in the United States. These have been collaborations between the area's transit agency and the city and/or county planning or public works department. All projects are in metropolitan areas, with the trend being the implementation of bus lanes in targeted locations outside city centres on a specific route segment (see Table 3 and Table 4). (2) Figure 3: Boston's 'cone pilot' on Washington Avenue Source: LiveableStreets 14 FINAL REPORT: Fast-tracking public transport priority: investigating the potential of Tactical Transit Lanes in mitigating the impact of COVID-19 in cities in Sub-Saharan Africa Figure 4: Example of a pop-up bus lane in Glasgow, Scotland Source: Glasgowlive.co.uk In the United Kingdom, from a TTL perspective, new bus priority measures or road space reallocation measures favouring walking, cycling and buses are in planning or have been implemented in several London boroughs7 . Similar measures are also planned on two key river crossings Waterloo and London Bridges. In Scotland, a £10m fund was allocated in December 2020 to cities for pop-up bus lanes (see for example Figure 4). Glasgow has planned interventions on seven major streets including the creation of dedicated lanes, signal optimisation, and bus barriers8 . At the time of writing, February 2021, it was not clear whether e schemes had been implemented. Table 3: Examples from the United States of selected recently implemented TTLs Location Year opened/ piloted Length/type Pilot/ trial period Hours Riders/day Status Arlington, MA 2018 0.25 miles/ Cones Yes/ 6 months 6-9am in one direction 10,000+ Recommendations being implemented Baltimore: BaltimoreLink 2016- 2017 5+ miles on 9 streets each 0.25 miles No Most are 24/7 N/A Berkeley, CA: Bancroft Way 2018 0.25 miles/ Red painted lanes Yes/ indefinite 24/7 10,000 Conceptual design for permanent lane began in 2019 Boston/Roslindale: Washington Street 2017- 2018 1.25 miles/ Cones Yes/ 4 weeks 5-9am northbound 19,000+ Now permanent with red painted lanes 7 https://www.theguardian.com/uk-news/2020/may/15/large-areas-of-london-to-be-made-car-free-as-lockdown-eased 8 https://www.transport.gov.scot/news/10-million-for-pop-up-bus-priority-infrastructure-in-scotland/ 15 FINAL REPORT: Fast-tracking public transport priority: investigating the potential of Tactical Transit Lanes in mitigating the impact of COVID-19 in cities in Sub-Saharan Africa Location Year opened/ piloted Length/type Pilot/ trial period Hours Riders/day Status Cambridge/Watertown, MA 2018 0.9 miles/ Red painted lanes Yes/ Indefinite 24/7 12,000 Anticipated to last six months Chicago: Loop Link 2015 2 miles/ Red painted lanes No 24/7 N/a N/a Source: UCLA ITS, 2019 (2) Table 4: Examples from the United States of recent TTLs of a particular type Location Routes Parking removed/ changed Other features Arlington, MA 3 Yes Included signal phase changes, TSP, and queue jump Baltimore: BaltimoreLink 6+ Yes, added in some places System-wide overhaul with criteria for TTLs; 6 new full-time lanes; 2 enhanced full-time lanes; 2 peak hour lanes Berkeley, CA: Bancroft Way 9 Minor changes One-way Cambridge/Watertown, MA 2 No 'Quick-build' in two weeks Chicago: Loop Link 6 Yes Project includes bike lanes, stations, and new bus hub Cincinnati: Main Street 10+ Yes Spurred by grass roots advocacy group (Better Bus Coalition) Denver: Broadway/Lincoln Corridor 5 Yes 'Blocky' red paint being tested. Full time lanes converted from part-time. Lanes; lane extension Everett, MA 5 Yes No prior outreach Source: UCLA ITS, 2019 (2) 3.2 Technology options and common challenges Technology options for TTLs include: • Cones and other barriers; • Signage and striping; • Red painted lanes; • Forced turns; and • Specific hours of operation. Common challenges include: • Parking; • Access/loading zones; 16 FINAL REPORT: Fast-tracking public transport priority: investigating the potential of Tactical Transit Lanes in mitigating the impact of COVID-19 in cities in Sub-Saharan Africa • Community concerns around loss of trade, noise, traffic, and construction impacts; and • Enforcement. These are detailed further in Appendix C and considered in proposed interventions for the researched cities. 3.2.1 TTL published benefits Reported benefits of TTLs include (2): • Increased public transport vehicle speeds: although they can be short, TTLs can produce significant travel time savings. Reported benefits can be up to 28%; • Decreased variability in travel times: dramatic reductions in the variability of travel times have been reported, particularly in peak congestion periods; • Relatively quick implementation: cone pilots such as those in the City of Everett, United States (see Figure 4) were organised within weeks and installed in days; red painted lanes were installed in two weeks; • Potential ridership gains: research shows that bus lanes that reduce total public transport travel times by between 5-15%, and will themselves increase peak period ridership by 2-9% (13); and • Safety for cyclists: TTLs can give cyclists a buffer between parked and moving cars (in cases where the TTL is used for peak periods, or where both modes are allowed on the lane). Figure 5: Expanded parking lanes, making room for bike lanes, in Everett, United States Source: City of Everett, MA 17 FINAL REPORT: Fast-tracking public transport priority: investigating the potential of Tactical Transit Lanes in mitigating the impact of COVID-19 in cities in Sub-Saharan Africa 4 Studies from case cities: Cape Town, Nairobi, Kampala 4.1 Identification of high-value priority public transport routes for TTL intervention(s) While the immediate opportunity for the implementation of hard lockdown-related tactical transit infrastructure has passed (because many SSA economies have reopened at the time of writing), further lockdowns have maintained many travel restrictions, so there is still value in investigating 'temporary' or flexible public transport infrastructure. This is particularly so in LICs where there are high levels of reliance on public transport, few alternatives, and multiple demands for safer, affordable mobility options. Pilots of tactical urbanism are relatively quick and affordable ways in which to test and demonstrate change, and review and revise before resources are committed to a project. They are also ways in which to draw on local knowledge to ensure that users' mobility needs are met. During lockdowns in case cities, movement patterns were almost entirely disrupted. Even after initial lockdowns, when only essential travel was permitted and markets were closed, work from home or online continued where possible, larger gatherings are mostly prohibited, many school and other education travel intermittent, and curfews enforced. It is not yet clear whether these lockdown behaviours will have a lasting impact on travel behaviour. In investigating high-value priority routes for public transport, we therefore made the decision to move beyond the immediacy of response and recovery. Proposals mostly reflect travel behaviours before disruption (as trips to work are almost back to 2019 levels) and assume historic travel patterns will continue in most instances, that the origins of public transport trips are likely to be from low-income residential areas, where there is least likelihood of remote-working opportunities and therefore any post pandemic changes will be limited. The potential of proposals for change, learnings around challenges and policy-positions and possible obstacles to flexible pilots and strategic actions needed, should also remain valid. The sections below include summarised background information that is pertinent to the formulation of TTL proposals in each city, as well as information on future infrastructure projects that may influence the location of proposals or that could be used as TTLs on a pilot basis as this would enhance acceptability. 4.2 General benefits of improved public transport Public transport improvements can provide a variety of benefits to users and society, including some that tend to be overlooked or undervalued in conventional transport planning. This section details how the proposals are evaluated with a focus on the value to society. It does not deal with whether a particular service is beneficial or whether it needs to be improved in comparison to other infrastructure provision. There is little benefit in simply operating public transport vehicles; most benefits depend on how much public transport used, how well the service responds to users' needs and preferences and, possibly, how car-competitive the journey is and from this, how much modal shares are affected. Table 5: Categories of public transport improvement benefits Improved services Increased use Other benefits from increase public transport use Land use • Improved reliability, user convenience and comfort • Improved travel options, particularly for non-drivers • Improved local property values • Travel time • Financial viability of service, possibility of more improvements • Direct user benefits • Economic development benefits • Increased public fitness and health, since most public • Reduced traffic congestion • Road and parking cost savings • Provider and consumer cost savings • Reduced crash risk to others • Reduced sprawl (more compact development) reduced land consumption, open space preservation, and reduced public service costs. 18 FINAL REPORT: Fast-tracking public transport priority: investigating the potential of Tactical Transit Lanes in mitigating the impact of COVID-19 in cities in Sub-Saharan Africa Improved services Increased use Other benefits from increase public transport use Land use • Better and safer boarding and alighting transport trips include walking and cycling links • Air and noise pollution reductions • Energy conservation • Economic development benefits • Improved accessibility, particularly for nondrivers • Reduced vehicle ownership – reduced parking below provides a summary of broad public transport benefit categories. Not every improvement provides all benefits, but most provide several. Of these, our assessment has focussed on the benefits offered by improved services, and implicit in the proposed introduction of TTLs is reduced congestion, which has consequential operator and user benefits. These benefits are assessed for each corridor below. The remainder, although not assessed, should also result from TTLs; however, some are intangible (for example land use), and some are beyond the scope of this research. Table 5: Categories of public transport improvement benefits Improved services Increased use Other benefits from increase public transport use Land use • Improved reliability, user convenience and comfort • Improved travel options, particularly for non-drivers • Improved local property values • Travel time • Better and safer boarding and alighting • Financial viability of service, possibility of more improvements • Direct user benefits • Economic development benefits • Increased public fitness and health, since most public transport trips include walking and cycling links • Reduced traffic congestion • Road and parking cost savings • Provider and consumer cost savings • Reduced crash risk to others • Air and noise pollution reductions • Energy conservation • Economic development benefits • Reduced sprawl (more compact development) reduced land consumption, open space preservation, and reduced public service costs. • Improved accessibility, particularly for nondrivers • Reduced vehicle ownership – reduced parking Source: Modified from www.vtpi.com/tdm It is both notable, and of concern, that improved travel times (which leads to a more efficient, streamlined scheduled service) on public transport routes in our study cities may be detrimental to transport providers where the transport provision is unscheduled. This is because efficiencies lead to a reduction in the number of vehicles needed to serve the same number of passengers in a particular time period (e.g., the peak periods). Operators who have invested in vehicles may therefore suffer because of reduced vehicle requirements and, possibly, this will result in disputes, displacement, or lay-offs – none of which are the desired impact of efficiencies. Scheduled transport would, of course, benefit from route efficiencies. Fuel efficiencies would benefit all. However, whether fuel savings balance reduced vehicle needs depends on the nature of operations. The aforementioned may be moot given that there is always an opportunity to put time savings to other uses such as increasing frequencies or modifying routes. The latter is particularly likely in informal contexts and where settlements can be vast and badly served. 4.3 City 1: Cape Town 4.3.1 Transport and land-use context 19 FINAL REPORT: Fast-tracking public transport priority: investigating the potential of Tactical Transit Lanes in mitigating the impact of COVID-19 in cities in Sub-Saharan Africa Cape Town is the second largest city in South Africa, and its metropolitan area extends to over 2,460km2 . Its population is estimated as being 4.5million in 20199 . Growth rates are approximately 2% per annum, so the need for additional public transport services will grow accordingly. The data also shows that of the current population there are around 750,000 of the economically active earn up to R5000 per month10. This cohort are 'captive' to public transport or walking and cycling, because they cannot afford personal motorised means of transportation11 . Nationally published data12 shows that in 2019, a total of 1,287,748 vehicles were registered and licensed in Cape Town, indicating an ownership rate of approximately 280 per 1,000 population, which puts the city into one of the highest ownership levels in the continent13. The fall-back option of public transport commuters using private modes can therefore be a possibility if there is a lack of public transport capacity because of restrictions. Spatially, Cape Town is still largely divided along the historical apartheid planning policy of separating workers in dormitory areas far away from economic activity (see Figure 6 and 7). This means that most workers from the metro-southeast (who use public transport) must travel up to 50km each way each day to get to work opportunities. Figure 6: Cape Town - population density per area Source: Ivan Turok, 2015 (Presentation made to City of Cape Town) 9 https://worldpopulationreview.com/world-cities/cape-town-population 10 Calculated from population and age profiles 11 Motorbikes are an alternative. But usage is limited because of the city's weather (high winds in summer and rain in winter and fears because of the city's appalling road safety record. 12 http://www.enatis.com/index.php/statistics/71-live-vehicle-population-per-registering-authority (accessed December 2020) 13 https://en.wikipedia.org/wiki/List_of_countries_by_vehicles_per_capita country statistics (accessed December 2020) 20 FINAL REPORT: Fast-tracking public transport priority: investigating the potential of Tactical Transit Lanes in mitigating the impact of COVID-19 in cities in Sub-Saharan Africa Figure 7: Cape Town - areas of economic activity Source: Ivan Turok, 2015 (Presentation made to City of Cape Town) In terms of modal share, the walking and cycling: public: private motorised vehicle split for the city was 9%: 38%: 53% in 2018. This data includes rail passengers, although there has since been a serious decline in rail provision, and the impact of physical distancing requirements on public transport is not accounted for. It is therefore likely that the private and road-based public transport mode share has increased substantially since then. The primary modes of public transport in the city are minibus-taxis (MBT), publicly subsidised Golden Arrow Bus Services (GABS), the publicly subsidised MyCiTI BRT service, and Metrorail (commuter rail). A comparison of fares for public transport indicates that GABS provides the cheapest option for distancedbased fares at R5 (approx. $0.33) for a 0-5km trip. MBTs provide the most flexible and quickest service (up to 10 minutes per trip faster for a 20km trip). (14) Table 6 provides details of the road network in Cape Town, shown pictorially in Figure 8 along with rail and MyCiTI routes currently in operation. Typically, arterial lane widths are 3.7m, although many historic and local roads are narrower. The nature of TTLs (unless used in a contra-flow manner or taking over the whole corridor) means that it is mainly Class 2 and some Class 3 roads that would be suitable routes for such interventions. Apart from Classes 4 and 5 roads, most other roads are in good condition and thus suitable for interventions. Table 6: Cape Town - functional road classes and details Road Class Length Average lane widths Proportion of overall Principal Arterial (Class 1) 558km 3.7m 5% Major Arterial (Class 2) 875km 3.7m 7.5% Minor Arterial (Class 3) 980km 3-3.7m 8.5% Collector (Class 4) 930km Varies 8% Local Street (class 5) 8,350km Varies 71% 21 FINAL REPORT: Fast-tracking public transport priority: investigating the potential of Tactical Transit Lanes in mitigating the impact of COVID-19 in cities in Sub-Saharan Africa Road Class Length Average lane widths Proportion of overall Total 11,696km Source: Modified from City of Cape Town (15) Peak period traffic volumes have been increasing steadily over the past decades, and many elements of the road network have reached their peak hour capacity. Pre-peak hour traffic levels on Principal Arterials indicated that around 25% of the network operated at speeds less than 50% of the posted speeds (i.e., were congested); and that more than 70% of the Major Arterials network (Class 2 roads), was operating at congestion conditions. (14) An extract from a recent Google Map of current average peak hour traffic levels in terms of speed in the morning peak (Figure 9) shows that not all parts of the network is congested, only some Principal and Major Arterials are. Conditions in the evening peak are similar, except in the reverse direction as most of the working population reside in the south and south-east of the CBD. A planned expansion of the MyCiTi network (both BRT and hybrid) is also along many of the Class 2 and 3 roads. Therefore, from this brief overview that TTLs would best be located on one of these congested arterials to assist in achieving travel time reductions for public transport users. 22 FINAL REPORT: Fast-tracking public transport priority: investigating the potential of Tactical Transit Lanes in mitigating the impact of COVID-19 in cities in Sub-Saharan Africa Figure 8: Cape Town - overview of the road and rail transportation system Source: City of Cape Town (15). The map indicates the main routes of the City owned and operated BRT system and the Metrorail system only. Remaining road-based public transport systems, Golden Arrow Bus Services, and the minibus-taxi industry, operate on some of these and many other routes citywide. 23 FINAL REPORT: Fast-tracking public transport priority: investigating the potential of Tactical Transit Lanes in mitigating the impact of COVID-19 in cities in Sub-Saharan Africa Figure 9: Cape Town average morning peak period traffic levels, 2020 Source: Google Maps (accessed December 2020) 4.3.2 Key considerations from outcomes of stakeholder consultation The intention of studying the potential of TTLs in Cape Town was primarily to use information gathered as a learning experience for the study in LIC cities. As the authors are familiar with the transport situation in the city, a broad stakeholder consultation was not necessary. As it transpired, only a small number of the selected stakeholders responded. Stakeholders and officials confirmed that temporary infrastructure interventions are often 'too difficult to implement' given the City's protocols/official processes. Officials also confirmed that the City had recently trialled a temporary bus lane along a selected corridor during the morning peak period but concluded that there were too many infringements and that temporary installations were too difficult to adequately police. No further details of issues or actual monitoring and evaluation processes were available. Other stakeholders (see details in Table 2), some representing the minibus-taxi industry, confirmed that the restrictions in travelling, and fear of travelling on public transport because of the pandemic, had resulted in a decrease in capacity of services offered, thus job losses and an increase in fares of up to 20%. They thought TTLs would be worthwhile and would help the industry, but confirmed that despite their temporary nature, approval of a trial would be a bureaucratic challenge because an agreement for their implementation would require a team of officials consisting of a political champion, transport planners, network management specialists, communications specialists, community services, police, area management politicians, and a liaison person with public transport service providers14 – and then be approved by a specialist transportation sub-committee of the council. The literature (2) indicates that this level of engagement and approval is clearly not what has been practiced in successes achieved elsewhere, even in highly developed and regulated environments. It shows that political will to encourage and allow trials is paramount to the success of such project. 14 This is required because of an often violent and adversarial nature of paratransit industry and mistrust of authorities 24 FINAL REPORT: Fast-tracking public transport priority: investigating the potential of Tactical Transit Lanes in mitigating the impact of COVID-19 in cities in Sub-Saharan Africa 4.3.3 Corridor selection, intervention type, and analysis Although congestion in the city mainly occurs on the freeways and major arterials in peak periods, to and from the CBD, these roads accommodate all modes of transport, with only limited dedicated lanes for public transport. Public transport users on these routes would therefore gain the most from TTL interventions on these roads. Based primarily on this logic, but also on local experience, Figure 10 shows the corridors selected for assessment. Details follow. Figure 10: Cape Town - map of proposed corridors for TTL interventions 4.3.3.1 Corridor 1: Long Street Long Street is a historic and major one-way through-route for users wishing to travel from the commercial centre of the CBD (and entertainment in the evening) to the Atlantic Seaboard and southern parts of the city. It acts as a two-way couplet with Loop Street for the inner part of the city and provides access to the higher income residential areas immediately to the south of the city centre. For most of its length, it is a four-lane wide road with a variety of business, touristic and commercial uses alongside. Parking is available on both sides of the road along most of its length, and because of the uses of this street, delivery vehicles, many metered taxis, private vehicles, and public transport vie for space resulting in either congestion because of parking vehicles, double parked vehicles. or both. An average of nearly 1200 vehicles have been recorded along the street, with a modal split reflective of the general citywide split. Although this section of the road is only 1.35km long, a TTL along most of its length should have multiple beneficial impacts on public transport travel times and on other vehicles using the road – from reduced friction through the adaptation of the left lane of parking. Ample parking is available on the right side of the road and on adjacent streets, meaning there should be little or no impact on businesses. Events such as Open Streets have been proposed on Long Street in the past but have never been implemented mainly because of the bureaucratic processes involved. The concept is to make a 24/7 intervention as shown in Figure 11, with kerbs as a demarcation and barrier for public transport vehicles, if, and when, it is made permanent. As a pilot and for this assessment, cones or temporary plastic barriers could be used to demarcate the proposed bus 25 FINAL REPORT: Fast-tracking public transport priority: investigating the potential of Tactical Transit Lanes in mitigating the impact of COVID-19 in cities in Sub-Saharan Africa lane, and a bicycle lane in place of the parking can be achieved by a solid white line. A full-time intervention will assist in increasing awareness and journey planning, as well as minimising daily labour costs involved with a peak period pilot. Other more detailed design considerations are indicated below. Planning considerations • Partnerships/project team – the project team would need to consist of City officials, business representatives, the Central City Improvement District, urban activists, cycling advocates, law enforcement, public transport operators and, possibly, urban specialists; • Parking – as stated, ample parking is available on the right side of the road as well as nearby in adjacent roads. Parking may become an issue with businesses, but it is something that can be resolved with a pilot and evaluation of impact on business; • Access/ loading – again, this will be an issue with businesses. The concept is to allow loading on the righthand side parking lanes; • Goals – the obvious goal for this proposal is to decrease public transport travel times and thus increase person throughput per hour. Other expectations would be increases in cycling along the street (although this would require connection to a greater network which currently does not exist). These would have limited or no impact on businesses, other than positive impacts; • Design considerations – apart from the type of the temporary lane demarcations, consideration needs to be given to left turning vehicles onto and off Long Street. Given that Long Street lies in the heart of the city and its grid-like road layout, it is proposed that only the main road intersections with Strand Street, Wale, Riebeek Street and Hans Strijdom are kept fully operational. Bus gates (see Appendix F), preferably automated, would be the proposed solution to deter non-transit vehicles from using the TTL. For a pilot, an affordable temporary parking gate type option at the start of the lane and marshals in the peak would suffice. Also, although not evaluated, signal timings in the evening peak could be adjusted to favour public transport. This is a relatively simple operation with the modern signalling controllers installed in the city; • Enforcement – the bus gates proposed (both temporary and permanent) above should help reduce the need for the presence of law enforcement officers to a minimum; • Other vehicle access – the TTL should be used for all public transport, although as a trial, it may be in the interests of the City to not allow MBTs along the TTL. This may be politically difficult15 and cause additional unwanted enforcement issues, but evaluation information from here and other similar trials could provide data that would assist in reformation of the industry; • Pilot period – a pilot of at least two weeks (full-time) is required to provide normalised and representative data. This period should be outside of the main holiday times; • Public engagement, messaging, costs, and funding are not addressed here, but would need to be considered prior to any implementation. 15 The paratransit industry is well organised, has connections at a high level and is known for disruptive action when there is a perception of unfair treatment 26 FINAL REPORT: Fast-tracking public transport priority: investigating the potential of Tactical Transit Lanes in mitigating the impact of COVID-19 in cities in Sub-Saharan Africa Figure 11: Cape Town - cross-sections of existing and proposed TTL on Long Street16 Assessment Despite the proposal of full-time intervention, a modelling assessment was undertaken for the evening peak period which is normally the period during which the greatest number of public transport vehicles use Long Street and when a TTL could be most beneficial. Because Long Street is only 1.35km long, a maximum of five-minutes travel time saving in normal evening peak traffic is estimated, after allowing for traffic friction (due to vehicles parking and double-parked, which is ad-hoc and not consistent). The results of this intervention were calculated over the evening peak only, because the street is a one-way and the major flows are in the evening. They are therefore limited in scale (see Table 7) in terms of potential annualised fuel cost saving and cumulative average travel time savings for passengers. Person throughput is also unlikely to increase with a 5-minute time saving per vehicle. Nevertheless, a total monthly saving in travel time ($2,458) is equivalent to more than seven average monthly salaries; and the fuel saving is equivalent to nearly 200 litres. These numbers are only for the weekday peak 16 Software used for the cross-sections (Streetmix) is quite commonly used by many authors 27 FINAL REPORT: Fast-tracking public transport priority: investigating the potential of Tactical Transit Lanes in mitigating the impact of COVID-19 in cities in Sub-Saharan Africa and will clearly be added to by consideration of the whole period. The addition of the bike lane will add to the streetscape and may start to change the city centre towards a more 'liveable' streets type environment. Table 7: Cape Town - assessment of proposed TTL on Long Street Mode Possible additional person throughput during the peak hour Potential saving for operator ANNUAL (fuel only) Possible CUMULATIVE monthly passenger peak hour time of travel savings/month (salary based) MBT 0 $499 $1,167 GABS 0 $220 $458 MyCiTI 0 $989 $833 Note: Conversion rate of 15 Rand to 1 USD applied 4.3.3.2 Corridor 2: Voortrekker Road Voortrekker Road connects the city centre via a 17km east-west route passing by a wide range of institutions, businesses, and offices. It is a corridor with a wide range of mixed-use facilities and plays a primary connector role between the two major employment nodes of the city – the CBD and Bellville. All main public transport service providers run along the route, (MyCiTi, GABS and MBTs) and the city's rail corridor also runs parallel to the road (see Figure 10). The road is a dual two-lane road for almost its entirety, but its cross-section is not consistent along its length. Several sections have a third 'off-road' parking lane on both sides and a 1m wide central island. Side roads are afforded all-movement access along the road through signal-controlled or intersections that give-way to Voortrekker Road. The road is also parallel to the city's major road transport corridor, the link between the CBD and Belville and to Johannesburg to the north, the N1. Large, middle-class residential areas flank either side of the road over its entirety, resulting in peak period commuting congestion on both the N1 freeway and Voortrekker Road (inbound in the morning and outbound in the evening but more tidal on Voortrekker Road). Traffic volumes in the morning peak are at around 2450 vehicles per hour, with a modal split of 11.5% MBT, 2% buses, 2% MyCiTi, and the remaining being private motorised traffic and freight. Current travel times over this section for public transport vehicles are an average of 60-65 minutes in the morning peak and 65-70 minutes in the evening peak. As stated in the stakeholder consultation, the City of Cape Town has already undertaken a trial of a temporary, dedicated corridor for MyCiTi buses and has experienced enforcement difficulties due to violations. These are likely to be encountered again on the TTL, depending on its type, nature, and period of operation. The simplest to implement, possibly most acceptable, and effective intervention would be the consideration of full-time east and westbound TTLs for an 8.5km section of the road shown in Figure 10, for all modes of public transport17. This section has fewer adjacent land-uses and is therefore more of a commuter route than the rest of Voortrekker Road. Its commutability can be increased by considering the closure of many of the side streets accessing it. These are detailed in the design considerations following. Again, either cones or temporary plastic barriers would be the preferred solution to enable the demarcation of a segregated public transport lane on both sides of the road. Bus gates as proposed for Long Street, above, would also be required for the pilot and for any permanent solution(s) adopted. 17 An alternative would be to limit the TTLs to MyCiTi and GABS only, however, given the experiences of the City (law enforcement issues) and the likelihood of political fall-out, this option is not felt to be prudent. 28 FINAL REPORT: Fast-tracking public transport priority: investigating the potential of Tactical Transit Lanes in mitigating the impact of COVID-19 in cities in Sub-Saharan Africa Planning considerations • Partnerships/project team – the project team would need to consist of City officials, business representatives, the Greater Tygerberg Partnership, urban activists, cycling advocates, law enforcement, public transport operators and, possibly, urban specialists; • Parking – parking need not be provided, nor should it be an issue; • Access/loading – the few businesses impacted by this proposal would need to gain access for loading at the rear or on adjacent streets; • Goals/ types – the obvious goal for this proposal is to decrease public transport travel times and thus person throughput per hour; • Design considerations – apart from the nature of the temporary lane demarcations, consideration needs to be given to the side streets affording turning vehicles onto and off Voortrekker Road. Given that this section of the road is largely away from the denser business environment, and thus the limited number of side streets intersecting with the road and the grid-like road network adjacent, it is proposed that all side streets be closed off to turning vehicular traffic, except for major intersections with Cannon St., 1 st Avenue, 5th Avenue, 13th Avenue, 18th Avenue, Jakes Gerwel Drive and Vasco Boulevard. This would need further, more detailed review and consultation. Bus gates, preferably automated would be the proposed solution to deter non-transit vehicles from using the TTL. Again, for a pilot, an affordable temporary parking gate type option would suffice. Also, although not evaluated as such, signal timings in both peaks could be adjusted to favour public transport. This is a relatively simple operation with the modern signalling controllers installed in the city; • Enforcement – the bus gates proposed (both temporary and permanent) above should help reduce the need for the presence of law enforcement officers to a minimum; • Other vehicle access – the TTL should be used for all public transport, however, as a trial, it may be of value to permit bicycles access; • Pilot period – a pilot of at least two weeks (full-time) is required to provide normalised and representative data. This period should be outside of the main holiday times; • Public engagement, messaging, costs, and funding are not addressed here, but would need to be considered prior to any implementation. Assessment Although the proposal is to implement a full-time intervention, a n assessment was undertaken for the morning peak period, inbound, which is normally the period during which the greatest number of transit vehicles use the road. Assuming free-flow travel over the TTL, a time saving of around 14 minutes could be attained in both peaks because of this intervention. Time savings allow for possible friction due to signals and ignore any possible benefits which could be gained through adjustment of signal times. A summary of the key benefits that could accrue from this TTL is shown in Table 8. In terms of fuel, a saving of over 15,000 litres could be made. And time of travel savings could be equivalent to 300 persons salary for a month. These savings are clearly significant and reflect the level of reliance on public transport along this corridor. Increased benefits of a transit lane over the whole length of this corridor seem to be apparent from this level of evaluation, and it seems like something that should be eagerly pursued by a local government that prioritises transit and its known wide range of benefits. Person throughput could also increase significantly, however, as already alluded to this implies efficiency gains that could for instance lead to a reduction in demand for 45 MBTs and six GABS buses (if passenger numbers remained constant in each peak hour). While the GABS services would benefit from this, it is not clear what impact such a change would have on the MBT industry. 29 FINAL REPORT: Fast-tracking public transport priority: investigating the potential of Tactical Transit Lanes in mitigating the impact of COVID-19 in cities in Sub-Saharan Africa Table 8: Cape Town - assessment of benefits of proposed TTL on Voortrekker Road Mode Possible additional person throughput during the peak hour Potential saving for operator ANNUAL (fuel only) Possible CUMULATIVE PASSENGER time of travel average cost saving/month (salary based) MBT 626 $11,292 $65,333 GABS 190 $1,807 $32,083 MyCiTI 19 $217 $2,917 Note: Conversion rate of 15 Rand to 1 USD applied Figure 12: Cape Town - cross-section of existing and proposed TTL on Voortrekker Road 4.3.3.3 Corridor 3: Victoria Road (CBD to N2, in and outbound) Victoria Road, like Voortrekker Road, is a major arterial road leading to and from the CBD. For the length in consideration, it runs almost parallel to a major urban freeway in the city, the N2. It is also a two-lane dual carriageway, and along most of its length it has a narrow paved central reserve 1m wide and a parking lane on 30 FINAL REPORT: Fast-tracking public transport priority: investigating the potential of Tactical Transit Lanes in mitigating the impact of COVID-19 in cities in Sub-Saharan Africa either side to allow access to shops and businesses. Numerous side streets have all-movement access to this corridor, either via signalised control or give-way intersections. Residential areas, such as Salt River, Woodstock, and Observatory, are a block or so away from the road. The road is currently marked as having a dedicated bus lane along part of its length. It is not continuous as it allows access to the many side roads and, off-peak, it doubles up as the parking lane and with many loading bays. Although marked as a 'Bus Lane', it is also used by MBTs. The hours of operation are between 6am to 8am both inbound and outbound, and 4pm to 6pm in the outbound direction only. The Bus Lane is poorly enforced, so is regularly used for parking (even in the peak) and by general traffic to gain advantages in the peak over some sections. Ad-hoc loading and off-loading by MBTs and turning traffic cause considerable disruption to smooth public transport flow along this corridor. The existing bus lane could be considered to be a TTL, however, it needs to be modified to overcome the numerous issues identified above. The fact that it exists in its current form means that there was (and still is) a need to give due consideration to public transport vehicles and users. It also means that it would be politically and technically acceptable to investigate changes to make it function in the manner intended and, to trial a pilot to evaluate possible benefits. Furthermore, it is known that the congestion leading out of the CBD has been of concern for some time and that the City has been considering a new outbound (from the CBD) priority lane for public transport has been in consideration for some time. (13) Options included Victoria Road and a public transport lane on the N2. However, a public transport lane on the N2 would require considerable infrastructure modifications which may be expensive, politically challenging, and disruptive to existing traffic whereas transforming current infrastructure on Victoria Road seems to be simpler if officials, decision-makers, and the local community (including businesses) can agree on a solution. Figure 13: Cape Town - Victoria Road, image of bus lane and temporary barrier Source: Google Maps (accessed January 2021) From a design perspective, traffic flows are high throughout the day, but with a tidal peak flow. Volumes average at 1585 vehicles per hour inbound and 1420 vehicles outbound at the start of the corridor (Sir Lowry's) which are low for a dual two-lane road. The modal split is 2.5% buses, 11.5% MBTs, the remaining are private motor vehicles. Travel times for public transport vehicles (origin to destination) average at around 90 minutes in both peak periods. The traffic volumes indicate that a single free-flowing lane would be sufficient for private vehicles and that the road can accommodate a dedicated public transport lane. The proposal to be evaluated is the provision of full-time public transport lanes on both sides of Victoria Road, from Christian Barnard Street to the N2 off-ramp. To provide maximum travel time and reliability benefits, it is proposed that the existing Bus Lane be moved to the centre of the road and to bar all right turns from side roads except at the intersections with major side roads. The road is wide enough to temporarily accommodate the provision of regular public transport stops (spacing depending on requirements and physical restrictions) on the left of the lane. This can be achieved by stopping the parking lane where required and diverting the driving lane to the left-hand kerbside (i.e. where the parking lane would have been) over the length of the public transport stop. Planters and other temporary tactical urban design features can be used to enhance the stop's visibility and usability. 31 FINAL REPORT: Fast-tracking public transport priority: investigating the potential of Tactical Transit Lanes in mitigating the impact of COVID-19 in cities in Sub-Saharan Africa With the TTL in the centre, left-in, left-out turns can be allowed to and from side streets. The grid-like layout of roads, a lightly used and wide Newmarket Street which runs parallel to this road as well as the number of signalised intersections along Victoria Road should help the acceptance of this proposal (see Figure 13). For this pilot, cones or temporary plastic barriers would be the preferred method of demarcation for the public transport lanes. It is notable that in sections where there are breaks in the central reserve concrete barriers have currently been positioned to prevent u-turners (see Figure 13). Similar responses may be required for this proposal as well (see below). Planning considerations • Partnerships/ project team – the project team would need to consist of City officials, business representatives, the politically recognised local area improvement body, urban activists, law enforcement, public transport operators and, possibly, urban specialists; • Parking – parking needs to be provided off-street on adjacent roads which may become more amenable to parking manoeuvres with the proposal, and along Victoria Road where there is sufficient width to accommodate three lanes; • Access/ loading – the few businesses impacted by this proposal would need to gain access for loading at the rear or on adjacent streets; • Goals/ types – the obvious goal for this proposal is to decrease public transport travel times and thus person throughput per hour; • Design considerations – apart from the nature of the temporary lane demarcations, consideration needs to be given to the side streets and public transport stop positions and layout. As stated above, left-in/leftouts are proposed to be allowed and all movements at the major intersections with Church Street, Salt River Road, Roodebloem Road, Durham Road and others if deemed necessary. Such closures and proposals for temporary public transport stops would need further, more detailed review and consultation. Bus gates, preferably automated would be the proposed solution to deter non-transit vehicles from using the TTL. Again, for a pilot, an affordable temporary parking gate type option would suffice. Also, although not evaluated as such, signal timings in both peaks could be adjusted to favour public transport; • Enforcement – the bus gates proposed (either temporary or permanent) above should help reduce the need for the presence of law enforcement officers to a minimum; • Other vehicle access – the TTL should be used for all public transport, although bicycle access would also be of value; • Pilot period – a pilot of at least two weeks (full-time) is required to provide normalised and representative data. This period should be outside of the main holiday times; • Public engagement, messaging, costs, and funding are not addressed here, but would need to be considered prior to any implementation. 32 FINAL REPORT: Fast-tracking public transport priority: investigating the potential of Tactical Transit Lanes in mitigating the impact of COVID-19 in cities in Sub-Saharan Africa Figure 14: Cape Town - cross-section of existing and proposed TTL on Victoria Road Assessment Again, despite proposing a full-time intervention, a modelling assessment was undertaken for the evening peak period, outbound, which is normally the period during which the greatest number of public transport vehicles use the road. Assuming free-flow travel with some friction because of signalised intersections, a time saving of around 15- 18 minutes could be attained in both peaks through this intervention. This saving could, of course, be increased by adjusting signal times. summarises key benefits that could be made. A summary of the key benefits that could accrue from this TTL is shown in Table 9. Even though MyCiTi buses do not currently operate on this corridor, in terms of fuel, a saving of over nearly $10,000 could be made over a year. And time of travel savings for commuters could be equivalent to 293 persons salary for a month. These savings are significant and reflect the level of reliance on public transport along this corridor and show that probably, a dedicated BRT-style dedicated right-of-way over the whole length of this corridor would probably yield higher benefits to both operators and commuters, and that this should be something eagerly pursued by the local government (whose strategy in any case is more pro-public transport). Person throughput could also increase significantly, although this implies efficiency gains that could for instance lead to a reduction in demand for 13 MBTs and four GABS buses (if passenger numbers remained constant in each peak hour). While the GABS services would benefit from this, it is not clear what impact such a change would have on the MBT industry. 33 FINAL REPORT: Fast-tracking public transport priority: investigating the potential of Tactical Transit Lanes in mitigating the impact of COVID-19 in cities in Sub-Saharan Africa Table 9: Cape Town - assessment of benefits for proposed TTL on Victoria Road Mode Possible additional person throughput during the peak hour Potential saving for operator ANNUAL (fuel only) Possible CUMULATIVE PASSENGER time of travel average cost saving/ month (salary based) MBT 183 $8,488 $50,458 GABS 152 $1,430 $47,438 MyCiTi 0 0 0 Note: Conversion rate of 15 Rand to 1 USD applied 4.3.4 Learnings from Cape Town to be applied to LIC cities The effect of the pandemic in Cape Town has been to reduce the volume of travel to workplaces by around 20% in comparison to 2019 (see Section 1.1). However, the fact that the levels of congestion on the principal and major arteries into and out of the CBD are still showing signs of similar levels of congestion as they were in 2019 (see Figure 9) shows that historic trends in terms of travel to work have continued. The lack of major change in the spatial arrangement of the city over the past decade, shown by the mapping above, means that these trends will continue for some time and that the corridors that are currently commuter routes would benefit from positive public transport interventions now. The level and extent of interventions need to allow for possible post-pandemic bounce-back of trips to work. The extensive road network, which is in good condition, is wide enough to accommodate TTLs and has the capacity to accommodate other modes either directly or via adjacent network connections. This is an important consideration in Cape Town because of the high private motorised modal share and the growing number of private vehicle owners. It may also be a factor in Kampala and Nairobi if the overall road network is likely to suffer because of the introduction of TTLs. From a road-based public transport modal share perspective, the data and experience from Cape Town shows that the cheaper, quicker, and more flexible modes will continue to thrive despite concerns about safety and security. BRT systems have proved to be expensive and have been modified to accommodate other public transport modes to form a hybrid system. (11) While conditions are different in Kampala and Nairobi, the rise in use of the boda-bodas echo the experiences of Cape Town from a flexibility perspective. The assessment of possible benefits of TTLs in Cape Town show that even though (for a SSA city) it has a relatively low public transport modal share (see Kampala and Nairobi assessments following), they are quite significant even for relatively short lengths of interventions. Possible benefits in Kampala and Nairobi should be similar or greater and therefore TTLs should be used to prove and improve public transport as extensively as possible to better inform future public transport intervention roll-out. The consequential benefits of relief of congestion and environmental benefits will also be informative in terms of overall infrastructure provision. Although not known as TTLs, traffic lanes on two sections of roads in Cape Town – Klipfontein Road and Victoria Road – are marked with a 'Bus Lane' sign (on both sides of the road). Both roads are dual 2/3-lane arterial roads. The bus lanes have the following issues in terms of operational efficiency: they allow side road access across them; • they are restricted to peak hour operations only; • they are poorly enforced; and • they do not have any operational advantage at signalised junctions. Both bus lanes are located on corridors that are busy commuter routes into and out of the city centre, and which would benefit from operational advantages that could be provided for public transport as they are heavily used and congested during peak periods. This must have been a consideration in their original implementation. However, they seem to have been left with their obvious and seemingly addressable issues listed above. A complex regulatory relationship existed historically between the National Department of Transport (NDOT), the provincial authority for the Western Cape and the metropolitan authority for Cape Town, where the provincial authority was responsible for contracted public transport and road-based transport licensing, and 34 FINAL REPORT: Fast-tracking public transport priority: investigating the potential of Tactical Transit Lanes in mitigating the impact of COVID-19 in cities in Sub-Saharan Africa rail fell under the authority of the NDOT. This line of authority still exists even though the government has awarded the status of Transport Authority to the City of Cape Town. It is notable that the main beneficiary of these lanes was GABS (now both GABS and MBTs), is contracted and managed by the Provincial sphere of government and not by the City. This, along with the City's focus on BRT, may partially explain the lack of change/public transport prioritisation on these roads in the past. Also of concern, is that over the last decade, because of the lack of government investment in the commuter rail system there has been a marked decline in the level of service offering and thus passenger numbers (see for example, (14)). The data on modal share and the slow implementation of BRT corridors, as well as the demise of rail in Cape Town, surely means that every potential gain for public transport should be quickly grasped before public transport commuters are lost to private modes. In other words, politics and large longterm plans should be carefully managed so that potential short to medium term pro-public transport benefits to the commuter are not forgotten. The fact that both bus lanes on Klipfontein and Victoria Roads that are dual two/three lane roads shows that historic thinking was along the lines of the current TTL thinking – i.e., that public transport 'priority' can be afforded on one lane while still allowing the private motorised modes capacity and flexibility to choose. However, it is evident that enforcement is vital to the success of TTLs as shown by the stakeholder responses in Cape Town, and in the findings of TTLs in the US (see (2)); if lane violations occur regularly then operators will stop using the lane or take avoidance manoeuvres, which defeats the objective and could lead to road safety issues. From experience, enforcement types such as: conventional (i.e., fines), soft (i.e., driver education), or passive (i.e., signs etc.) do not readily work in this environment. Availability and costs of resources have been challenges in Cape Town. For these reasons, as much automation as possible is preferable, where costs can be high and where job creation through projects is of lesser importance. It is also apparent that although policy frameworks and governance methods have been drawn and adapted from the Global North, similar agility (or the will) does not seem to be there in Cape Town to trial even more than a cursory pilot for the benefit of the public transport user (probably the poorest in the community). There may be other extenuating circumstances which are not immediately apparent, and it is an approach that is possibly more acceptable where public transport mode shares are relatively low, but where there is a significant reliance on public transport for the daily commute, multiple TTL or public transport-friendly options should be investigated and implemented where possible. 4.4 City 2: Nairobi 4.4.1 Transport and land-use connect Nairobi is the capital city of Kenya, and its principal economic driver. According to the Kenya Bureau of Statistics, the total population was 4.39million inhabitants in 2019, while the metropolitan area has a population of 9.4million. The average population density is 6,310 people per km2 with great variations in density across the city. In line with national trends, the city is experiencing rapid urban growth with six million inhabitants expected by 2030. (17) The core Nairobi county area covers 696km2 , but the overall Nairobi metro area covers over 32,715km2 . (17) Most wealthy Kenyans live in Nairobi, but the majority have an average to low-income level. (17) More than half of its population is estimated to live in slums which cover just 5% of the city area. (17) Unemployment is estimated at around 40% within the city, mainly in the high-density, low-income areas of the city. Walking and paratransit are the dominant modes of transportation. Nairobi's vehicle ownership rates are currently estimated to be approximately 100 per 1,000 population18 . They are low but growing, with a 67% increase in private automobiles between 2004 and 2013, (17) and need to be carefully managed if public transport interventions are proposed along key desire lines. 18 Derived from https://www.standardmedia.co.ke/entertainment/city-news 35 FINAL REPORT: Fast-tracking public transport priority: investigating the potential of Tactical Transit Lanes in mitigating the impact of COVID-19 in cities in Sub-Saharan Africa Figure 15 shows the distribution of existing land uses in Nairobi and their features. The CBD is where most businesses, government buildings, and international organisations are located. Middle-income households live in extremely dense tenements near the rectangular CBD. A long history of social segregation, where the rich live in secluded areas and the poor cluster around the CBD (Kibera, one of the world's most famous slums, is just 6km from the centre), continues, with the ongoing construction of gated communities best accessed by private car. Figure 15: Nairobi - current land use map Source: Nairobi City County (18) This form of land use, location of employment centres as well as day-to-day activities undertaken, generates the desire lines illustrated in Figure 16. Note that the desire lines show that movement in the east-west direction is significantly greater than the north-south direction. Figure 16: Nairobi - person trip desire lines in 2013 36 FINAL REPORT: Fast-tracking public transport priority: investigating the potential of Tactical Transit Lanes in mitigating the impact of COVID-19 in cities in Sub-Saharan Africa Source: World Bank, 2016 (20) Figure 17: Nairobi - overview of transport infrastructure Source: World Bank, 2016 (20) An overview of the major roads and rail transportation system in Nairobi is shown in Figure 17. Matatu routes are indicated separately as blue lines, but these are also major roads in the city. Details of the road network are provided in Table 10. Typically, lane widths are 3.7m, although many historic local roads are much narrower, possible making the latter unsuitable for TTL-style interventions unless the whole lane or street is taken over. Table 10: Nairobi - details of road network, in terms of condition and length Road Class Length Average lane widths Condition Proportion of overall Paved 7,730km 3.7m Excellent 0.2% Good 23.5% Fair 35.6% Unpaved 6,989km varies Fair 30% Poor 70% Total 14,719km Source: World Bank (20) Public transportation in Nairobi is dominated by the paratransit sector, referred to as matatus, which have a reputation for poor service quality. (21) From surveys undertaken in 2014, matatus and walking dominate 37 FINAL REPORT: Fast-tracking public transport priority: investigating the potential of Tactical Transit Lanes in mitigating the impact of COVID-19 in cities in Sub-Saharan Africa transport mode shares – 83% percent of all trips include walking as the primary or secondary mode of travel (Table 11). 40% percent of all trips are walking only, and the vast majority of which (25%) involve matatus. Only 14% of all trips are made by passenger car and 6% by motorcycle (boda-bodas). Compared with other primary African cities, Nairobi has the largest share of walking trips (19). Given the increasing purchasing power of city dwellers, growth in population, affordability, and simplicity of obtaining licenses to operate them, it is likely that the prevalence of the boda-bodas has increased significantly now. Table 11: Nairobi - number of trips by travel mode and purpose in 2014 Walk Twowheel mode Private car/taxi/truck Matatu Bus Railway Others TOTAL To Home 1,170.560 165,266 392,633 878,839 383,876 5,512 17,349 3,014,035 To Work 479,317 112,098 347,084 195,493 195,493 6,708 2,313 1,734,855 To School 470,579 37,303 49,781 150,558 150,558 1,078 13,695 911,542 Others 568,351 50,332 125,901 95,424 95,424 699 2,135 1,109,429 Total 2,688,807 364,999 915,399 825,351 825,351 14,006 35,482 6,769,861 Source: World Bank, 2016 (20) Matatus generally seat 14 to 3319. Route destinations are printed on their sides along a yellow stripe, operating on specific routes with specific route numbers. Speeds are supposed to be limited to 80 km/h. Figure 18: Nairobi City County - matatu routes Source: Google Maps, OpenStreetMap, Digital Matatus (2015) Five BRT corridors are planned for Nairobi; the contract for construction of the proposed BRT line 2 was awarded in July 2020, which runs from Ruiru (to the north-west of the city centre) to Kenyatta National Hospital in the CBD, a total of 31km. More than 100 buses, privately operated by the Nairobi Metropolitan Area Transport Authority (NaMATA), will have a capacity of 160 passengers who will use electronic payment 19 In Kenya, minibuses and medium buses are defined as matatus, whereas large buses are not. In Uganda, only minibuses are defined as matatus 38 FINAL REPORT: Fast-tracking public transport priority: investigating the potential of Tactical Transit Lanes in mitigating the impact of COVID-19 in cities in Sub-Saharan Africa means. The routes are to be on major roads (of two or more lanes), see Figure 19. Sections of Lines 1 and 3 coincide with our proposals (see proposals below). Figure 19: Nairobi - proposed BRT lines Source: http://www.namata.go.ke/documents Heavy rail systems have recently received funding and seem to be the focus of government investment. Several new railway stations (Syokimau, Donholm, Imara Daima, Kamjunji) have been constructed, as well as renovation of older ones (Ruiru, Kikuyu, Embakasi). Earlier in 2020, a new commuter rail service was launched using refurbished rolling stock from the old one metre gauge rail. The service uses the existing rail corridor and aims to serve over 230,000 passengers when fully functional. A special rail and bus service to connect the airport was introduced in November 2020. While rail only serves a small share of travellers, bus companies operate alongside boda-bodas, often competing for passengers on the same routes, while, increasing numbers of residents are acquiring cars and traveling on Nairobi's road network.82 The potential for congestion in the central business district is evident, because roads, rail, buses, and matatus all converge at the centre of the city. As all road-based public transport services are unscheduled, fares vary by mode, time of travel, distance and because of supply/demand factors. Average fares were Kenyan Shillings KES50 (approximately $0.45) per trip on minibuses (up to 5km) prior to the pandemic, however, they have increased significantly since then. For an average trip of 10 km length (based on a trip from Kibera to the government buildings in the CBD), costs for low-income earners can be more than 20% of their monthly income. While this is double the international aim/norm, fares are at a comparable level to the other SSA cities investigated. The introduction of both rail and BRT systems will impact road-based public transport demand (when fully operational), but the demand levels are high and when they will be fully operational is uncertain the extent of their impact is of significance for the introduction of TTLs because of their cheap, flexible, and agile nature. 4.4.1.1 Roads traffic levels on major arteries Surveys undertaken by JICA (18) indicate that the overall average travel time per mode and purpose in Nairobi City County (i.e., Greater Nairobi) is 47 minutes. (18) Based on an average trip length of 10km, the average trip time implies a trip speed of nearly 13km/hour. Trip speeds could therefore be substantially lower in peak or congested periods. 39 FINAL REPORT: Fast-tracking public transport priority: investigating the potential of Tactical Transit Lanes in mitigating the impact of COVID-19 in cities in Sub-Saharan Africa To ease congestion in the city, Nairobi Metropolitan Services (NMS) intended to ban matatus, from 1 December 2020, from accessing the CBD. The plan is to construct several bus terminals in the outskirts of the city. This date has come and gone and so far, nothing has happened, except the construction of new termini is underway. The rationale behind this plan is apparent from Figure 20. Figure 20: Nairobi - existing public transport routes to the CBD Source: www.Africa.itdp.org (23) Further, while Nairobi's radial links to the CBD are extensive, the arterial (inter-district) network outside the CBD is limited. Even connectivity between the central business district and its immediate surroundings is limited. As a result, traffic management in the metropolitan area is challenging and is exacerbated by the fact that there are very few signalised intersections outside the grid-like streets of the CBD. Major intersections (typically roundabouts) were not designed to accommodate the current traffic volumes Most signalised junctions are manually controlled, but not in a coordinated fashion. When congestion occurs, or intersections near the central business district are unable to serve traffic demand, vehicles have no way to bypass the congestion. Small and localised traffic incidents thus can have widespread and lasting effects. Congestion also stems from inadequate off-street parking spaces and the lack of a formal address system, which increases circulating traffic as drivers attempt to find their destinations. According to the World Bank, in 2013, the VOT lost to travel in Nairobi is estimated at $0.8million–$4million per workday. This is based on the 47-minute average travel time of a trip in Nairobi, daily time costs per capita, valued as a percentage of household income,ranging from $0.25 to roughly $4.00. (20) 40 FINAL REPORT: Fast-tracking public transport priority: investigating the potential of Tactical Transit Lanes in mitigating the impact of COVID-19 in cities in Sub-Saharan Africa Figure 21: Nairobi - typical peak period traffic levels/speeds Source: Google Maps (accessed January 2021) 4.4.2 Key considerations from stakeholder consultation Nearly 50 responses were received from the face-to-face and online stakeholder consultation undertaken in Nairobi (see Table 2). Summaries of relevant responses are outlined below. • There was an even split in opinions of operators in terms of whether the levels of traffic on roads had increased or decreased during the pandemic; • Almost all respondents had observed a decrease in the number of passengers using road-based public transport; some highlighted the launch of the new train service (see above) as a factor, whereas others thought there was a shift in working location (more people working from/at home). They also felt that fears/concerns about virus transmission meant that fewer people were travelling; • Around 75% of matatu operators engaged with said they had been forced to increase fares; • Travel time was reported to be broadly the same in both peak periods; • 80% of operators said they are making fewer trips to the CBD; • 80% of respondents were in support of TTLs; • Challenges with TTLs were thought to be problems with dropping and alighting passengers, that TTLs would be temporary and therefore there would be a return to 'normal' after a trial, and intrusion of private vehicles in the lane (i.e., enforcement); • 6% of respondents stated that they would prefer any TTL to be in-force throughout the day (i.e., 24/7); • All respondents expressed a preference in terms of routes for interventions. These were reviewed and a final selection made as discussed in the following section. 41 FINAL REPORT: Fast-tracking public transport priority: investigating the potential of Tactical Transit Lanes in mitigating the impact of COVID-19 in cities in Sub-Saharan Africa Stakeholders did not mention that school closures could be a factor behind the reduced passenger numbers. 4.4.3 Corridor selection, intervention type, and analysis From the preferences indicated by stakeholders, and using local knowledge and expertise, a final selection of three routes is presented in Figure 22. They are broadly based on the following: • Number of vehicles that ply the routes; • Stakeholder engagement with the matatu sector, transport professionals, and NMS; • Proposed interventions by NMS with new upcoming termini and possible removal of paratransit vehicles from the CBD; • Suitability of the corridors for TTLs; • Restriction of use by all boda-bodas; and • Upcoming BRT Development on Thika Superhighway. To confirm the viability of proposals, physical on-street observations were undertaken, and corroborated where this was not possibly by use of the Google Maps Street View function. Proposals were also crossreferenced with the Nairobi Integrated Urban Development Plan. (19) Figure 22: Nairobi - proposed routes for TTLs 4.4.3.1 Corridor 1: Mombasa Road/Uhuru Highway This three-lane road is currently undergoing transformation with the development Nairobi Expressway, which serves as an urban road, an inter-regional, and an international highway. Several public transport routes run along the section closest to the CBD. These originate from Mombasa Road, Langata Road and other middle income residential neighbourhoods like South B and South C, whose populations have grown recently to over 42 FINAL REPORT: Fast-tracking public transport priority: investigating the potential of Tactical Transit Lanes in mitigating the impact of COVID-19 in cities in Sub-Saharan Africa 100,000 people. The use of this road by public transport vehicles is significant; for example, a study by ITDP20 while developing the service plan of the BRT Line one indicated that Route 15 matatus (from middle-class Langata Estate to the CBD) operate at almost one vehicle per minute in the peak. In total, surveys indicated that 173 public transport vehicles used this road per hour, throughout the day, with most vehicles being on the road during morning and evening peak hours (7am to 8:30am and 5pm to 7pm) – these include 51-seater buses, 33-seater minibuses, and 14-seater vans within the peak. The road is known to experience traffic congestion most of the day. The developments of Green Park Terminus at the Haile Selassie/Uhuru Highway junction and Workshop Road Terminus are expected to open in early 2021. This development will deliver time and cost savings, as users will not need to travel via the CBD to access either the Railways PSV Terminus or the Central Bus Station. Green Park will have a capacity for 110 vehicles and will use an app-based scheduling system to enable drivers to know when their vehicles should access the pick-up points. This is different from the current system where vehicles line up and leave termini when they fill to their legal capacity. Taking due cognisance of the above modifications, a TTL is proposed from the Eastern By-Pass Junction to Green Park Terminus (former Railway's Sports Club), over 11km in length. The preferred method of achieving a TTL along this corridor is to segregate both inbound and outbound kerbside lanes (see Figure 23 for a typical bus stop) by using temporary longitudinal barriers (plastic or concrete, such as those used during road construction) which should be retained throughout the duration of the pilot. Compliance is generally a challenge in the city and thus a police officer or traffic marshal will be required. Figure 23: Nairobi - image of typical bus stop Source: Google Maps (accessed January 2021) Benefits would be accrued even if this TTL were only operational during 7am to 9am CBD-bound and away from the CBD from 5pm to 7pm. This would require significant resourcing to place and remove barriers every day and may cause some confusion, albeit temporarily, in motoring habits or travel patterns. A 24/7 operation may therefore be preferable if politically acceptable. Current average trip times from surveys undertaken and subsequently corroborated using Google Map's typical traffic travel time, for the section of the intervention, were 70 minutes in the morning peak and 50 minutes in the evening peak. Free-flow travel times for this section were 12-18 minutes. The intervention should provide benefits in terms of travel time savings, less waiting time, more predictable journey times, ability for larger buses to be used more, thus cost of travel to commuters may come down if they use this mode (especially if its quicker than now). Importantly, the intervention will offer an opportunity to evaluate the impact of the proposed BRT route. 20 https://africa.itdp.org/planning-nairobis-bus-rapid-transit-system/ 43 FINAL REPORT: Fast-tracking public transport priority: investigating the potential of Tactical Transit Lanes in mitigating the impact of COVID-19 in cities in Sub-Saharan Africa Planning considerations • Partnerships/project team – the project team would need to consist of NMS/City officials, business representatives, NaMATA, Kenya Highway Authority, Kenya Roads Authority, urban activists, cycling advocates, law enforcement, public transport operators and, possibly, urban specialists; • Parking – there is no parking along this route; • Access to other modes – given the volume of vehicles on this route, it would not be prudent to share the lane with cyclists; • Goals/ types –to decrease public transport travel times and thus person throughput per hour. Although the length of intervention is short, current travel times over this section are in the order of an hour; • Design considerations – apart from the nature of the temporary lane demarcations, consideration needs to be given to entry points for neighbourhoods, the main road intersections which need to be kept fully operational. Bus gates, preferably automated, would be the proposed solution to deter non-transit vehicles from using the TTL. For a pilot, an affordable temporary parking gate type option would suffice; • Enforcement – the bus gates proposed (both temporary and permanent) above should help reduce the need for the presence of law enforcement officers to a minimum; • Other vehicle access – the TTL should be used for all public transport, except for boda-bodas. This may be politically difficult and cause additional unwanted enforcement issues but evaluation information from here and other similar trials could provide data that would assist in reformation of the industry; • Pilot period – a pilot of at least two weeks (full-time) is required to provide normalised and representative data. This period should be outside of the main holiday times; • Public engagement, messaging, costs, and funding are not addressed here, but would need to be considered prior to any implementation. Figure 24: Nairobi - existing and proposed cross-sections for Mombasa Road/Uhuru Highway 44 FINAL REPORT: Fast-tracking public transport priority: investigating the potential of Tactical Transit Lanes in mitigating the impact of COVID-19 in cities in Sub-Saharan Africa Assessment Despite the proposal of full-time intervention, a modelling assessment was undertaken for the morning peak period which is normally the period during which the greatest number of public transport vehicles use the highway and when a TTL could be most beneficial. The results show potential significant additional passenger throughput, fuel cost saving annualised, and cumulative average value of time costs saved for passengers (see Table 12). Additional passenger numbers in the peak may be an oversimplification of the method, as it is not clear whether this level of demand will exist and during this peak hour period. Nevertheless, it is indicative of the enormous level of public transport demand on this corridor, and that the time savings to be accrued are more than worthwhile for a pilot of this nature to be undertaken. Table 12: Nairobi - assessment of proposed TTL on Mombasa Road Mode Possible additional person throughput in the peak hour Potential saving for operator Annual (fuel only) Possible Cumulative Passenger time of travel average cost saving/ month (salary based) Matatu 123 $43,680 $62,000 Matatu (medium) 246 $72,818 $124,465 Boda-boda 400 $0 $6,315 Bus 614 $285,000 $310,000 Note: Based on conversion rate of 1 USD = 110 Kenyan Shillings 4.4.3.2 Corridor 2: Jogoo Road Jogoo Road is a busy corridor that is surrounded by old lower-income council housing (examples include Kaloleni, Shauri Moyo, Bahati, Makadara and Mbotela). It also gives access to Uhuru, Jericho and Buruburu. Jogoo Road is mostly a two-lane dual carriageway with a grassed central reserve that segregates the directions of travel. It connects the CBD periphery to Eastlands and the industrial areas. In parts it is a threelane road and there are many lay-bys for buses and side road accesses to fuel stations and informal markets. It is a key corridor for operators who ply Eastlands routes (Eastlands has several lower- and middle-income residential estates as well as informal settlements). The bulk of Nairobians live in Eastlands. The corridor also provides critical access to Muthurwa Bus Terminus, located on the outskirts of the CBD, which is proposed to be the terminus for Eastlands matatus (when complete in 2021) as part of the Nairobi Metropolitan Services on-going programme to decongest the CBD of Nairobi. As one of the busiest corridors, it also has many pedestrians walking along it and provides access to a commuter railway station (Makadara). Currently levels of traffic in the evening peak are approximately 2,000 vehicles per hour. Of these, excluding boda-bodas, other public transport vehicular share was 40% and private vehicles 58%. A TTL along Jogoo Road, from LungaLunga Road Junction to City Stadium Roundabout after which vehicles would travel to the Muthurwa Bus Stage, would provide significant benefit to public transport and its users. The TTL would total 4.7km in length and would need to be on both kerbside lanes of the road to enable continued access to commuters from adjacent bus stops. The preferred method of achieving a TTL along this corridor would also be to demarcate public transport lanes by using temporary longitudinal barriers which should be retained all-day and throughout the duration of the pilot. Full access to the major road intersections would be continued but may need to be reviewed to ensure effectiveness. Similarly, gaps in the central reserve may also need to be closed off in the event of unwanted friction in the TTL lane. 45 FINAL REPORT: Fast-tracking public transport priority: investigating the potential of Tactical Transit Lanes in mitigating the impact of COVID-19 in cities in Sub-Saharan Africa Planning considerations From a planning perspective, a brief overview of the considerations that need to be made prior to piloting such a project and some suggestions would be: • Partnerships/project team – the project team would need to consist of NMS/City officials, NaMATA, Kenya Urban Roads Authority, business representatives, urban activists, cycling advocates, law enforcement, public transport operators and, possibly, urban specialists; • Parking – there is no parking along this route; • Access to other modes – none given the volume of vehicles on this route; • Goals/ types –to decrease public transport travel times and thus person throughput per hour. Although the length of intervention is short, current travel time over this section is in the order of 30 minutes; • Design considerations – apart from the nature of the temporary lane demarcations, consideration needs to be given to the main road intersections which need to be kept fully operational; • Enforcement – the bus gates proposed (both temporary and permanent) above should help reduce the need for the presence of law enforcement officers to a minimum; • Other vehicle access – it is envisaged that the TTL should be used for all public transport, except again for boda-bodas; • Pilot period – a pilot of at least two weeks (full-time) is required to provide normalised and representative data. This period should be outside of the main holiday times; • Public engagement, messaging, costs, and funding are not addressed here, but would need to be considered prior to any implementation. 46 FINAL REPORT: Fast-tracking public transport priority: investigating the potential of Tactical Transit Lanes in mitigating the impact of COVID-19 in cities in Sub-Saharan Africa Figure 25: Nairobi - existing and proposed cross-sections for Jogoo Road Assessment Despite the proposal of a full-time intervention, an assessment was undertaken for the evening peak period which is the period during which the greatest number of public transport vehicles use the road and when a TTL could be most beneficial. Average trip times from surveys undertaken and subsequently corroborated using Google Map's typical traffic travel time for the section of the intervention only were around 35 minutes in the morning peak and 40 minutes in the evening peak. Free-flow travel times for this section were 6 minutes, meaning that a travel time saving of between 29-34 minutes could be achieved (depending on volumes of public transport vehicles/ pick-up and drop-offs) if free-flow type conditions could be achieved along this intervention. However, given the number of accesses off Jogoo Road and breaks in the central reserve to allow right-turning, it is unlikely that free-flow conditions would be achieved. A reduced time saving is therefore considered in the assessment of benefits. The results show that there would be potential significant additional passenger throughput, fuel cost saving annualised, and cumulative average value of time costs saved for passengers with the introduction and successful operation of the proposed TTL (see Table 13). The number of additional passenger numbers in the peak may be an oversimplification of the method as it's not clear whether this level of demand will exist and during this peak hour period. But it is an indication of the enormous level of public transport demand on this corridor and that the time savings to be accrued are more than worthwhile for a pilot of this nature to be undertaken. 47 FINAL REPORT: Fast-tracking public transport priority: investigating the potential of Tactical Transit Lanes in mitigating the impact of COVID-19 in cities in Sub-Saharan Africa Table 13: Nairobi - assessment of proposed TTL on Jogoo Road Mode Possible additional person throughput in the peak hour Potential saving for operator annual (fuel only) Possible cumulative passenger time of travel average cost saving/ month (salary based) Matatu 100 $13,700 $47,533 Matatu (medium) 957 $108,818 $454,667 Boda-boda 171 $0 $1,435 Bus 157 $27,982 $74,400 Note: Based on conversion rate of 1 USD = 110 Kenyan Shillings 4.4.3.3 Corridor 3: Haile Selassie/Ngong Road Like public transport vehicles using the Mombasa Road/Uhuru Highway, public transport vehicles along this route are expected to terminate at Green Park Terminus once it is complete. The corridor is used by vehicles from Ngong, Naivasha Road and Mbagathi Way. Several vehicles from Argwings Kodhek/ Gitanga Road also use this corridor as they terminate their journey in the CBD. A section of this corridor is proposed to be part of two BRT lines (Line 2 to Kenyatta National Hospital and Line 3 to Agricultural Society of Kenya Showground). A pilot along a short section of this road, from the City Mortuary roundabout to Green Park Terminus (former Railways Sports Club) 1.8km is proposed for a TTL. This should provide incredibly useful planning data for the BRT/ corroborate some of the assumptions or modelling undertaken by ITDP21 for the BRT proposals. It is also the most congested part of the road leading to the CBD. An average of 225 buses and matatus per hour were surveyed throughout the day along this corridor. Average trip times from surveys undertaken and subsequently corroborated using Google Maps typical traffic travel time, for the section of the intervention were between 14-16 minutes in the morning peak and the same in the evening peak. Free-flow travel times for this section were 4-minutes, meaning that a time saving of up to 12 minutes could be made with the introduction of a TTL, provided a free-flowing environment could be created. However, access does need to be provided to major side road connections. As with the previous proposals, the preferred method of achieving a TTL along this corridor would be to demarcate the TTL on both kerbsides by using temporary longitudinal barriers which should be retained aa day. Planning considerations • Partnerships/ project team – the project team would need to consist of City officials, business representatives, the NMS, NaMATA, KURA, urban activists, cycling advocates, law enforcement, public transport operators and, possibly, urban specialists; • Parking – there is no off-street parking although provision needs to be reviewed and the corridor may need to be either maintained or modified; • Access to other modes – given that there is already an on-street but segregated cycle lane further west from the section under consideration, it may be prudent to continue the lane and share the road with cyclists; • Goals/ types – the obvious goal for this proposal is to decrease public transport travel times and thus person throughput per hour. Although the length of intervention is short, and therefore benefits will be less marked; 21 https://africa.itdp.org/planning-nairobis-bus-rapid-transit-system/ 48 FINAL REPORT: Fast-tracking public transport priority: investigating the potential of Tactical Transit Lanes in mitigating the impact of COVID-19 in cities in Sub-Saharan Africa • Design considerations – apart from the nature of the temporary lane demarcations, consideration needs to be given to the main road intersections which need to be kept fully operational. Also, access to and from the Kenyatta National Hospital. For a pilot, an affordable temporary parking gate type option would suffice as a bus gate; • Enforcement – the bus gates proposed (both temporary and permanent) above should help reduce the need for the presence of law enforcement officers to a minimum; • Other vehicle access – the TTL should be used for all public transport; • Pilot period – a pilot of at least two weeks (full-time) is required to provide normalised and representative data. This period should be outside of the main holiday times; • Public engagement, messaging, costs, and funding are not addressed here, but would need to be considered prior to any implementation. Figure 26: Nairobi - existing and proposed cross-sections for Haile Selassie/Ngong Road Assessment Despite the proposal of full-time intervention, a modelling assessment was undertaken for the morning peak period which is normally the period during which the greatest number of public transport vehicles use the highway and when a TTL could be most beneficial. 49 FINAL REPORT: Fast-tracking public transport priority: investigating the potential of Tactical Transit Lanes in mitigating the impact of COVID-19 in cities in Sub-Saharan Africa Despite the relatively short length of the proposed intervention, the results show potential significant additional passenger throughput, fuel cost saving annualised, and cumulative average value of time costs saved for passengers (see Table 14). Additional passenger numbers in the peak may be an oversimplification of the method as it's not clear whether this level of demand will exist and during this peak hour period. But it is an indication of the enormous level of public transport demand on this corridor and that the time savings to be accrued are more than worthwhile for a pilot of this nature to be undertaken. Table 14: Nairobi - assessment of proposed TTL on Haile Selassie/Ngong Road Mode Possible additional person throughput in the peak hour Potential saving for operator annual (fuel only) * Possible cumulative passenger time of travel average cost saving/ month (salary based) Matatu 31 $4,050 $17,567 Matatu (medium) 105 $11,535 $60,243 Boda-boda 100 $0 $574 Bus 42 $7,306 $24,283 Note: Based on conversion rate of 1 USD = 110 Kenyan Shillings 4.5 City 3: Kampala 4.5.1 Transport and land-use context Kampala is the largest urban area of Uganda, and its capital city. It accounts for over 80% of the country's industrial and commercial activities and generates around 65% of the national GDP. (23) The city covers an area of 189km2 . However, when the surrounding areas in Greater Kampala Metropolitan Area (GKMA) are taken into consideration, the area extent of GKMA increases to 1,000 km2 . (24) In Kampala city, the highly urbanised area has a spatial extent of 23% while 60% is peri-urban and the remaining is rural. It is a home for an estimated 1.75million residents but has an estimated working population of 4.5million. Annual population growth rates are estimated to be up to 5.2% per annum, (23) implying that by 2030 there will be nearly 3million inhabitants. Unless land-use patterns adjust appropriately, employment will mean a working population of approximately 7.3million people. These levels of growth will be difficult to accommodate within the current structure of the city and will inevitably lead to urban sprawl. Further, as inhabitants in Kampala generally have a low standard of living – over 30% are not economically active and over 35% of paid employees earn less than the median wage of UGX270,000 (75$) per week (23) – with the increasing demand and sprawl forecast, living and transport costs will inevitably increase to a significant proportion of average income. The Multi-Modal Urban Transport Master Plan for Greater Kampala Metropolitan Area (GKMA) (23) estimates the number of private cars in the metropolitan area as 'over 220,000' and 55 vehicles for every 1,000 people in the GKMA. This is low level of motorisation for a city of this size and indicates a significant reliance on walking or public transportation for daily needs – borne out by survey data. A general classification of the types of land uses in Kampala (see Table 15) shows that only around 13% is used either commercially, for industry, or for institutional uses. These are the main trip attractors for the city. Industrial areas are located to the north-west of CBD, whereas institutional uses are in all four corners of the city. Employment in Kampala is highly concentrated in the area surrounding the CBD, while residential areas are evenly spread throughout the city. However, Kampala Capital City Authority (KCCA) identified approximately 31 slums (high density residential areas) concentrated in an inner ring around the city centre and an outer ring on the fringe of the Inner City. (24) Figure 28 shows that the densest residential areas are close to the north and south of the CBD. Average trip distances to workplaces are therefore likely to be on the lower side 50 FINAL REPORT: Fast-tracking public transport priority: investigating the potential of Tactical Transit Lanes in mitigating the impact of COVID-19 in cities in Sub-Saharan Africa (less than 10km) of the three cities investigated, given the size of Kampala and the proximity of the dense residential areas to places of work. Table 15: Kampala - 2011 land-use data Land use category Land use (Ha) Percentage (%) Commercial 820 3.8 Environmental 2,503 11.7 Industrial 799 3.7 Institutional 1,156 5.4 Open green / recreational 2,349 11.0 Residential 13,670 63.9 Utility / transportation 84 0.4 Total 21,380 100.0 Source: KCCA, 2012 (24) 51 FINAL REPORT: Fast-tracking public transport priority: investigating the potential of Tactical Transit Lanes in mitigating the impact of COVID-19 in cities in Sub-Saharan Africa Figure 27: Kampala - current land use map Source: KCC, 2003 (26) 52 FINAL REPORT: Fast-tracking public transport priority: investigating the potential of Tactical Transit Lanes in mitigating the impact of COVID-19 in cities in Sub-Saharan Africa Figure 28: Kampala - Population and employment densities per area Source: Bird and Venables, 2020 (27) 4.5.2 Overview of the transport system Kampala City has a road network length estimated at 2,110km long, of this about 1,500km is unpaved. Further, 62% of paved roads and 73% of unpaved roads are described as being in fair to good condition, leaving only around 380km of paved roads in a daily usable condition. (21) In addition, most of the major road intersections are roundabouts and are classified by the roads authority as being 'always congested'. (25) Official figures from the KCCA indicate that the current modal share is about 42.4% boda-bodas, 21% paratransit (which include matatus), and 36.6% private cars. Matatus carry approximately 83% of passengers, boda-bodas 8%, and cars 9%. Around 90% of streets in the CBD have moderate or heavy pedestrian activity. Over the past decade there has been a significant growth in the number of minibuses and boda-bodas in the city. KCCA estimate that in 2018, 588 39-seater buses, 1,165 29-seater buses, 120,760 14-seater taxis and over 500,000 boda-bodas were registered and operate within the region. There are also around 2,100 private or special-hire taxis. (23) Details of the gazetted location and number of commercial public transport vehicle stages and parks are published by KCCA (23). This shows that in central Kampala, there are 16 parks (or termini) and 120 stages (excluding taxi ranks). Of these, the Old Taxi Park has the largest capacity, at over 8,800 taxis. The New Taxi Park has recently been created to provide additional capacity and relieve congestion at the Old Taxi Park. Overall, these stages and parks serve over 122,000 registered (in Kampala) commercial matatus and buses, (23) which explains the levels of congestion in the central area and shows that any intervention that helps public transport flows should be of primary concern. 53 FINAL REPORT: Fast-tracking public transport priority: investigating the potential of Tactical Transit Lanes in mitigating the impact of COVID-19 in cities in Sub-Saharan Africa Figure 29: Kampala City road network, 2019 Source: KCCA, 2019 (23) 54 FINAL REPORT: Fast-tracking public transport priority: investigating the potential of Tactical Transit Lanes in mitigating the impact of COVID-19 in cities in Sub-Saharan Africa Figure 30: Kampala - Images of transport in Kampala City (before the pandemic) Sources: KCCA ED's Presentation (2nd Annual IGC Cities Research Conference, 2016) In addition to the taxi stages, there are also 579 approved boda-boda stages in seven gazetted public and private commuter taxi parks, and over 20 bus terminals in Kampala City. KCCA has recently developed a minibus route rationalisation strategy to improve traffic flow in the city provide better more focused public transport services along all routes and reduce overtrading on certain routes especially during peak periods. 4.5.2.1 Details of the regular daily road-based public transport system Even though public transport has the highest motorised transport share, it is still grappling with numerous challenges that include a relatively low level of service, a lack of defined trip schedules, no formal stops or fares, terminals which are unregulated, and vehicles that are old, polluting, and prone to breakdowns. And although a fixed route schedule is provided in Figure 31, routes can be changed by drivers during operations due to limited enforcement. In addition, the taxi colour coding according to routes and enforcement of the mobility plan is still pending the issuance of a statutory instrument by the Ministry of Works and Transport. Further, because public transport fares can vary by distance, time, and mode used, average fares reported by stakeholders range from UGX 5,000-7,000 ($1.34-1.89) per trip. If used monthly, this equates to about 30% of the average workers monthly income, which is significantly greater than the international goal of 10% of income. 55 FINAL REPORT: Fast-tracking public transport priority: investigating the potential of Tactical Transit Lanes in mitigating the impact of COVID-19 in cities in Sub-Saharan Africa Figure 31: Kampala - public transport routes Source: www.kcca.gov.ug accessed December 2020 4.5.2.2 Roads traffic levels on major arteries Traffic congestion is a rapidly increasing problem in Kampala due to a combination of poor road conditions, uncontrolled intersections, and insufficient capacity to meet the increasing pedestrian and vehicular traffic caused by the growing population. The situation is exacerbated by the low paved road coverage (a significant proportion of which are dilapidated), limited sidewalk provision, and the use of unpaved roads that are a source of mud and dust in sections of the city. (28) 56 FINAL REPORT: Fast-tracking public transport priority: investigating the potential of Tactical Transit Lanes in mitigating the impact of COVID-19 in cities in Sub-Saharan Africa Figure 32: Kampala - typical traffic levels, afternoon peak Source: Google Maps (accessed December 2020) Figure 33: Kampala - Image of traffic congestion (before the pandemic) Source: www.newvision.co.ug. Accessed December 2020 The images above (Figure 32 and Figure 33) indicate the extent of traffic issues in Kampala daily, despite the high levels of public transport usage and walking in comparison to the Global North. The relatively lightly used roads peripheral to the CBD areas are clear from these images and show the monocentric nature of Kampala. Many reports on congestion lay the blame on, inter alia, poor driving, poor road conditions allied to bad drainage, and even learners being allowed to use major roads in the peak period22 . Matatus and boda-bodas are seen as the problem by KCCA, which proposes using bigger buses (BRT) and light rail to solve the issue23 . A 22 For example see: https://www.bbc.co.uk/news/magazine-19716687 23 https://www.reuters.com/article/us-uganda-transportation-cities-trfn/hit-the-brakes-on-reform-say-kampalas-transport-workersidUSKBN23X1FG 57 FINAL REPORT: Fast-tracking public transport priority: investigating the potential of Tactical Transit Lanes in mitigating the impact of COVID-19 in cities in Sub-Saharan Africa congestion levy is also being considered by government and was proposed in 2019. Improvement of junctions with signals is also being considered24 . However, it seems more likely that the levels of congestion that occur throughout the day are because of the combination of a relatively small, paved road network (approximately 380km in usable condition), carrying 450,000 vehicles mainly to the areas of most economic activity in Kampala (the CBD). It is also likely that the location of the main public transport parks in the CBD, the lack of a coordinated PT provision strategy, the usage of these parks, lack of a dedicated public transport corridor system, as well as the increased roadside parking due to shortage of private car parking space within the CBD, are significant contributory factors. The high dependency of the public transport system on the low-capacity matatus and boda-bodas is also a significant casual factor. An expansion of the road network would be challenging because of the possible legal difficulties in acquiring rights to build roads, most of which have structures built up the road edge (i.e. there is little or no land reserved on existing road corridors (some which are only 9m or less, as evidenced on Google Maps). A recent attempt by the government to pass such a right in the Ugandan Roads Bill, 2018, was rejected by parliament because of the difficulties it presented25 . As a result, travel time by public transport can be 50 minutes or more for the average commute within Kampala, or 80 minutes from the Greater Kampala Municipal Area (GKMA) (see Table 16). Public transport vehicle speeds can therefore be 10km/h or less. Speeds are also reported to be considerably worse during rainy periods. Table 16: Kampala - travel times by public transport Trip Origin Destination Transport Mode Estimated travel time From within CBD Work place within CBD Public transport 25 minutes From within Kampala Work place within CBD Public transport 50 Minutes From GKMA Work place within CBD Public transport 80 Minutes Source: Multi-modal Urban Transport Master Plan for GKMA (23) Infrastructure plans currently being executed or proposed by KCCA and Uganda National Roads Authority (UNRA) to improve transportation of people are indicated diagrammatically in Figures 33 to 36. Notable among these plans include construction of expressways and flyovers, improvement and signalisation of junctions, implementation of MRT, LRT and BRT systems, and development of a walking and cycling network. Timescales are clearly dependent upon availability international development agency grants or loan financing. No improvements are envisaged within 2021, and therefore for the purposes of this study and proposals they are only taken into consideration if they coincide with our thinking of possible pilot routes for TTLs. 24 https://www.busiweek.com/kampala-city-to-introduce-a-congestion-levy-to-reduce-jam/ 25 https://www.monitor.co.ug/uganda/news/national/parliament-passes-roads-bill-rejects-reserve-expansion-1826136 58 FINAL REPORT: Fast-tracking public transport priority: investigating the potential of Tactical Transit Lanes in mitigating the impact of COVID-19 in cities in Sub-Saharan Africa Figure 34: Kampala - planned MRT and LRT corridors Source: KCCA, 2018 (25) Figure 35: Kampala - planned BRT routes Source: KCCA, 2012 (24) 4.5.3 Key considerations from stakeholder consultation In contrast to the official statistics in relation to modal share, results from our stakeholder consultation indicated that most respondents used 14-seater minibuses (paratransit) (58%), followed by boda-bodas (19%), and buses (also paratransit) (13%). 59 FINAL REPORT: Fast-tracking public transport priority: investigating the potential of Tactical Transit Lanes in mitigating the impact of COVID-19 in cities in Sub-Saharan Africa Frequency of usage has decreased since the outbreak of the pandemic – 39% of respondents claim to only use public transport once-in-a-while, because of a limited supply of 14-seater minibuses (and thus longer wait times), limited or no services in the evening, as well as the ability to work from home. Overall, the respondents were positive about the possible introduction of TTLs in Kampala. Potential benefits mentioned by respondents included mitigation of congestion, more reliable travel time, and a possible reduction of fares. Challenges included lack of enforcement and therefore abuse of dedicated lanes, insufficient road widths, longer wait times for buses to fill up, and the need to use other means of transport to get to the bus stations. There is no official data about mode changes due to the pandemic, but stakeholders' responses confirm that as observed, there is an increase in the number of people walking especially in the evening peak hours (mainly because taxis do not return to the city centre to beat the 9pm curfew). Some people also cannot afford the fares, even if taxis are available. The use of boda-bodas has also increased, mainly because they are considered safer than most taxis (in terms of physical distancing, and buses which are not complying with health protocols, and because most passengers stopped wearing face masks). Boda-bodas are also more readily available in the peak hours compared to taxis. 4.5.4 Corridor selection, intervention type, and analysis Stakeholders were invited to express their preferences for possible TTLs. From these and from our local expertise and taking due regard of constraints and the transport environment in general, the following corridors were put forward for more detailed investigation and assessment using our spreadsheet methodology (see Figure 36). Figure 36: Kampala - location of proposed TTLs 4.5.4.1 Corridor 1: Jinja Road (Access Road – Nakawa) Jinja Road runs from Kampala city to Jinja city, 83km from Kampala and the source of the Nile. It is mainly a two-lane dual carriageway with 3m lanes and a 0.5-3m solid/planted central reserve island. The section considered suitable for the introduction of a TTL is from Access Road in Kampala to Nakawa, approximately 2.5km in length, as it is a three-lane road along this section. 60 FINAL REPORT: Fast-tracking public transport priority: investigating the potential of Tactical Transit Lanes in mitigating the impact of COVID-19 in cities in Sub-Saharan Africa Surveys undertaken in 2019 (23) show that outbound traffic levels in the morning peak are 2,344 per hour and 2,046 per hour in the evening peak hour. Inbound volumes are 1,878 vehicle per hour in the morning and 1,030 vehicles per hour in the evening. The public transport vehicle modal share averages out at around 80% (including boda-bodas), with a significant increase in the percentage of matatus and 'medium buses' 26 in the outbound direction when compared to the inbound in the morning peak. Matatu and medium buses frequencies vary during the day and even in the peaks, with more services being provided in the morning peak by both modes. Boda-bodas are reasonably and consistently frequent throughout the day, but with a marked increase in the evening in the outbound direction and in the morning peak in the inbound direction; this pattern is largely because of a need to reduce journey time in the morning and a lack of other reliable public transport in the evening. Figure 37: Kampala - Images of the Kampala to Jinja Road Sources: KCCA ED's Presentation (2nd Annual IGC Cities Research Conference, 2016) and Google Maps (accessed December 2020) Jinja Road runs along the high-density employment industrial area in Kampala, Makerere University Business School, which attracts many student commuters, the prominent Lugogo shopping mall and Kyadondo rugby grounds and the proposed section for the TTL ends at Nakawa market, one of the largest fresh produce markets in Kampala. Jinja Road is also one of the proposed BRT corridors, and there is a planned Kampala– Jinja Expressway to ease congestion along this corridor. Average trip times from surveys undertaken and subsequently corroborated using Google Maps show a typical traffic travel time for the section of the intervention at between 14-16 minutes in the morning peak and around 35 minutes in the evening peak. Free-flow travel times for this section were four minutes, meaning that a time saving of up to 21 minutes could be made in the evening with the introduction of a TTL, provided a free-flowing environment could be created. However, access does need to be provided to major side road connections. The proposed method of achieving a TTL along this section of the road is to manually segregate it from the other lanes using longitudinal barriers which should be retained throughout the day. Plastic or concrete new jersey barriers are proposed as they have been effective in segregating traffic during road works. Traffic cones can also be adopted to achieve separation. The existing and proposed cross-sections of Jinja Road from Access Road to Nakawa (Nakawa Market) are as shown below. The road cross-sections along the length of the different corridors proposed for implementation of TTLs vary highly depending on the land use, alignment, and road condition. General cross-sections of the existing and proposed road corridors have therefore been presented Planning considerations • Partnerships/ project team – the project team would need to consist of City officials, business representatives, the KCCA, urban activists, law enforcement, public transport operators and, possibly, urban specialists; 26 The term Matatu in Nairobi is used to refer to all paratransit modes, including buses. In Kampala a distinction is drawn between Matatus and medium/large buses 61 FINAL REPORT: Fast-tracking public transport priority: investigating the potential of Tactical Transit Lanes in mitigating the impact of COVID-19 in cities in Sub-Saharan Africa • Parking – there is no parking along this route; • Goals/ types – the obvious goal for this proposal is to decrease public transport travel times and thus person throughput per hour. Given the high percentage of PT vehicles, the proposal should not inadvertently give priority to private vehicles by forcing all PT into the TTL is paramount; • Design considerations – apart from temporary lane demarcations, consideration needs to be given to the main road intersections which need to be kept fully operational. Bus gates, preferably automated, would be the proposed solution to deter non-transit vehicles from using the TTL. For a pilot, an affordable temporary parking gate type option would suffice; • Enforcement – the bus gates proposed (both temporary and permanent) above should help reduce the need for the presence of law enforcement officers to a minimum; • Other vehicle access –the TTL should be used for all public transport, including boda-bodas; • Pilot period – a pilot of at least two weeks (full-time) is required to provide normalised and representative data. This period should be outside of the main holiday times; • Public engagement, messaging, costs, and funding are not addressed here, but would need to be considered prior to any implementation. Figure 38: Kampala - existing and proposed cross-sections for Jinja Road Assessment Despite the proposal of full-time intervention, a modelling assessment was undertaken for the morning peak period which is normally the period during which the greatest number of public transport vehicles use the Highway and when a TTL could be most beneficial. 62 FINAL REPORT: Fast-tracking public transport priority: investigating the potential of Tactical Transit Lanes in mitigating the impact of COVID-19 in cities in Sub-Saharan Africa Despite the relatively short length of the proposed intervention, the results show potential significant additional passenger throughput, fuel cost saving annualised, and cumulative average value of time costs saved for passengers (see Table 17). Additional passenger numbers in the peak may be an oversimplification of the method, as it is not clear whether this level of demand will exist and during this peak hour period. Nevertheless, it is indicative of the enormous level of public transport demand on this corridor, and that the time savings to be accrued make a pilot of this nature more than worthwhile. Table 17: Kampala - assessment of proposed TTL on Jinja Road Mode Possible additional person throughput in the peak hour Potential saving for operator annual (fuel only) Possible cumulative passenger time of travel average cost saving/ month (salary based) Matatu 297 $20,734 $41,139 Medium bus 26 $1,260 $3,568 Boda-boda 107 $0 $745 Large bus 15 $788 $2,029 Notes: 1. Based on conversion rate of 1 USD = 3,700 Ugandan Shillings 4.5.4.2 Corridor 2: Kampala Road to Kira Road The proposed corridor is a link from Kampala Road to Kira Road. Kampala Road runs from Station Approach Road where it intersects Jinja Road to Watoto Church Downtown in the city centre (approximately 1.9km) where it joins Bombo Road up to Wandegeya and then onto Kira Road. It is mainly a two-lane dual carriageway corridor with a street parking lane on either side of the road for the Kampala Road section and sometimes an additional parking lane in the median. The average width per running lane along this corridor is 3m and it has a 0.5m-3m solid/planted central reserve island on different sections of the road and a section of Bombo Road has no median. The section considered suitable for the introduction of a TTL is a 3.6km section from The Square (City Square) in Kampala to Kamwokya where it intersects the John Babiha Avenue which is also the start of the proposed Acacia Avenue Pedestrian Boulevard (23) currently under construction. Surveys undertaken along Kampala Road in 2019 (21) show that inbound traffic levels, excluding motorcycles, in the morning peak period are 2,460 vehicles and 2,069 in the evening peak period. Outbound volumes, excluding motorcycles, are 1,919 vehicles in the morning peak period and 1,689 vehicles in the evening peak period. The public transport vehicle modal share (excluding motor-cycles) averages out at around 35% with a slight increase in the percentage of matatus and large buses in the outbound direction when compared to the inbound in the morning peak (approximately 4% more). The traffic surveys conducted on this corridor did not include boda-boda counts but, from observation and experience of using the road, it is seen that boda-bodas are reasonably and consistently frequent throughout the day, but with a marked increase in the evening in the outbound direction and in the morning peak in the inbound direction. 63 FINAL REPORT: Fast-tracking public transport priority: investigating the potential of Tactical Transit Lanes in mitigating the impact of COVID-19 in cities in Sub-Saharan Africa Figure 39: Kampala - image of Kampala Road (before the pandemic) Source: https://commons.wikimedia.org Kampala Road to Kira Road is a critical public transport route as it runs through the high-density employment CBD and along some high attractors such as Makerere University and the student community in Wandegeya, Mulago National Referral Hospital, the Uganda Museum, and Kamwokya, which has a market and is a highdensity residential area. This corridor also forms part of one of the proposed BRT corridors. The proposed method of achieving a TTL along this corridor is by segregating it using temporary longitudinal barriers on the inbound route towards Kampala during the morning peak period (7am to 10am) and outbound during the evening peak period (5pm to 7pm). This is mainly to accommodate the on-street parking facilities on Kampala Road during the rest of the day and maintain easy access to the shops and businesses on Kampala Road. Considering the prominent challenge of enforcement of compliance of traffic regulations especially by boda-bodas, traffic police should be deployed, particularly at the entry points, to ensure proper use of the TTLs. The existing and proposed cross-sections along the corridor are as shown in the illustrations below (Figure 40). Kampala Road and Kira Road are represented separately because the existing cross-sections on the roads are completely different. The capacity of dual lane Kampala road is also affected by the minibuses making informal stops searching for passengers in the off-peak hours of the day. Planning considerations • Partnerships/ project team – the project team would need to consist of City officials, business representatives, the KCCA, urban activists, cycling advocates, law enforcement, public transport operators and, possibly, urban specialists; • Parking – there is no on-street parking along the Kampala road section of this route; • Goals/ types – the obvious goal for this proposal is to decrease public transport travel times and thus person throughput per hour, although the length of intervention is short, and therefore benefits will be less marked; • Design considerations – apart from temporary lane demarcations, consideration needs to be given to the main road intersections which need to be kept fully operational. Temporary bus gates, preferably automated, could deter non-transit vehicles from using the TTL; • Enforcement – the bus gates proposed (both temporary and permanent) above should help reduce the need for the presence of law enforcement officers to a minimum; • Other vehicle access – the TTL should be used for all public transport, except for boda-bodas; • Pilot period – it is envisaged that a pilot of at least two weeks (full-time) is required to provide normalised and representative data. This period should be outside of the main holiday times; • Public engagement, messaging, costs, and funding are not addressed here, but would need to be considered prior to any implementation. 64 FINAL REPORT: Fast-tracking public transport priority: investigating the potential of Tactical Transit Lanes in mitigating the impact of COVID-19 in cities in Sub-Saharan Africa Figure 40: Kampala - Kampala Road to Kira Road, existing and proposed cross-sections Note: The proposed TTL will be wider on the Kampala road section than on the Kira Road section mainly because of the existing street parking lane on Kampala Road 65 FINAL REPORT: Fast-tracking public transport priority: investigating the potential of Tactical Transit Lanes in mitigating the impact of COVID-19 in cities in Sub-Saharan Africa Assessment Despite the proposal of full-time intervention, a modelling assessment was undertaken for the morning peak period which is normally the period during which the greatest number of public transport vehicles use the highway and when a TTL could be most beneficial. Despite the relatively short length of the proposed intervention, the results show potential significant additional passenger throughput, fuel cost saving annualised, and cumulative average value of time costs saved for passengers (see Table 19). Additional passenger numbers in the peak may be an oversimplification of the method, as itis not clear whether this level of demand will exist and during this peak hour period. Nevertheless, it is indicative of the enormous level of public transport demand on this corridor, and that the time savings to be accrued make a pilot of this nature more than worthwhile. Table 18: Kampala - assessment of proposed TTL on Kampala-Kira Road Mode Possible additional person throughput in the peak hour Potential saving for operator annual (fuel only) Possible cumulative passenger time of travel average cost saving/ month (salary based) Matatu 241 $26,604 $12,830 Medium bus 12 $907 $624 Boda-boda 80 $0 $892 Large bus 23 $1,944 $1,217 Note: Based on conversion rate of 1 USD = 3,700 Ugandan Shillings 4.5.4.3 Corridor 3: Entebbe Road (Kampala–Zana) Entebbe Road starts at the intersection with Kampala Road, through the Shoprite/Clock Tower/Entebbe Junction up to Entebbe. It is mainly a dual two-lane road with wide hard shoulders on each side and a 1m paved central reserve. The overall average width of the road is 20m. The hard shoulder is used mainly as a stopping point for many matatus/minibuses and boda-bodas as well as a pedestrian route. The section proposed for the introduction of a TTL is from the Clock Tower Junction in Kampala to Zana, approximately 6.5km. Outbound from Kampala City, this route consists the two-lane one-way Queensway Road from the Clock Tower and connects to Entebbe Road at Kibuye, through Namasuba and finally Zana. Traffic inbound towards Kampala uses Katwe Road, which is also a dual carriageway. Figure 41: Kampala - image of Kampala–Entebbe Road (before the pandemic) Source: Google Maps 66 FINAL REPORT: Fast-tracking public transport priority: investigating the potential of Tactical Transit Lanes in mitigating the impact of COVID-19 in cities in Sub-Saharan Africa Surveys undertaken in 2019 (21) indicate that peak hour traffic volumes (including boda-bodas) inbound to Kampala are 2,089 vehicles in the morning, and 1,475 vehicles in the evening peak hour. Outbound volumes are higher at 4,213 vehicles in the morning peak hour and 3,629 vehicles in the evening peak hour. Boda-bodas have an average modal share of 50% in both peaks in both directions. Matatus have up to 30% of the modal share, but the number of matatus in the morning peak outbound at 1180 per hour, recorded in this survey, is noteworthy. Medium and large buses are mostly intercity buses hence the low number on this route. Only the Pioneer city buses, and a few company and school buses (all also unscheduled) ply this route. Notable is that the number of Boda-bodas is mainly due to the intense traffic jam at the Shoprite/Clock Tower/Entebbe Junction which was identified as the most congested in Kampala. (29) The proposed method of achieving a TTL along this corridor is by manually segregating it using temporary longitudinal barriers on the inbound route towards Kampala (Katwe Road) during the morning peak of 7am to 10am and outbound (Queensway) throughout the day since it is a two-lane one-way road from Kampala onto Entebbe Road. Traffic police should be well mobilised to ensure proper use of the TTL throughout the implementation period. The proposed method of segregation is using traffic cones as they easy to implement on a temporary basis. The existing and proposed cross-sections along the corridor are as shown in the illustrations below (see Figure 42). Planning considerations • Partnerships/ project team – the project team would need to consist of City officials, business representatives, the KCCA, urban activists, cycling advocates, law enforcement, public transport operators and, possibly, urban specialists; • Parking – there is no authorised on-street parking along this route, but minibuses and some private cars occasionally use the shoulder for parking. These need to be accommodated if the need is identified as being one that KCCA approves or to be banned to avoid friction and congestion; • Goals/ types – decrease public transport travel times and thus person throughput per hour. Although the length of intervention is short, and therefore benefits will be less marked; • Design considerations – apart from the nature of the temporary lane demarcations, consideration needs to be given to the main road intersections which need to be kept fully operational. Bus gates, preferably automated, would be the proposed solution to deter non-transit vehicles from using the TTL. For a pilot, an affordable temporary parking gate type option would suffice; • Enforcement – the bus gates proposed (both temporary and permanent) above should help reduce the need for the presence of law enforcement officers to a minimum; • Other vehicle access – the TTL should be used for all public transport, except for boda-bodas; • Pilot period – a pilot of at least two weeks (full-time) is required to provide normalised and representative data. This period should be outside of the main holiday times; • Public engagement, messaging, costs, and funding are not addressed here, but would need to be considered prior to any implementation. 67 FINAL REPORT: Fast-tracking public transport priority: investigating the potential of Tactical Transit Lanes in mitigating the impact of COVID-19 in cities in Sub-Saharan Africa Figure 42: Kampala - Kampala to Entebbe Road, existing and proposed cross-sections 68 FINAL REPORT: Fast-tracking public transport priority: investigating the potential of Tactical Transit Lanes in mitigating the impact of COVID-19 in cities in Sub-Saharan Africa Assessment Despite the proposal of full-time intervention, a modelling assessment was undertaken for the morning peak period which is normally the period during which the greatest number of public transport vehicles use the highway and when a TTL could be most beneficial. Despite the relatively short length of the proposed intervention, the results show potential significant additional passenger throughput, fuel cost saving annualised, and cumulative average value of time costs saved for passengers (see Table 19). Additional passenger numbers in the peak may be an oversimplification of the method, as itis not clear whether this level of demand will exist and during this peak hour period. Nevertheless, it is indicative of the enormous level of public transport demand on this corridor, and that the time savings to be accrued make a pilot of this nature more than worthwhile. 69 FINAL REPORT: Fast-tracking public transport priority: investigating the potential of Tactical Transit Lanes in mitigating the impact of COVID-19 in cities in Sub-Saharan Africa Table 19: Kampala - assessment of proposed TTL on Entebbe Road Mode Possible additional person throughput in the peak hour Potential saving for operator annual (fuel only) Possible cumulative passenger time of travel average cost saving/ month (salary based) Matatu 845 $137,911 $110,505 Medium bus 100 $11,466 $13,111 Boda-boda 279 $0 $3,858 Large bus 31 $3,900 $4,058 Note: Based on conversion rate of 1 USD = 3,700 Ugandan Shillings 70 FINAL REPORT: Fast-tracking public transport priority: investigating the potential of Tactical Transit Lanes in mitigating the impact of COVID-19 in cities in Sub-Saharan Africa 5 Project findings During lockdowns in case cities, movement patterns were almost entirely disrupted. Even after initial lockdowns, when only essential travel was permitted and markets were closed, people continued to work from home or online (where possible). In every city studied, larger gatherings were prohibited, schooling and other education travel intermittent, and curfews enforced (see Section 1.1). TTLs would have served these particular, suppressed, and atypical movement patterns, increased the efficiency of public transport, and thus provided better services to meet the requirement of physical distancing and, possibly, mitigated the need for fare increases. The immediate opportunity for the implementation of lockdown-related TTLs may have passed because SSA economies have mostly reopened (at the time of writing). Despite second waves of contagion, further hard lockdowns have not yet materialised. Nevertheless, physical distancing measures imposed are still in place and are (at times) enforced or are self-imposed due to concerns about travelling on public transport. There is, therefore, still value in investigating 'temporary' or flexible public transport infrastructure, particularly in resource-poor countries with high levels of public transport usage and multiple demands for safer, affordable mobility options, where temporary options can pave the way for future permanent public transport friendly interventions. It is not yet clear whether these lockdown behaviours will have a lasting impact on travel behaviour. But it is clear from the background study that pilot TTLs or tactical urbanism are relatively quick and affordable ways in which to test effectiveness of public transport proposals, demonstrate measurable change, then review and revise, if necessary, and before resources are committed to a project. Tactical urbanism is also a way in which to draw on local knowledge to ensure that users' mobility needs are met. In investigating high-volume priority routes for TTLs, we have also made the decision to move beyond the immediacy of response and recovery, to understand current policy positions regarding temporary infrastructure and flexible pilots and consider the most promising strategic approaches for action. Proposed routes for intervention reflect travel behaviours before disruption and historic travel to physical places of work, but with current reduced capacity requirements. In most instances, trip origins are low-income residential areas, where there is the least likelihood of remote-working opportunities, and travel to economic centres should continue. 5.1 Key findings 5.1.1 Findings from 'state-of-the-art' projects A summary of the findings of the literature reviewed shows the following, which is pertinent to this project: • In most cities where TTLs have been piloted (and permanently adopted), there was sufficient infrastructure width and capacity to allow a dedicated right of way for public transport. Even where this was not the case (such as in UK), the overall transport system had room or flexibility to accommodate a reduction in private vehicle capacity; • The availability and quantity of high-quality data and scheduling of public transport services helped make the case for, and adoption of, pilots or proposals, mainly because of the ability to evaluate possible benefits of interventions in terms of time saving, cost, and reliability perspectives prior to adoption; • Abidance of traffic and other road-related laws by all road users is a key factor in the relative successes of pilots already executed. This extends to the authority's ability to enforce fines/penalties or other punishment to offenders. Regrettably, both aspects present a stark contrast to the case cities. (30) In addition, passenger boarding, and alighting is predictable so the system can be well-managed and controlled; • Despite, possibly, a more rigorous and complex set of legal and policy requirements, it seems as though there is a greater ability for political and/or official buy-into community-based or promoted trial projects in the Global North. Most are actively encouraged to combat possible further spread of infections, many governments have issued clearer guidelines and enabling mechanisms to promote projects which enable physical distancing and health benefits; 71 FINAL REPORT: Fast-tracking public transport priority: investigating the potential of Tactical Transit Lanes in mitigating the impact of COVID-19 in cities in Sub-Saharan Africa • Projects can take many forms, despite or because of their temporary nature, and many materials (mostly low-cost) can be used to achieve the desired outcome. The agile and low-cost nature of projects make 'tweaking' simple and fast, and pave the way for permanence; and • Project timescales seem to vary, the reasons for which are not entirely clear, possibly to evaluate seasonal differences, but the flexibility which allows for change or modification is used where appropriate. Similarly, project lengths can be short or long depending on the type of intervention type, existing constraints or result required. In essence there is no real prescriptive method to follow which makes the concept ultimately applicable to many different environments. 5.1.2 Findings from proposed TTLs in Kampala and Nairobi The findings from our study in Cape Town were intended to be used as learnings for proposal formulation in our other study cities. These are detailed in Section 4.3.4 and were used to inform choices made for Kampala and Nairobi. They are not repeated here. In Kampala and Nairobi, the road infrastructure is not as well-developed or extensive as it is in Cape Town and is constrained by roadside development. It is immediately apparent that there are only a few corridors where TTLs could be accommodated without a significant impact on the remaining road network. The composition of traffic in these cities – mostly public transport vehicles (in some cases up to 80%) – means that even relatively small TTL interventions could provide huge benefits to operators and commuters alike. It also indicates that public transport should be given more priority wherever possible. However, from the transport plans made public, development of new infrastructure is strongly donor-driven and towards highprofile interventions, a number of these being private car oriented. Therefore, TTLs would be most likely to be implemented if they were trialled along the high-value, high-volume public transport corridors where proposals for BRT/MRT have been made. This is what our project has proposed. As stated, our assessments show great benefits and pilots will allow the collection of real-time data, the ability to adjust, re-allocate and ultimately, a reliable and more thoroughly reviewed permanent intervention. Noteworthy, and possibly of concern, is the fact that despite the presence of some two-way 2/3 lanes wide urban highways, peak period vehicular flows seem low on these roads and possibly constrained by either poor intersection design or control systems. Our studies show that peak flows on most of the corridors proposed for TTLs are less than, or in the order of 2000 vehicles per hour, which are significantly less than flows, for example, on Voortrekker Road in Cape Town (2,400 vehicles per hour on a two-lane road). This is an indication of the combined impact of intersection design (mainly roundabouts), poor signalling systems design, or both. TTLs, being mostly short in length, will only have a small impact on overall flow rates because vehicles will be snarled up in congestion away from the intervention. Both Kampala and Nairobi have an organic form of road network rather than a grid-like planned network that would allow access to on-street shops and the like via alternative routes, side roads, or even to the rear of the facility. Clearly the efficiency and impact of TTLs is related to the number and nature of side road accesses and/or to shops, stalls, markets, and stops made by public transport vehicles. All corridors proposed are impacted by these. How many access points and what arrangements need to be made is a detailed consideration and one that will require more extensive and public debate prior to implementation. Another, and related issue, is compliance. How can abidance of traffic laws be ensured, especially for bodaboda riders, and abuse by other vehicles where numerous access points are required along the intervention? TTLs cannot be planned to be in the centre of the road because of the random and many drop-offs and pickups executed by public transport and, even if this were acceptable, the widths of most roads preclude the creation of temporary stops for such operations. The assessment matrix adopted assumes some level of friction and resolution of the above-mentioned planning and design issues. This has been applied consistently across all proposals via a time penalty. Nevertheless, and because of the level of public transport usage, the results show that for all cases, regardless of location and whatever the length, there will be significant benefits to both operators and commuters should a TTL be implemented. The predicted growth in population in both cities, the likelihood of continuing socio-economic and work patterns and urban sprawl all point to an increased infrastructure requirement. 72 FINAL REPORT: Fast-tracking public transport priority: investigating the potential of Tactical Transit Lanes in mitigating the impact of COVID-19 in cities in Sub-Saharan Africa Road and other transport options (such as rail) are expensive and have long lead times whereas increased public transport provision and priority for it on existing infrastructure is simpler, will serve the greater need and will reap other societal benefits. The approach to select reasonably short lengths of roads that lend themselves to TTL interventions and are of high public transport value could thus be extended more widely in each city; from evaluation, sufficient momentum would be gained for tractability and scalability elsewhere in the country and region. Without experimentation and evaluation, but through the lens of experiences in Cape Town in relation to the on-going implementation of its full BRT system, it seems that these cities would benefit from the introduction of more and well-organised TTLs leading to permanent t interventions, together with subsidies for the medium to large minibuses/buses. The costs of consideration would be low in comparison to donor-funded, possibly, debt-laden new systems; and the results could save significant resources. 5.2 Limitations of the approach The findings of this research need to be understood in the context of the following limitations – in terms of the approach to the application of the techniques proposed, the methodology adopted, and their application. • The aim of this research was to demonstrate from secondary data sources and a simplified assessment methodology that the concept of TTLs could have real and significant value to LIC cities. This has been conceptually achieved; however, actual benefits cannot be tested or measured without a proof of concept which can be executed through the uptake of this research by officials or advocacy groups in the beneficiary cities initially. Funding was limited to achieve this output only; • The regulations imposed by governments because of the pandemic has meant that all research activities have had to be carried out by the research team members working remotely from each other and via electronic means. For the most part, this has meant limited access or means to carry out first-hand observations to confirm and verify assumptions, constraints, and findings; • Despite the collection of some primary data, the formulation of proposals and assessment rely on the quantum and accuracy of published secondary data. The nature of most public transport in the case cities is unscheduled and has movement patterns that are not regular, and thus are difficult to capture accurately or assess, even with the most sophisticated transport model. • Physical trips, Google Maps for typical travel times in the peak on average weekdays, and assessed impacts of traffic friction, have been averaged and used consistently to derive possible benefits; • Any impacts of traffic reassignment (both private and public) have not been accounted for; • Design issues related to proposals have been flagged but not fully quantified. These need resolution prior to any possible pilots; • The results represent an order of benefits, not absolute values. Actual benefits or possible issues can only be evaluated though a pilot project's execution, and monitoring and evaluation over a period of time (long enough to allow 'normalisation' of traffic); • Although many project uptake activities have been undertaken, or are proposed to be, time and funding limitations have meant that proposals made will be workshopped in LIC cities and the outcomes will be reported but not actioned any further; • The benefits assessed have not been reviewed in terms of more and broader criteria such as carbon reduction benefits, the potential expansion of TTL corridors and thus an overall benefit to the economy, road safety benefits, social impacts of time savings, possible uptake of tactical urbanism and through these placemaking and so on. 73 FINAL REPORT: Fast-tracking public transport priority: investigating the potential of Tactical Transit Lanes in mitigating the impact of COVID-19 in cities in Sub-Saharan Africa 5.3 Barriers to TTLs or pop-up infrastructure in case cities 5.3.1 Policy and regulatory environment: a proactive approach It is quite clear that governments need to play the main role in either championing or removing any bureaucratic or administrative hurdles to the ability to implement any transportation measures that would increase transport options and/or make them safer. An example of the actions taken by the UK government is briefly described below to highlight some differences in approach. Clearly, countries have different levels of bureaucracy and have varying objectives, means, and structures; this approach is merely shown as an indication of how a positive approach could be taken in SSA where, as demonstrated below, apart from regulations to restrict travel to keep the public safe, there has been little or no support for pop-up interventions. In May 2020, the UK Transport Secretary Grant Shapps announced 'Further funding to protect and increase transport services, level up infrastructure and regenerate local economies after coronavirus (COVID-19)'27 . A further £283 million was also made available to increase the number of bus and light rail services so that people who need to travel, including critical workers in the NHS, could do so safely. In addition, more traveller information and in terms of journey times and overcrowding was made available. The government also allocated funding to local authorities and amended laws28 to reduce red tape and halve the time it takes for councils to create pop-up and permanent cycle lanes and reallocate road space. These actions led to a spate of locally designed and implemented pop-up bike lanes and, most notably- for this project, the implementation of TTLs in many cities throughout the UK. 5.3.1.1 Approach in Cape Town A review of the main regulations in relation to road infrastructure and the possible requirements in relation to the creation of temporary infrastructure in Cape Town is shown in Table 20. Table 20: Cape Town - review of policy/ statutory requirements in relation to infrastructure provision Actions/ requirements Policy/ statute/ procedure How are infrastructure proposals normally planned? By whom/location 1. By developers –New or re-developed areas 2. By city government– City-owned roads 3. By provincial government – Provincial roads 4. By SA National Roads Agency -– National roads 5. By sub-councils/wards – Small local roads/infrastructure How is new/ amended road infrastructure work implemented? In general, drawings prepared to standards and submitted to City Transport Planning for approval. Construction after approval. How is the funding obtained and prioritised? 1. Private for private development 2. City: from rates. By committee 3. Provincial: National allocation. By committee 4. National: Fiscus allocation. Cost benefit/ political 5. Sub-councils/Wards: Rates allocation. By committee Is there an approvals procedure in local government from planning to design to construction? Private developments approval process via City Transport Planning Dept. All others through City committee structures Also applicable is: Municipal Systems Act, 2000 National Land Transport Act, 2009 27 https://www.gov.uk/government/news/transport-secretary-announces-new-measures-to-keep-passengers-safe-now-and-level-upfor-the-future 28 UK: Traffic Management Act 2004: network management in response to COVID-19 74 FINAL REPORT: Fast-tracking public transport priority: investigating the potential of Tactical Transit Lanes in mitigating the impact of COVID-19 in cities in Sub-Saharan Africa Actions/ requirements Policy/ statute/ procedure Roads Ordinance Act, 1976 Urban Transport Act, 1977 Local Government Municipal Systems Act, 2000 Road Safety Strategy, 2013-2018 Is there legislation governing traffic management? National Road Traffic Amendment Act 64 of 2008 Amended National Road Traffic Act Regulations, 2014 What legislation/ by-law/policy mechanisms are there for temporary infrastructure/events in the city and this been used previously? Traffic By-law, 2011 What related specific legislation is there in relation to Transport Governmental decree: 'National Directions on Measures to Address, Prevent and Combat the Spread of in the Public Transport Services, 2020' Is there a Nationally and/or locally used road design guide/ standard? UTG series TMH series Guidelines for Human Settlement Planning & design Provincial and local guidelines Standards and Guidelines for Roads and Stormwater, version 1.0, October 2020 Universal Access Policy, 2014 What impediments are there to pop-up infrastructure implementation? National Road Traffic Amendment Act needs modification. Will allow Traffic By-law, 2011 to be amended. Traffic Police may deem it unenforceable (if not self-regulating) MoU with Western Cape Dept. of Public Works and Transport for Cape Town and Golden Arrow Bus Services MoU: Transport for Cape Town and Department of Safety and Security How is traffic policed, dedicated lanes (if any are protected/ dedicated)? Traffic Law Enforcement Unit How can proposals be quickly implemented (what's the best way of getting things done)? Amendment of National Directions, amendment of City Traffic By-law, agreement with City's political structures (Transport Sub-Committee) and Traffic Law Enforcement Unit No clear guidelines are in place in Cape Town to allow temporary projects of any kind related to COVID-19. This was apparent from stakeholder consultation outcomes and leads to the conclusion that government has not thought through the possibility of any liability resulting from the lack of provision or action related to the spread of the disease in transport and transport facilities. Changes to the City's traffic by-laws and/or national enabling mechanisms therefore need to be considered. Or, in the absence of these, approval needs to be sought from the City's political structure, in this case, via its Transport Sub-committee. 75 FINAL REPORT: Fast-tracking public transport priority: investigating the potential of Tactical Transit Lanes in mitigating the impact of COVID-19 in cities in Sub-Saharan Africa 5.3.1.2 Approach in Nairobi Urban transport institutions in transition As with many other LIC cities, urban transport institutions have been in place for many years and are often inefficiently organised. In Nairobi, before devolution to NaMATA, much of the authority over urban transport was centralised at the national level but divided by partial and sometimes overlapping and contradictory mandates and responsibilities. The institutional organisation for transport consisted of several entities, including: • the National Ministry of Roads, responsible for formulating national road policy and road subsector administration; • the National Ministry of Transport, responsible for overseeing national transport policy and transport sector administration, including public transport services within cities; • the Kenya National Highways Authority, responsible for developing and maintaining national roads, including important arterials in urban areas; and • the Kenya Urban Roads Authority, responsible for developing and maintaining urban roads. Until devolution, there was also a National Ministry for Nairobi Metropolitan Development. In addition, local authorities were responsible for managing roads and streets within their jurisdictions. The resulting tangled web confused ordinary citizens, diluted scarce financial resources, and led to chronic underinvestment in transport, including formal public transport systems. (16) The route to decision-making may, therefore, still be fraught with issues. The questions and responses below are intended to provide some clarity on this issue. Note that responses are from our understanding of the system and do not constitute legal advice. What types of processes/ consultation are required in Kenya before an intervention can become permanent? Processes for intervention types depend on the classification of the road and the political willingness from those in charge. For example, cycling interventions along Luthuli Avenue and Muindi Mbingu Street within the CBD were largely based on temporary interventions (street closures) done during different Nairobi Placemaking Weeks. Additionally, there are also plans to have pedestrianisation along Banda Street after similar experiments. These were largely because of the willingness of the then County Government (and currently NMS). At the same time in Kisumu, the Kisumu County Government put up temporary cycling lanes along one of their main roads, but this was stopped by the Kenyan Highways Authority who felt that it interfered with vehicular traffic. The Kenya Urban Roads Authority and Kenya Highways Authority have authority over roads in Kenya but are known to focus mainly on vehicular movement. Are there any definitions or criteria by which a public intervention could be called 'experimental'? Interventions are viewed as experimental when they are temporary e.g., placemaking weeks29, street closures in general and for events, temporary barriers (see article on Kidero Drums in Appendix E), to assess the effect of the intervention. Experiments to date have focussed on traffic flow, no right turns, or to close certain roundabouts. What defines 'temporary' in Kenya, in terms or urban interventions? We have not found references in any of the legal procedures of street design manuals. The closest to 'temporary' has been street closures to study the effects of improved pedestrianisation. In addition to the above, it is likely that a more detailed reference would need to be made to the Kenyan National Traffic Act (laws relating to traffic on the roads) as well as the Nairobi County Transport Act (which 29 http://africancityplanner.com/placemaking-week-can-nairobi-create-places-spaces/ 76 FINAL REPORT: Fast-tracking public transport priority: investigating the potential of Tactical Transit Lanes in mitigating the impact of COVID-19 in cities in Sub-Saharan Africa relates to roads, street lighting, traffic and parking, public road transport and management of county traffic marshals)30, but there seems to be a gap in relation to temporary street changes. 5.3.1.3 Approach in Kampala The questions and responses below are intended to provide some clarity on this issue. Note that responses are from local sources and do not constitute legal advice. What types of processes/consultation are required in Uganda before an intervention can become permanent? The Uganda Traffic and Road Safety Act of 1998 (Part VII) provides for temporary speed restrictions, closure of a road, restriction of traffic on a road, one-way traffic on a road, and special parking places, among other interventions that can be put into effect by the Minister of Works and Transport through a statutory order. In this case, the responsible authority/agency under the Ministry or the proponent of the intervention has the obligation to carry out the research and necessary consultations from all the relevant stakeholders to ensure that it is viable and consistent with the Constitution or any other laws, policies, or other city plans/provisions. An example is the KCCA proposal for permanent route charts and colour coding of 14-seater minibuses operating in GKMA, which was concluded but remains pending for lack of a statutory instrument by the Minister for Works and Transport. In Kampala, the intervention must be planned (e.g., through feasibility studies, or desk planning) by Kampala Capital City Authority (KCCA) technical staff. It is then taken to the Authority/Council sessions, which is the political wing of KCCA, for passing by means of a vote. During the implementation process, in the instance that the intervention entails construction of facilities, the usual public procurement processes must be followed to procure contractors and consultants to design and construct/supervise the works. Also, during the detailed design process, some consultations with respect to environment and social aspects of the project are usually held. For legislation, a bill is presented to Parliament for the first reading and then forwarded to the relevant committee of Parliament. It is then presented for the second reading, debated, and after the third reading, can it then be passed and assented into law by the President. The process for by-laws by either KCCA or other local governments is not so different, except that in this case, the President does not need to sign it into law, as the Minister of Local Government authorises such by-laws before they are passed (Minister for Kampala in case of KCCA, since Kampala doesn't directly fall under the local government structure). Political interest is also a major factor, as seen when the KCCA proposed a boda-boda free zone, which was approved by cabinet but is not being enforced probably because of the political reasons. Are there any definitions or criteria by which a public intervention could be called 'experimental'? These are not provided for in the national and city transport policies/planning documents so far. Kampala has pilot projects such as the recently implemented walking and cycling (NMT) corridor in Kampala Central Business District. What defines 'temporary' in Uganda, in terms or urban interventions? Most temporary interventions are not directly statutory but implemented at the discretion of the traffic police in their mandate to regulate traffic and keep order, for example traffic diversions in case of a road crash or road construction, guiding traffic during peak hours with heavy traffic congestion on un-signalised junctions or in case of faulty traffic signals etc. However, these are general for mixed traffic which, in Kampala, primarily consists of cars and boda-bodas and some cyclists. Other examples of temporary interventions in Kampala include car-free Sundays in the CBD (open market) and place-making initiatives 30 Republic of Kenya. Nairobi City County Gazette Supplement. Bills 2017 77 FINAL REPORT: Fast-tracking public transport priority: investigating the potential of Tactical Transit Lanes in mitigating the impact of COVID-19 in cities in Sub-Saharan Africa 6 Research dissemination 6.1 Initial stakeholder dialogue As stated in the Introduction, a stakeholder and expert reference group was established for each city early in the project, to undertake frequent online and in-person engagement to provide input into key aspects of the project. Stakeholders included individuals/experts in the transport sector, government ministries, non-governmental organisations (NGOs) and community-based organisations (CBOs), public transport operator groups, and public transport users. Questionnaires were developed for different categories of stakeholders i.e., government/city officials, advocacy groups, experts in the transport sector, and users of public transport. The questionnaires were administered through several platforms depending on the stakeholders' convenience. The platforms used for consultation included the following and show corresponding responses received. • Online meetings: three in Cape Town; three in Kampala; and five in Nairobi; • One-on-one interviews with observation of physical distancing protocols: three in Cape Town; four in Nairobi; six in Kampala; • Online survey Google Forms: 178 in Kampala (some duplication); 40 in Nairobi; not used in Cape Town due to limited requirement; • Emails to all stakeholders. 6.1.1 Continuing stakeholder dialogue Following client approval of the final report, a public facing webinar will be held on 11 March 2021 to discuss the findings of this research in conjunction with research conducted for project HVT L3M096 (see Appendix F for poster). The webinar will be conducted jointly between the two LIC cities and a Nairobi based think-tank, Naipolitans. It will involve both sets of stakeholders as well as other interested parties to broaden the group of attendees and through this obtain as wide a response as possible. A post-webinar report detailing the event content, feedback and considerations will be prepared as an adjunct to this report. The event will be recorded and posted on an appropriate online channel, and if appropriate and acceptable, one-on-one interviews with key attendees will also be recorded and similarly posted. Our media campaign will include monitoring social media for opportunities to share findings, and these will be shared with IMC in a report annexure. 6.1.2 Journal submission/ conference paper, attendance, and presentation On acceptance of the final product by HVT, our proposal is to prepare and publish a final research paper in an open-source journal and, a paper for consideration at an appropriate conference. HVT has agreed with the Transportation Research Record (TRR) for a special collection for research papers arising from the HVT C-19RRTRF projects devoted to COVID-19 to be considered and published if acceptable. We have indicated that we wish this research to be considered for the 2022 TRB meetings. TRB will conduct a separate review process and acceptance for the meeting is not guaranteed, but papers can be automatically cascaded to the review committee if this option is taken up. The committee that reviews papers for the TRB Meetings is separate from the editorial committee reviewing these submissions. TRB will promote the TRR Special Issue in its newsletter, web page, and on social media. Papers accepted for publication in the TRR can be added to the SAGE Journals microsite for research and may be featured in blog posts on the SAGE social science hub. The papers will also be posted to the HVT website via the original publication link. 6.1.3 Electronic media HVT has also joined a partnership with the World Economic Forum and other international organisations to support the COVID Mobility Works platform (https://www.COVIDmobilityworks.org/). 78 FINAL REPORT: Fast-tracking public transport priority: investigating the potential of Tactical Transit Lanes in mitigating the impact of COVID-19 in cities in Sub-Saharan Africa COVID Mobility Works is an independent platform dedicated to collecting, synthesising, and sharing mobility initiatives that are keeping the world moving during the pandemic. The goal of this platform is to help policymakers, innovators, researchers, and advocates rise to the challenge of creating more resilient, inclusive, and sustainable transportation systems for all. The initiatives found on this platform include public, private and NGO efforts to ensure the movement of people and goods during (and after) the coronavirus pandemic. HVT is joining the platform to strengthen the knowledge and share experience of the global South. A submission summarising this project and its findings, in the prescribed fashion, has been sent to HVT's technical lead for its incorporation on this website. 6.1.4 On-line events We will also be attending an on-line event to be held by Universities Transport Study Group (UTSG) on 25 February at 2pm (GMT) via an invitation forwarded by HVT. This will help to enrich the dissemination activities and gain wider support for this project. The event is hosted by the Special Interest Group SIG F01 of the World Conference on Transport Research (WCTR) to explore the impact of on the interaction of transport and spatial development. The purpose of the free workshop is to stimulate the discussion and research on the interaction of transport and spatial development during and after the pandemic. A short presentation on this project will be made by the research team at this event. 6.2 Research uptake The high number of responses received from stakeholders both assisted in the technical input of proposals and provided a broader awareness of the concept of TTLs, their potential benefits in their locality and in other LIC cities. Further, it is possible that armed with this knowledge, examples of good practice elsewhere, and the possible level of successes of TTLs (in their community), that there would be a strong motivation for advocacy groups to approach decision-makers to follow the steps described in this research to investigate the roll-out and implementation of pilots quickly. Decision-makers who were involved in this process will already have preferences in terms of routes and know the multiple challenges and dilemmas of providing muchneeded 'risk-compliant' public transportation that will satisfy demand. The major hurdles or stumbling blocks for project implementation – acceptance of design (or technical availability for), availability of funding, construction time and disruption, and the ability to modify to overcome unintended consequences – are all relatively minor when considering TTLs in comparison to more permanent road infrastructure projects. As reported in 2019 in Bloomberg City Lab:31 'To make a TTL, a can of paint or a stack of cones is often all that's required to (mostly) keep cars out'. This is the ideology and experience in US, so there should be little or no reason for this concept be taken forward in LICs. Further, because 'pop-up' style interventions are essentially temporary (initially), more detailed or exhaustive analysis of proposals are not required, nor is extensive public consultation because projects can be easily modified or taken up as demonstrated by projects already in place in the global North. Community, or activist, buy-in, promotion and support of the proposals is, however, pivotal in taking proposals forward. In Nairobi the high profile of past government attempts to remove matatus from the CBD32 as well as the current debates around BRT (hosted both on National TV and on YouTube) means that transport related issues are high up the broadcaster's agenda (see for example https://www.youtube.com/watch?v=q3H0g5VFgbQ) A second phase of this research, that of evaluation, acceptance and funding a pilot's implementation, is vital so that momentum is not lost and the possibly favourable conditions for such an intervention created by the pandemic are not lost. The publishing and hosting of this report on appropriate media sites will be of value. In addition, consideration by FCDO/HVT of ways to promote for funding for the second phase through UK sources or contacts would assist. 31 www.bloomberg.com. 'To Build a Better Bus Lane, Just Paint it'. Laura Bliss 1 March 2019 32 https://nairobinews.nation.co.ke/news/why-ban-on-matatus-from-nairobi-cbd-will-be-badis-litmus-test 79 FINAL REPORT: Fast-tracking public transport priority: investigating the potential of Tactical Transit Lanes in mitigating the impact of COVID-19 in cities in Sub-Saharan Africa Further, assuming the necessary political support, appropriate pilots once tested and, if necessary, refined, should lead to more permanent adoption of the intervention or interventions. All of which will have the consequential benefits of a better, more carbon-neutral society that will become more resilient to future pandemics or shocks. Horizontal and vertical scalability of this research should follow 6.3 Project outputs The following project outputs have been produced for the cities studied in this research; • An overview of the transport system for the city related to public transport and road infrastructure; • A map of proposed routes for interventions for each city; • Cross-sections of existing route options and proposed alterations; • A TTL option evaluation matrix; • An example of the stakeholder consultation questionnaire and a summary of responses received for each city; • A summary of statutes and policy related to road infrastructure procurement, design, and traffic; • A schedule of proposed research dissemination activities and steps that need to be undertaken to try to get cities to adopt the recommendations of this research; • An infographic related to matatus in Kenya; • A presentation for the HVT cohort meeting; • Information for inclusion in the COVID Mobility Works platform; • A poster for a webinar to held to discuss our findings with stakeholders in the cities investigated and elsewhere; • Presentations to be delivered at the forthcoming webinar. 80 FINAL REPORT: Fast-tracking public transport priority: investigating the potential of Tactical Transit Lanes in mitigating the impact of COVID-19 in cities in Sub-Saharan Africa 7 Conclusion TTL interventions are a novel approach to public transport in that they create what is essentially a bus lane by using tactical urbanism methods – i.e. local solutions to local challenges, starting with a short-term commitment that carries low risks but possibly high rewards. (10) In this study, we develop a concept of creating short or long lengths of public transport or bus lanes through lighter, quicker, cheaper means, or adapts existing lanes to provide more public transport benefits. Although the benefits of the technique are that it can be rolled out quickly and at a low-cost, the successful implementation of TTLs on existing infrastructure does have some pre-requisites – the corridor needs to have sufficient capacity to incorporate a public transport-only lane while allowing for other modes; or alternatively it could be achieved by creating one-way corridors or contra-flows. Neither of the latter two are likely to be politically acceptable. Our studies show that there are suitable corridors in the cities investigated, but that no TTLs have been implemented in any form, to combat the constraints on public transport during the 2020-2021 pandemic. This could be out of concern for further constraining an already stretched road infrastructure system; or, because TTLs are a relatively new concept and their methodology not fully understood or researched during the first year of the COVID-19 pandemic. The needs and operations of unscheduled paratransit services mixed with the now ubiquitous boda-boda could also be a factor. However, the fact that the modal share of public transport is so high in both Kampala and Nairobi (more than 35%) and that TTLs can be easily and cheaply implemented means that any benefit cities can give to these modes is worthwhile exploring. Yet instead, both Kampala and Nairobi seem to be pursuing a donor-led strategy of implementing large-scale investment-heavy and debt-laden projects. Projects like these usually have long lead times even for sections or parts of an overall strategy (for example with MyCiTi in Cape Town, it is typically up to six years per BRT route. (14) The population growth rate in both cities is around 5% per annum, the majority of whom will be captive to public transport or walking, which will result in more demand on services and probably an increase in paratransit. It therefore seems clear that short to mid-term interventions that favour public transport, such as TTLs, and which can be located on high-volume corridors without prejudicing future plans, must be considered. In fact, TTLs would benefit any future transport planning because it allows quick, cheap assessments of corridors by providing performance data and highlighting areas of concern/community dissatisfaction. At present, large-scale transport interventions are planned on the assumption that employment patterns and the monocentric nature of both Nairobi and Kampala will continue as they are, yet in time, and as is already happening in Nairobi, large employers may choose to move away. Increases in the population at the rates predicted (see Section 4) may mean that employment centres in less developed and more appropriately planned areas may evolve. Further, the pandemic has led to remote working as a trend that may endure (the scale of which is not properly determined yet), and the realisation that the mono-centric nature of Kampala and Nairobi may not be spatially optimum for the large and populous cities they have become may force a rethink of many larger scale projects. How and when these things will play-out is unclear. For the short term, COVID-19 has impacted the carrying capacity of transit through physical distancing requirements. It will continue to do so for some time and is presenting a challenge to commuters LIC cities who are either walking or switching to alternative modes where possible. The capacity issues have forced operators to cover their costs, resulting in higher fares, which affects affordability and sets in motion a cyclical effect. In Nairobi, assessment of the three locally workshopped and agreed interventions show that: • For a 11km TTL on Mombasa Road/Uhuru Highway, the person throughput could be increased by 1030 in the peak hour for all public transport modes; operators could save an average of 30 minutes per trip, meaning over $401,500 per annum in fuel costs; and cumulatively, commuters would benefit from a value of time saving of around $502,780 per month or over $6 million per annum (average low-mid salary based); 81 FINAL REPORT: Fast-tracking public transport priority: investigating the potential of Tactical Transit Lanes in mitigating the impact of COVID-19 in cities in Sub-Saharan Africa • For a 5km TTL on Jogoo Road, the person throughput could be increased by 941 in the peak hour for all public transport modes; operators could save an average of around 20 minutes per trip which could equate to $150,500 per annum in fuel costs; and cumulatively, commuters would benefit from a value of time saving of $578,035 per month or over $6.9 million per annum (average low-mid salary based); and • For a 2km TTL on Ngong/Haile Selassie, the person throughput could be increased by 190 in the peak hour for all public transport modes; operators could save an average of around 10 minutes per trip which could equate to $22,890 per annum in fuel costs; and cumulatively, commuters would benefit from a value of time saving of $102,667 per month or $1.2 million per annum (average low-mid salary based). In Kampala, assessment of the three locally workshopped and agreed interventions show that: • For a 2.5km TTL on Jinja Road, the person throughput could be increased by 347 in the peak hour for all public transport modes; operators could save an average of 10 minutes per trip which could equate to over $22,780 per annum in fuel costs; and cumulatively, commuters would benefit from a value of time saving of around $47,480 per month or almost $570,000 per annum (average low-mid salary based); • For a 3.6km TTL on Kampala/Kira Road, the person throughput could be increased by 306 in the peak hour for all public transport modes; operators could save an average of 10 minutes per trip which could equate to over $29,455 per annum in fuel costs; and cumulatively, commuters would benefit from a value of time saving of around $15,564 per month or over $186,000 per annum (average low-mid salary based); • For a 6.5km TTL on Entebbe Road, the person throughput could be increased by 1028 in the peak hour for all public transport modes; operators could save an average of 14 minutes per trip which could equate to over $153,280 per annum in fuel costs; and cumulatively, commuters would benefit from a value of time saving of around $131,533 per month or over $1.57 million per annum (average low-mid salary based). Note that although commuter time is monetised here, value of time savings is not strictly speaking actual savings. However, any time saving should provide commuters additional time in which to do many other things, possibly work overtime or find additional work which could result in an additional income; however, this is not something that can be quantified. The savings are based on an average salary in Nairobi and Kampala, which for the low-mid income level groups varies because of the nature of employment but is estimated at $560 per month for Nairobi and $240 per month in Kampala. Note that the cost of living is more than 25% higher in Nairobi33 so salary differences would not necessarily result in better living standards, but value of time could. The assessments assume that boda-bodas would be restricted from using the proposed TTLs (because they can (and do) negotiate their way through normal traffic more easily). This may be difficult to achieve practically in Kampala, as most vehicles on the routes proposed are bodabodas (see Section 4.5), so compliance will be difficult. In Nairobi, boda-bodas do not use the highways, which is where TTLs are proposed, so compliance may not be too much of an issue. Apart from the salary differences between the two cities, a comparison of the results shows that it could be concluded that the extensive use of boda-bodas in Kampala (and the lack of medium to large buses) reduces the TTL benefits calculated, particularly value of time. Regardless, TTLs on any corridor in these cities, where there is high-volume public transport usage, would provide significant benefits to the city in terms of person throughput (through which the impacts of transport in general would also be reduced), to operators and commuters. How well TTLs would work in each location is clearly linked to length, type, and extent of the proposals, as well as the current operations in terms of vehicles using the corridors. The focus of this assessment is purely the transport-related benefits that can be discerned from the datasets. There are many consequential benefits apparent that are not quantified in this research but that may further enhance the case for piloting TTLs. From our review of the policy framework in relation to temporary infrastructure interventions, it does not seem that TTLs usually require direct statutory compliance; they can be implemented at the discretion of the 33 https://www.nationmaster.com/country-info/compare/Kenya/Uganda 82 FINAL REPORT: Fast-tracking public transport priority: investigating the potential of Tactical Transit Lanes in mitigating the impact of COVID-19 in cities in Sub-Saharan Africa traffic police in their mandate to regulate traffic or promoted by political will, particularly to control traffic at congested sections. Many precedents have been set in both Kampala and Nairobi, and therefore, the uptake of this research by officials is key to successful implementation of any of the pilots suggested. In Cape Town, however, temporary interventions are tightly controlled and require cooperation of many layers of bureaucrats, committee approvals and the willingness of many officials (including the traffic police who operate under a separate jurisdiction) to promote proposals as well as accept responsibility of possible failure, The key benefits of TTLs that make them worthwhile in any city, let alone in LICs, are that they: • enable the testing of low-cost options for the provision and support of transport capacity required during and after lockdowns. Authorities can provide additional space for public transport by making radical but low-tech changes to road space allocation, which can be moved elsewhere if they have unintended adverse impacts or could be better implemented elsewhere; • complement existing public transport provision and enable increased capacity for workers; • may enable cities to take advantage of this possibly once-in-a-generation opportunity to lock-in the potential for efficiency gains and possibly provide car-competitive public transport; • should be capable of being implemented without the need for overly complicated regulatory change protocols or by-law amendments. The benefits of any proposals outweigh costs by far, and in fact, are significant for operations (and thus the environment), operators, and the users. 83 FINAL REPORT: Fast-tracking public transport priority: investigating the potential of Tactical Transit Lanes in mitigating the impact of COVID-19 in cities in Sub-Saharan Africa 8 References AFDB. (2019). Uganda - Kampala City Roads Rehabilitation Project - ESIA and RAP Summary. AFDB. Agade, K. M., & Mkutu, T. R. (2019, February). Public health problems associated with "boda boda" motorcycle Taxis in Kenya: The sting of inequality. Aggression and Violent Behaviour, 47. Behrens, R., McCormick, D., Orero, R., & Omneh, M. (2017, January). Improving paratransit service: Lessons from inter-city matatu cooperatives in Kenya. Transport Policy, 53, pp. 79-88. Bezuidenhout, P. (2011, April). Reducing crime in South Africa by enforcing traffic laws a 'brocken windscreen' approach. Journal of the South African Intitution of Civil Engineering, 53(1). Bird, J., & Venebles, A. (2019). The efficiency of land-use in a developing city: traditional vs modern tenure systems in Kampala, Uganda. University of Oxford, CEPR and International Growth Centre, Oxford. Cervero, R. (2013). Linking urban transport and land use in developing countries. Journal of Transport and Land Use, 6((1)). City of Cape Town. (2018). Comprehensive Integrated Transport Plan. Statutory 5-year plan, City of Cape Town, TCT, Cape Town. City of Cape Town. (2018). Travel Demand Management Strategy. 5 Year Plan, City of Cape Town, TCT, Cape Town. City of Cape Town. (2019). Comprehensive Integrated Transport Plan, 2018-2023. 2019 Review. Cape Town: City of Cape Town. GIZ, M. o. (2020). A Tactical Urbanism Guidebook. New Delhi: GIZ. ITDP. (2020). Better than a ban: Prioritising efficient public transport in the Nairobi CBD. Retrieved January 2021, from ITDP Africa: https://africa.itdp.org/better-than-a-ban-prioritising-efficient-publictransport-in-the-nairobi-cbd/ Jennings, G., & Behrens, R. (2017). The case for investing in paratransit: Strategies for regulation and reform. Volve Research and Educational Foundation (VREF). JICA. (2010). The Study On Greater Kampala Road Network And Transport Improvement In The Republic Of Uganda. Republic Of Uganda Ministry Of Works And Transport, Kampala. Kampala Capital City Authority. (2012). Updating Kampala Structure Plan and Updating the Kampala GIS Unit. Draft Final Report. KCCA, Kampala. Kampala Capital City Authority. (2018). Multi-Modal Urban Transport Master Plan for Greater Kampala Metropolitan Authority (GKMA). Kampala: GKMA. Kampala Capital City Authority. (2019). Statistical Abstract for Kampala City. Kampala: Kampala Capital City Authority. Kampala City Council. (2003). City Development Strategy, Kampala Development Plan, 2003/2004. KCC, Kampala. KCCA. (2018). Multi-Modal Urban Transport Master Plan for Greater Kampala Metropolitan Area. Draft Final Report Following Stakeholder Comments. Kampala Capital City Authority. Kampala: Kampala Capital City Authority. Lesteven, G., & Boutueil, V. (2018). Is paratransit A Key Asset For A Sustainable Urban Mobility System? Insights From Three African Cities. 97th Annual Meeting Transportation Research Board. Washington. Litman, T. (2016). Victoria Transport Institute. Retrieved from Victoria Transport Institute: http://www.vtpi.org/blw.pdf Lydon, M., Bartman, D., Garcia, T., Preston, R., & Woudstra, R. (2014, October). Tactical Urabnism Short-term Action Long-term Change volume 2. The Street Plans Collaborative. 84 FINAL REPORT: Fast-tracking public transport priority: investigating the potential of Tactical Transit Lanes in mitigating the impact of COVID-19 in cities in Sub-Saharan Africa Nairobi City County. (2014). The Project on Integrated Urban Development Master Plan for the City of Nairobi in the Republic of Kenya. Final Report. Part II: The Master Plan. Nairobi: Nairobi City County. Newton, L. (2016). Urbanisation and Traffic Control in Kampala. ResearchGate. Nyachio, G. (2018). Retrieved January 21, 2021, from Exploring Public Road Passenger Transport in Kenya: https://t2m.org/exploring-public-road-transport-in-kenya Opiyo, R., Muketha, S., Omollo, W. O., & Mwaniki, D. (2020, January). Responsive Infrastructure and Service Provision Initiatives Framing Smart Environment Attainment in Nairobi. Smart Environment for Smart Cities, Advances in 21st Century Human Settlements. Papageorgiou, G., Damianou, P., Aphamis, T., Charalambous, D., & Ioannu, P. (2009, January). Modelling and Simulation of Transportation Systems: a Scenario Planning Approach. ResearchGate.Net. Sheehan, M. O. (2020, December). Global Urban Development Magazine. Retrieved from GUD: globalurban.org Sietchiping, R., & Permezel, M. J. (2012). Transport and mobility in sub-Saharan African cities: An overview of practicies, lessons and options for improvements. Cities(29), pp. 183-189. TCRP. (2019). TCRP Reserch Report 207. Fast-Tracked: A Tactical Transit Study. Washington: The National Academies of Science, Engineering, Medicine. TRB. UCLA Institute of Transportation Studies. (2019). Best Practices in Implementing Tactical Transit Lanes. UCLA, ITS. UCLA ITS. UN Habitat. (2020). Retrieved January 2021, from https://unhabitat.org/sites/default/files/2020/04/unhabitat_corporate_response_on_covid_19_policy_and_programmatic_framework_30_march_2020.p df Venter, C., Barrett, I., Zuidgeest, M., & Cheure, N. (2020, August). Public Transport System Design and Modal Integration in Sub-Saharan African Cities. The State of Knowledge and Research. Mobilty & Access in African Cities. World Bank. (2016). Republic of Kenya. Kenya Urbanisation Review. Washington: World Bank. World Bank. (2016). Republic of Kenya. Kenya Urbanization Review. World Bank, Washington. Zendrive. (2017). Retrieved from Zendrive.com: http://blog.zendrive.com/mission-st-study 85 FINAL REPORT: Fast-tracking public transport priority: investigating the potential of Tactical Transit Lanes in mitigating the impact of COVID-19 in cities in Sub-Saharan Africa APPENDIX A: ORIGINAL PROJECT SCHEDULE 86 FINAL REPORT: Fast-tracking public transport priority: investigating the potential of Tactical Transit Lanes in cities in Sub-Saharan Africa 87 FINAL REPORT: Fast-tracking public transport priority: investigating the potential of Tactical Transit Lanes in cities in Sub-Saharan Africa APPENDIX B: STAKEHOLDER CONSULTATION – TACTICAL TRANSIT LANES QUESTIONNAIRE Question Response (Please answer as best you can – we do not need 100% accurate information) Key questions: Key Responses Do you think there should be pop-up bus lanes? If yes, why? Where do you think that Tactical Transit Lanes or 'Pop-up Bus Lanes' could be best positioned for impact now and/or in the short-term future? If the response to the above questions is positive, do you think that the pop-up lanes suggested would be adopted as permanent bus-only (or bus and cycle lanes) in the future? General Public Transport Questions General Public Transport Responses On what routes are there currently high volumes of people using public transport as a mode of transport? What is the modal share? Where is the best source of current information? What is the average travel time and distance of public transport users for each mode? Is this the route/mode they would most like to take, or is it a lack of alternatives? What sort of work/opportunity are they travelling to undertake (trip purpose)? Has the regulations in relation to COVID-19 affected their normal commute, if so how? Has the operator been affected by the regulations? 88 FINAL REPORT: Fast-tracking public transport priority: investigating the potential of Tactical Transit Lanes in cities in Sub-Saharan Africa Question Response (Please answer as best you can – we do not need 100% accurate information) How have the City's plans re public transport been affected by? What is the situation in relation to MBT licensing, demand for new licenses, 180-day surveys Has there been an impact on National Government funding/subsidy of GABS? What has the impact of the current MetroRail issues (re: theft of equipment, rolling stock etc.) been on public transport in the City What are the current traffic volumes on the major roads around the city? Have congestion levels reached 2019 levels or higher? Please provide examples if possible. Have people expressed a desire for a particular route/intervention, that has been ignored (or not) by the relevant authority? Are these routes on your city's public transport master plan (CITP/IPTN for Cape Town)? Questions around public transport planning Does the City have a public transport (master) plan? How old is it? How were decisions made regarding route/network planning? How are the plans implemented? How often is it revised? How are decisions made around where to build public transport infrastructure? How much of the infrastructure budget is spent on public transport specific infrastructure? 89 FINAL REPORT: Fast-tracking public transport priority: investigating the potential of Tactical Transit Lanes in cities in Sub-Saharan Africa Question Response (Please answer as best you can – we do not need 100% accurate information) What is the role of international agencies / activists in developing public transport routes? Would the City consider interventions around public transport (such as pop-up lanes) that would be to the benefit of commuters in terms of travel time and cost but be to the possible detriment of private vehicles? If 'temporary' interventions are made more permanent do you think that they would be publicly/politically accepted given a lack of 'proper' consultation? Questions around by-laws Has the City/Province been approached to develop pop-up public transport infrastructure? Has the City/ Province been approached to develop other pop-up infrastructure, such as trading, parklets, sidewalk cafes, or even Open Streets type events etc? What are the regulations around such interventions? Were these regulations relaxed or changed during/ as a result of? Regulations (traffic) have been relaxed worldwide, in terms of the need to consult the public about proposals; do, do they think they would be able to follow suit? If regulations (traffic) have been relaxed, what is the intention around returning to previous regulations? 90 FINAL REPORT: Fast-tracking public transport priority: investigating the potential of Tactical Transit Lanes in cities in SubSaharan Africa Example of Google Form Questionnaire I've invited you to fill out a form: Dedicated Bus Lanes for Kampala High Volume Transport (HVT) COVID-19 Response Recovery Transport Research: This survey is part of a study about fast-tracking public transport priority, identifying high-volume transport routes for workers, developing quick-win interventions and modelling impact of dedicated bus lanes in Kampala City. The project is funded by UKAid through the UK Foreign, Commonwealth & Development Office under the High Volume Transport (HVT) Applied Research Programme and managed by IMC Worldwide. It is being implemented in 3 case study cities that include Cape Town - South Africa, Nairobi - Kenya and Kampala - Uganda. For further project information visit https://hvt.preview.consideredcreative.com Email address * Name (Optional) Gender * o Female o Male Age * o Below 18 o 19–30 o 31–40 o Above 40 Which types of Public Transport do you use? * o Commuter train o Bus o Mini-bus / taxi o Motor cycle / boda-boda o Other: How often do you use Public Transport within Kampala? * o Daily o Week days o Once in a while o More than twice a day o 2 to 3 times a week o Once a week o Other: Is the frequency of using Public Transport the same as before the outbreak of COVID19? * o Yes o No If no, explain how What is the trip purpose? * 91 FINAL REPORT: Fast-tracking public transport priority: investigating the potential of Tactical Transit Lanes in cities in SubSaharan Africa o Home to Home o Home to Work o Work to Work o Home to Recreation o Work to Recreation o Other: What is the origin of the trip (name of town/village)? * What is the destination of the trip (name of town/village)? * Is this the mode you would be most likely to use even if you had other alternatives? * o Yes o No What is cost of the journey from origin to destination? * What is the average travel time (in minutes) from the origin to the destination? * What is your view about dedicated bus lanes in Kampala? On which roads in Kampala do you think the dedicated bus lanes can be placed for best impact now and/or in the near future? * Send me a copy of my responses. Never submit passwords through Google Forms. 92 FINAL REPORT: Fast-tracking public transport priority: investigating the potential of Tactical Transit Lanes in cities in SubSaharan Africa APPENDIX C: TTLS – TECHNOLOGY OPTIONS, COMMON PROBLEMS, AND A GUIDE TO PLANNING C. 1 Cones and other barriers Experience in the US suggests that coned off lanes result in fewer violations than red painted lanes but have the disadvantage of 'trapping' the public transport vehicle in the event of a parked vehicle in the lane. In addition, cones require on-going labour to install and remove if the TTL is intended for short time periods only and in the event of accidental (or purposeful) damage. (2) Cones and other temporary barriers also have a narrowing effect on roads causing drivers to slow down and are suitable for pilot projects only (see Figure 43). Figure 43: TTL 'technology' options: cones, armadillos, wands, plastic barriers, bus gates Source: bangaloremirror.indiatimes.com Source: Google Earth Source: Streetcred.com Source: alamy.com Source: lancsbus.blogspot Source: bus gate_news.hackney.gov.uk C1.1 Signage and striping Signage and striping can take many forms. The most common seems to be red painted lanes. White painted lanes in the form of 'BUS ONLY' are also common but deemed to be less effective. Abundant signage in the first few weeks of the project's life is recommended to supplement striping (and then gradually removed once the function of the lane has general acceptance. (2) 93 FINAL REPORT: Fast-tracking public transport priority: investigating the potential of Tactical Transit Lanes in cities in SubSaharan Africa C1.2 Red painted lanes ITS reports that many recent TTLs in the US have used red painted lanes. Surveys of results of these lanes indicate a 25% increase in transit reliability, a 16% decrease in collisions and a 24% drop in injury collisions compared to other citywide rates over the same time period. They also resulted in around 50% fewer violations depending on time of day even as traffic increased. (2) The advice regarding red painted lanes is to only use them for full-time lanes so as not to dilute the effect of red painted lanes. Current technologies used include pre-formed thermoplastic or methyl methacrylate or painted with epoxy-based paint. Also, while most red painted lanes cover the entire lane, trials have been undertaken using blocks of paint (like a zebra crossing). The effectiveness of this treatment is not documented. C1.3 Forced turns In addition to red painted lanes or even separately, many cities have adopted no-left turns and forced right turns for private vehicles. Data collected by the company Zendrive from mobile phones in San Francisco indicated significant decreases in road safety related parameters – acceleration, hard braking, and speeding. (29) C1.4 Hours of operation TTL hours of operation should generally match the times during which numbers of users is high or congestion causes problems to public transport in terms of delays, boarding and alighting. Peak hour operations generally avoid conflicts with periods of higher parking demand but have the disbenefit of requiring (mostly) labour intensive installation and removal. Operations at weekends need to be considered on a case specific basis. C1.5 Access to other modes Bikes are commonly allowed on TTLs in the US and have proved to be popular with cyclists. Although sharing heavily used transit lanes with cyclists would seem to be problematic, most planners in US reported few if any problems with such an arrangement. (2) In contrast, bus lanes in London, of any length allow cycles, tricycles(motorised), motorbikes, licenced taxis and mopeds. 34 C2 Common challenges C2.1 Parking Parking is universally a top community concern, and project that involve the removal of on-street parking (even temporarily) require more extensive community engagement and creative problem-solving. At the same time, parking's importance is often overestimated even by planners (2). Solutions to parking can be as simple as increasing supply in adjacent streets, or permit parking nearby (including for residents), reducing loading hours and so on. In some areas, 'bulb-outs' or TTL interruptions may be necessary to appease the community. While not ideal, they present a way to proceed with the project. C2.2 Access/loading zones Depending on the nature of the land-uses adjacent to the route under consideration for a TTL, there may be a need for commercial vehicle access or loading. In some areas, comprehensive re-allocation plans may be needed, however, as with parking, in some areas this need may be overstated. C2.3 Community concerns Besides parking and loading, ITS (2) reports that most pre-implementation concerns included worsening traffic, noise, and construction impacts. Post-construction, these concerns seemed to have been allayed. 34 www.tfl.gov.uk/modes/driving/red-routes/exemptions 94 FINAL REPORT: Fast-tracking public transport priority: investigating the potential of Tactical Transit Lanes in cities in SubSaharan Africa C2.4 Enforcement Experience in Cape Town shows that enforcement of a TTL is vital for its efficient operating, providing time savings and reliability. If lane violations occur regularly then operators will stop using the lane or take avoidance manoeuvres which defeats the object and could lead to road safety issues. Enforcement types could include conventional (i.e., fines for stopping violations); soft (driver education); photo (for moving violations); passive (signs, policies, painted lines aided by community enforcement); or preventative (Bus barriers or other suitable automated barriers, or even by manual policing). C3 Guide to planning TTLs Like most public projects, TTLs attract interest from communities affected, officials and relevant professionals. The following is a general guide to planning TTLs drawn from document experience in the US by UCLA (2) and the TCRP. (9) It is a relatively new technique and therefore there is little in the way of trails and reporting in the Global South. However, as can be seen from the summary below, processes seem equally applicable to LIC cities. They will be reviewed further in Section 5 of this report from our study and proposals relating to a way forward. Assemble the team All projects need the right team, support of local elected official is critical, a project manager from the right government department is also vital to drive the project through procedurally. Projects depend on community experience, can be politically risky, need data to support. Person throughput is especially helpful. While top-down support is vital, bottom-up community processes are essential to implementation. Community context Knowing your community and its preferences is essential in planning the right project. For example, is the community open to innovation, is it results driven or process-driven? Observation of delays and/or unreliability, help to formulate preferences and type and length of interventions including pilot time frames. Project goals/types Goals have been stated as being: • To advance a current or previous planning process or initiative; and/or • A response to political pressure or other pressure. The following have been reported to be the types of projects that have been implemented to date: • Speed and reliability – projects that address issues of travel times, improved headways, and improved boarding times; • Access and safety – projects that enhance multi-modality or accessibility and decrease crashes; and, where they were included as part of a larger project; and • Rider experience – projects that address rider comfort, create support through aspects such as reliability, comfort, and sense of community. Partnerships Most commonly projects are led by the city with transit agency as support. This is particularly applicable if the project involves infrastructure installation. Where projects are amenity-based or operational, they require an equal partnership between cities and transit agencies (if there are any). Some projects enforce those promoted by advocacy groups, but may require city buy-in. And although TTLs are mostly installed by city departments, they are used by private public transport operators. A collaborative partnership is thus essential for success. Unified messages from all involved is also important. 95 FINAL REPORT: Fast-tracking public transport priority: investigating the potential of Tactical Transit Lanes in cities in SubSaharan Africa In fact, a blog by Zicla35 about TTLs states that: '…There is already evidence that formal regulatory bodies are working with small groups of citizens in a way that stands [sic] set to paint the scene for urban planning in the future'. Project costs and funding Although relatively low-cost, TTLs require funding if they are not budgeted for in the city's plans. Grants and donations have been the sources of most schemes implemented in US. (2) Data gathering, analysis and presentation Good data is an important requirement for making the case for a particular project, especially to elected officials. Pre-implementation data identified as being important in projects assessed includes parking utilisation, person throughput, benefits to riders, and benefits to cyclists. Person throughput is a particularly valuable metric for TTLs. It properly frames what a TTL can do – shifting the focus away from single occupancy vehicles and measuring the benefits to all travellers. It is also a 'realitycheck' in that if a person throughput forecast is unaffected by a TTL, it may be due to operational times. Lessons learnt/ successes from other projects and how to overcome challenges can clearly assist in project considerations. Pilot projects The choice of whether a pilot is appropriate depends on the scale of the project and the community's preferences. Most TTL pilots are relatively simple (e.g., cones), though some can have additional complexities such as traffic signal changes. If elected officials and/or the community allow a 'quick-pilot', it can provide 'real world' operational data and user feedback with a short period of time, with or without public outreach. Public engagement and outreach Understanding the community's expectations for engagement is important in developing an appropriate outreach plan. Plans can include abbreviated or no outreach (where benefits are small and unlikely to attract much comment); public meetings; door-to-door; on-line; videos; surveys; and community design. Messaging Messages need to stress the importance of public transport and generally adopt a 'public transport first' theme. Benefits need to be put graphically on a map, and in terms of the benefits that the rider may enjoy. Design considerations Design considerations include: lane demarcation types, for example: cones, red paint, signage or striping, wands, temporary jersey style barriers or other similar means. Hours of operation Hours of operation generally match when the time when the person throughput is high and/or congestion is high and delays to public transport is of importance. In some contexts, peak-hour operation helps conflicting requirements such as parking or can be used for example for contra-flow needs in the event where congestion is high, and choice are limited. Other vehicle access Cycles were reported to be the most commonly allowed mode on TTLs in the US (ITS 2019). Although some planners are wary of sharing heavily used TTLs with cycles, few if any problems have been reported where this has happened. 35 www.zicla.com/topical 96 FINAL REPORT: Fast-tracking public transport priority: investigating the potential of Tactical Transit Lanes in cities in SubSaharan Africa Permanent adoption Even though many former pilot TTLs have been adopted as permanent solutions in US (see Table 3), there are no specific examples of 'good practice' or guides as to when to adopt pilots permanently. This may be because adoption criteria are subjective, dependent on goals set or community buy-in to the project or its political accept 97 FINAL REPORT: Fast-tracking public transport priority: investigating the potential of Tactical Transit Lanes in cities in SubSaharan Africa APPENDIX D: POSTER DESCRIBING THE MATATU SECTOR IN NAIROBI 98 FINAL REPORT: Fast-tracking public transport priority: investigating the potential of Tactical Transit Lanes in cities in SubSaharan Africa APPENDIX E: ASSESSMENT MATRIX 99 FINAL REPORT: Fast-tracking public transport priority: investigating the potential of Tactical Transit Lanes in cities in SubSaharan Africa APPENDIX F: NAIROBI, EXAMPLE OF TEMPORARY INFRASTRUCTURE INTERVENTION – KIDERO DRUMS 'Kidero Drums' is a name that was given to an intervention in 2014 led by an Executive Task force that comprised officials from the Ministry of Transport, Nairobi County government, National Transport and Safety Authority, Traffic Police, Kenya Urban Roads Authority and the Kenya National Highway Authority to ease traffic along the Southern and Western entry/exit to the city. They proposed the use of oil drums and barriers to change traffic flows near roundabouts and junctions by preventing right turn. The proposal was executed but lasted only one week. The intervention was removed after it emerged that drivers were spending more time on the road (e.g., those who spent 1 hour ended up spending up to 2 hours). The article below is from https://www.wazo.co.ke/post/nairobi-traffic-the-legacy-of-kidero-drums 100 FINAL REPORT: Fast-tracking public transport priority: investigating the potential of Tactical Transit Lanes in cities in SubSaharan Africa Nairobi Traffic: The Legacy of Kidero Drums Traffic has been a menace in Nairobi, the Capital City of Kenya. Maybe by now, the city residents have forgotten the Executive Task force that comprised officials from the Ministry of Transport, Nairobi County government, National Transport and Safety Authority, Traffic Police, Kenya Urban Roads Authority, and the Kenya National Highway Authority. This task force was meant to come up with recommendations to ease traffic along the Southern and Western entry/exit to the city. The recommendations made for Mombasa Road, the Southern and Western entry/exit, hardly lasted a week! The changes to the road structure, that comprised erecting oil drums on the roundabout to prevent right turns, was an absolute fiasco. We conducted a survey amongst road users of Mombasa Road in the week that the changes were in place. The key lessons that can be gleaned from this expression is that: there are no quick fixes to the City's problems and the need for suggested solution to be premised on well researched facts. Mombasa Road has arguably the greatest economic significance to the Capital City: providing access to the Jomo Kenyatta International Airport; Kenya's main export route to Uganda and the route to Kenya's industrial Capital. An initiative to ease the traffic that had been bedevilling this key artery was therefore welcome. The proposal by the County Government was to eliminate roundabouts, citing them as the main cause of traffic. The information available was that for instance the roundabout at Lusaka Road (popularly known as the Nyayo roundabout) had a usage about 5,300 vehicles per hour; while the Bunyala Road roundabout had about 6,500 vehicles per hour. The plan was that these 10,000 vehicles would flow with ease if no right turns were made (the no right turn rule). The plan was executed by the erection drums on the on three main roundabouts during the Easter weekend of April 2014. The plans were latter dubbed #Kiderodrums on Twitter. The results of these proposals were disastrous, and sure enough the drums were rolled away from two roundabouts a week after installation. We conducted an online survey on the impact of the plans to Mombasa road (the Southern entry/exit) specifically targeting Nairobi City Residents who use the road on a daily basis during the one-week period. The survey link (http://freeonlinesurveys.com/s/scbbu1sg037qxcl649970 ) was published online through social media platform and direct emailing of known Mombasa Road Users. The online survey revealed that 61% of Mombasa Road Users were of the opinion that the no right turn rule had worsened the traffic situation along Mombasa Road, instead of bringing improvements. The survey further revealed that 70% of Mombasa Road users were spending between 1 to 2 hours on Mombasa Road before the no right turn rule, and none of them had spent three hours before the changes. However, with the no right turn rule more than 55% of them had spent 2 to 3 hours on the road. It is worth noting that none of the respondents spent less than one hour on the same route, meaning that there was absolutely no improvement on Mombasa Road. The survey also revealed that the preferred solution by frequent users of Mombasa Road was the building of overpasses rather than a mere removal of the roundabouts. The rolling away of the drums brought an end to the drum beat of whining, anger, pleading and protests on social media platform for traffic updates such as @ma3Route on Twitter. The fact that the first recommendation of a joint task force between the National and the County Government would have such wanting results, leaves Kenyans with a two key lessons. First is that there are no quick fixes to a City's problems. A problem that has grown with the City's existence (a period of over 100 years) cannot be solved with a two day installation of oil barrels! The second issue is that there is need for an informed involvement of the citizens when seeking solutions. The initiative was a timely and noble one but was probably executed without the necessary due diligence. It is indeed embarrassing that a Task Force of that nature would end up with such catastrophic proposals. The same would apply to the City Residents who quickly lauded these proposals without having any well analysed facts. How many read a complete and well researched report before concluding that the plans were appropriate? There is therefore a need for Public Policy to be premised on well researched 101 FINAL REPORT: Fast-tracking public transport priority: investigating the potential of Tactical Transit Lanes in cities in SubSaharan Africa recommendations. In future, city residents should demand a well-researched policy brief to back up any ambitious proposals. Charts for the results of the survey are available below. 102 FINAL REPORT: Fast-tracking public transport priority: investigating the potential of Tactical Transit Lanes in cities in SubSaharan Africa 103 FINAL REPORT: Fast-tracking public transport priority: investigating the potential of Tactical Transit Lanes in cities in SubSaharan Africa Rahul Jobanputra and Gail Jennings 33 Gaggle Wood Mannings Heath West Sussex, RH136JR Tel: +44 7934941600 Email: rahul@jobanputra.me | gail@gailjennings.co.za Web: www.gailjennings.co.za