Overview
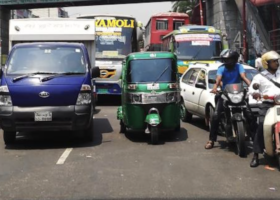
Active mobility such as walking and cycling plays a vital role in economic and social prosperity in African cities, connecting people, goods and places. Yet every day, citizens risk their lives because of the low priority given to non-motorised transport (NMT) and the lack of investment in safe transport infrastructure.
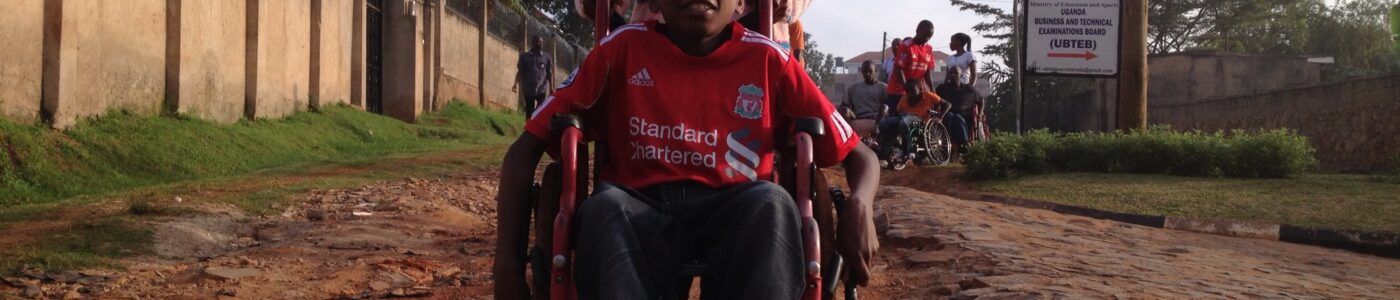
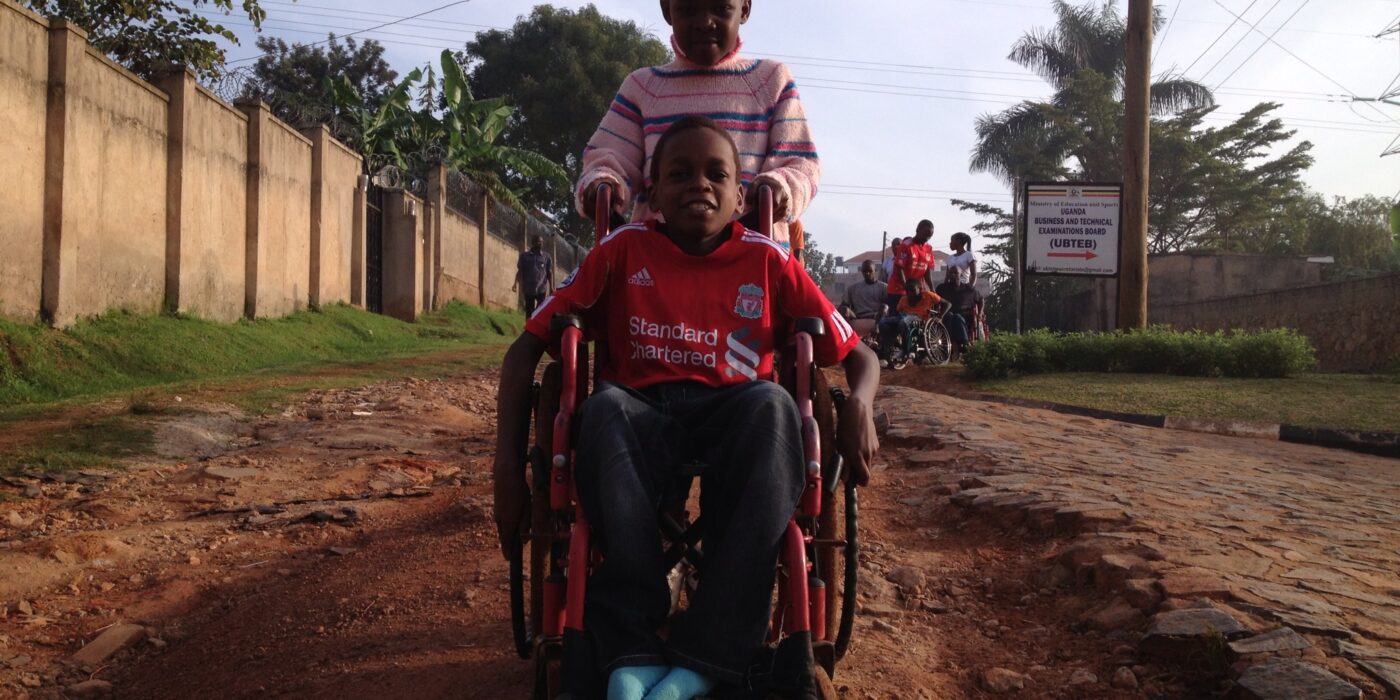
It is low-income disadvantaged groups such as the old, disabled, young and women who suffer the most from poor transport systems that do not meet their needs. In the absence of adequate sidewalks, cycle paths and public transport, citizens in African cities are forced to use motorised vehicles (for example, paratransit, cars, minibuses and motorbike taxis) whenever they can afford to do so.
This has disastrous impacts on air quality, greenhouse gas (GHG) emissions, road safety, traffic congestion, overall economic efficiency and quality of life. Climate change is expected to compound these transport challenges with impacts on infrastructure, vehicles and mobility. An opportunity exists to make transport not only more inclusive but also resilient to climate impacts.
PURPOSE
The primary aim of this guidance is to provide a set of concepts and tools for more inclusive and climate-resilient transport in Africa. It acts as a reference document to assist transport decision-makers, transport planners and representatives of disadvantaged groups to understand the application and use of various creative participatory tools.
The document is divided into three sections.
- Section 1 introduces key issues relevant to inclusive and climate resilient transport in Africa.
- Section 2 outlines four types of creative participatory tools that can be used to engage low-income, disadvantaged groups in transport policymaking and planning processes, to help ensure their voices are heard.
The final section provides a summary of additional factors to consider when applying these approaches and suggestions on how to overcome common challenges.
AUDIENCE
This guidance has been produced for two key audiences:
- African transport planners and decision-makers who are responsible for transport policy, planning and infrastructure development.
- Representatives of disadvantaged groups who can engage in the co-design, development, and delivery of transport policies in African cities.
The tools described require limited human and financial resources to implement. However, the application of the tools will often benefit from the use of experienced facilitators. The guidance is not intended to be a comprehensive reference to participatory engagement but rather highlights selected, tested tools that show the greatest potential for widening inclusion in transport planning in Africa.
Publications with the same themes


Publications with the same study countries
Related news & events

News
PDF content (text-only)
1 • 2 TABLE OF CONTENTS INTRODUCTION 4 KEY CONCEPTS 5 PARTICIPATORY TOOLS FOR INCLUSIVE CLIMATE RESILIENT TRANSPORT 16 FINAL CONSIDERATIONS 40 GLOSSARY AND ACRONYMS 44 REFERENCES 44 2 3 FOREWORD Developing inclusive mobility solutions and climate resilient transport infrastructure is a challenge experienced in many African cities. This guidance is aimed at two main audiences relevant to solving the transport challenge: African transport planners and decision-makers; and representatives of disadvantaged groups who feel excluded from current transport policymaking and planning. It summarises key concepts around transport inclusion, participation, and climate change. It introduces selected creative methods that can give a voice to disadvantaged groups. It also provides practical step-by-step information on how and when to use the various methods, supported by inspiring case studies from Africa and around the world. These creative methods can be used to support existing transport planning processes to improve outcomes and deliver more inclusive and climate resilient transport in Africa. Image: D Mwamba | ZRST 3 4 INTRODUCTION Active mobility such as walking and cycling plays a vital role in economic and social prosperity in African cities, connecting people, goods and places.1 Yet every day, citizens risk their lives because of the low priority given to non-motorised transport (NMT) and the lack of investment in safe transport infrastructure.2 It is low-income disadvantaged groups such as the old, disabled, young and women who suffer the most from poor transport systems that do not meet their needs.3 In the absence of adequate sidewalks, cycle paths and public transport, citizens in African cities are forced to use motorised vehicles (for example, paratransit, cars, minibuses and motorbike taxis) whenever they can afford to do so.4 This has disastrous impacts on air quality, greenhouse gas (GHG) emissions, road safety, traffic congestion, overall economic efficiency and quality of life. Climate change is expected to compound these transport challenges with impacts on infrastructure, vehicles and mobility. An opportunity exists to make transport not only more inclusive but also resilient to climate impacts. PURPOSE The primary aim of this guidance is to provide a set of concepts and tools for more inclusive and climate-resilient transport in Africa. It acts as a reference document to assist transport decision-makers, transport planners and representatives of disadvantaged groups to understand the application and use of various creative participatory tools. The document is divided into three sections. Section 1 introduces key issues relevant to inclusive and climate resilient transport in Africa. Section 2 outlines four types of creative participatory tools that can be used to engage lowincome, disadvantaged groups in transport policymaking and planning processes, to help ensure their voices are heard. The final section provides a summary of additional factors to consider when applying these approaches and suggestions on how to overcome common challenges. AUDIENCE This guidance has been produced for two key audiences: • African transport planners and decision-makers who are responsible for transport policy, planning and infrastructure development. • Representatives of disadvantaged groups who can engage in the co-design, development, and delivery of transport policies in African cities. The tools described require limited human and financial resources to implement. However, the application of the tools will often benefit from the use of experienced facilitators. The guidance is not intended to be a comprehensive reference to participatory engagement but rather highlights selected, tested tools that show the greatest potential for widening inclusion in transport planning in Africa. Image: Slum Dwellers International | Flickr 5 1 Key Concepts Image: Hassan Omar Wamwayi | 5 6 KEY CONCEPTS This section provides users with an understanding of core concepts and principles relevant to participatory transport planning and practice. These four core concepts are: transport inclusion; climate change; climate resilient transport; and participation. 1.1. TRANSPORT INCLUSION Inclusion empowers everyone to take part in and benefit from transport. Inclusive transport encompasses policies that promote equality and non-discrimination by improving mobility and access to essential services such as education, work and healthcare.5 It also embraces action to remove barriers for disadvantaged individuals, who are often excluded from the transport planning process. The expansion of low-density, unplanned and informal settlements in African cities imposes a substantial travel burden on the poor, who undertake journeys to access work and services in the urban centre.6 Many African cities lack proper roads, public transport and NMT infrastructure that meet people’s travel needs.3 Poor connections between modes and destinations, high cost of fares, and concern over safety and security all affect individual mobility. 6 Over 75% of total daily trips made by Africa’s poor are by walking, compared to 45% by the more affluent. Paratransit services (i.e., flexible, demand-responsive public transport) are popular at higher income levels, accounting for between 78 to 80% of Africa’s total motorised transport.7 The poverty burden of reduced mobility is borne disproportionately by women, children, older people and the disabled, including those living in low-income urban areas and slums.8,9 A shift from traditional transport planning is therefore required to incorporate the mobility needs of disadvantaged users.10,11 Widening engagement and inclusion in transport planning enables open, active participation, which is needed to understand complex problems such as the inter-linkages between urban mobility and climate resilience. Disadvantaged Groups The poorest in society are affected the most by a lack of investment in NMT as they often have no choice but to walk and cycle, risking their lives every day. People with disabilities and older people often have difficulty walking due to the poor design and maintenance of streets with uneven surfaces, potholes, and a lack of reasonable adjustments. Children and young people are disproportionately affected by air pollution and road traffic. Road traffic injuries are considered the leading cause of death for children and young adults aged 5-29 years. Women are dependent on NMT and are more likely than men to walk and take public transport. However, they are also more likely to be attacked while walking or cycling than men and feel less safe in public spaces. 7 An increase in heat trapping GHG levels in the Earth’s atmosphere from human activities such as the burning of fossil fuels and deforestation is causing the climate to change. In Africa, extensive areas are predicted to exceed 2°C of global heating by the end of this century, under a high emission scenario, compared to the late twentieth century mean annual temperature. This is expected to increase heatwaves, warm periods of weather, and reduce rainfall over North Africa and south-western South Africa.12 These changes will affect agriculture, water, human health and disrupt vital transport infrastructure, networks and services. There is a growing awareness that transport modes and infrastructure are interdependent, and that resilience to climate change should be addressed across all modes.13 In African cities, transport infrastructure and networks support the mobility of people, information, and goods. Rapid urbanisation, increased infrastructure interdependence and climate-related hazards are putting pressure on transport systems and the mobility of urban communities.14 Climate impacts will be higher in those African cities which have poor and underdeveloped transport infrastructure, and limited resources to cope and adapt. 1.2.1 CLIMATE IMPACTS Climate change is likely to increase the intensity and frequency of extreme weather events such as tropical cyclones, heatwaves, wildfires and flooding. Gradual changes in mean temperatures and rainfall overtime can also increase the vulnerability of transport infrastructure to climate risks. Climate impacts degrade materials and structures, reduce the life of transport assets, disrupt transport routes and operations, and increase the cost of supplying and maintaining transport infrastructure.15 The extent to which climate change will affect transport will be dependent on several factors. These include the type of transport infrastructure, its location, design, age, condition and level of use (see Table 1). In African cities, climate change will affect drainage in those urban areas that experience rainfall above their built capacity. Increased fire events from droughts could also threaten roads. Unpaved roads are vulnerable to intense rainfall that could cause washout and reduce accessibility. In addition, highway bridges that cross water are exposed to flood events, which can further impact transport services. Disruption of the transport system has socioeconomic costs. These can affect transport owners, regulators, operators as well as users.16 1.2.2 CLIMATE RISKS TO MOBILITY AND TRAVEL Changes in the climate affect individual travel choices and behaviour (for example, time of departure and route choice). Weather can influence the comfort and safety of travellers, increasing journey times and costs due to delays and lower travel speeds.19 While warmer temperatures (24°–30°C), and dry or sunny weather may encourage walking and 1.2. CLIMATE CHANGE The World Bank highlighted the damage caused by climate change to African roads, which will require additional maintenance to ensure serviceability.15 They were estimated to cost tens of billions of dollars, with the costs to bridges even higher, at an average of USD 30 billion (2017-2050). In addition, the disruption to transport network connectivity will affect the movement of goods and services, with consequences for economic productivity. Adequate road maintenance is therefore critical to reducing the climate impact on the African road system. 8 cycling rather than car use, higher temperatures and humidity have the opposite effect. Public transport use is also reduced in extreme heat, because of having to walk or cycle as part of the route.20 As a result, active travel and public transport use may be hard to implement in hot and dry African cities. The extent to which weather will affect travel behaviour depends on transport infrastructure. African countries with high motor vehicle use and ownership will be less sensitive to daily weather variations, compared to those countries who depend on NMT. For NMT users, extreme weather events can result in less walking and cycling trips, reducing the mobility of low-income disadvantaged groups. This could cause a shift towards motorised transport, if available and affordable, especially given the cultural perception that walking in rain and heat is for poor people with no choice. For motorised private transport users, climate related weather events are likely to cause travel delays and traffic congestion. They can also increase road traffic accidents, injuries and fatalities. 1.2.3 CLIMATE ADAPTATION A climate resilient transport system is one that is planned, designed and built in a way that anticipates, prepares for and adapts to changing climate conditions. The transport sector needs to adapt to climate change by taking measures to improve climate resilience. Adaptation is not only about transport infrastructure, but includes operations and activities aimed at ensuring accessibility and maintenance of transport services. Box 1 outlines the range of adaptation strategies available for transport infrastructure. When presenting the economic case for investing in resilient transport infrastructure, socioeconomic costs of transport disruption should be considered in addition to the direct infrastructure damage costs. In Africa, measures to adapt transport infrastructure have included submersible roads (Madagascar). These are roads built with concrete rather than bitumen, enabling them to withstand flooding. Submersible roads reduce costs as they do not need to have high embankments nor require additional land. They are less disruptive to the flow of flood waters.21,22 Adaptation will require coordination between national, regional and local levels to effectively implement transport adaptation measures, which could include: • revised road construction standards; • stronger coastal road barriers and better designed locations to cope with sea level rise; and • stiffer binding road materials to cope with rising temperatures. Image: Arsenie Coseac | Flickr 9 Table 1: Potential impacts of climate on transport 17,18 Climate variable Climate event Potential impacts on transport infrastructure Potential impact on transport operations Gradual changes in average temperature and rainfall Temperature Hot days and heatwaves • Thermal expansion of bridge joints and paved surfaces. • Pavement degradation (for example, softening). • Rail-track buckling. • Slower operating speeds. • Increased maintenance and operation costs. • Limitations on periods of construction activity. • Vehicle overheating and tyre deterioration. • Interruptions in transport services because of flooding. • Weather-related delays and traffic disruption. Gradual changes in average temperature and rainfall degrade materials and structures. This can increase the vulnerability of transport infrastructure to climate impacts, which can disrupt transport operations. Rainfall Heavy rainfall • Flooding of roads, pavement, railway lines, underground tunnels, and airport runways. • Road washout, and mudslides that damage roads and railway tracks. • Scouring of pipeline roadbeds and damage to pipes. • Flooding will affect drainage, road, and pavement, driving conditions and visibility. Sea Level Rise Sea level rise together with storm surge • Inundation of roads, pavements, railway lines and airport runways in coastal areas. • Frequent flooding of underground tunnels and low-lying transport infrastructure. Storms Storms • Greater probability of infrastructure failures • Impacts on harbour infrastructure from wave damage and storm surges. • Rainfall and winds associated with storms/cyclones will create flooding, inundation of embankments and affect road transport. • Disruption to traffic safety and emergency evacuation operations. 10 10 Designing and adapting walking and cycling infrastructure to make it resilient to climate impacts can have several benefits. For example, it can protect the mobility of disadvantaged groups and promote active travel. Furthermore, by enabling the continued use of NMT, it can reduce motorised vehicle use, ease traffic congestion and decrease air pollutant emissions. Increased NMT use can improve population health and wellbeing through better air quality and higher levels of physical activity. Table 2 outlines the range of measures that can be taken to protect NMT infrastructure from climate impacts. Adaptation can also provide opportunities to promote low-emission mobility. Table 3 shows how urban form, urban design and transport policy and planning strategies can promote active travel. These measures can be adapted to apply in African cities. Box 1: Types of adaptation strategies for transport infrastructure23 • Manage/Maintain: Accepts increasing cost to repair and maintain infrastructure due to severe weather events. Absorbs increased damage into annual maintenance cycles as a cost-effective strategy for infrastructure at lower risk. • Protect/Harden: Enhances resilience of infrastructure through changing design standards (for example, higher bridge heights, elevated roadways), building engineered protection (for example, levees), and developing or enhancing natural buffers (for example, wetlands). Ensures existing infrastructure is protected from changes in the climate. • Develop Redundant Services: Prepares for intermittent loss of service by developing alternative routes or services to maintain continuity of travel when service is disrupted. • Relocate/Abandon: Reduces exposure of infrastructure by moving services to lower-risk areas. A radical option when increased vulnerability makes continued operation unfeasible. Image: Dylan Patterson | Flickr 11 Table 2: Adaptation measures for walking and cycling 24 Climate impact Adaptation measures for walking and cycling Flooding • Improve drainage infrastructure to deal with more intense rainfall events and prevent flooding. • Improve green spaces for increased water permeability and flood protection. • Consider the use of porous pavements for pedestrianised areas, cycling routes and cycle hire stations. • Elevate infrastructure in flood-prone areas. • Avoid implementing pedestrianised areas, cycling routes and cycle hire stations in areas prone to extreme flooding. • Use the city’s risk assessment plans for modelling flood risks and identifying alternative lanes, stations and areas. • Install signs high-above the ground alerting pedestrians and cyclists of unsafe zones. • Make electrical infrastructure for cycle hire stations flood proof. Extreme heat • Increase greenery around pedestrianised areas, cycling lanes and cycle hire stations to decrease outdoor temperatures. • Install drinking fountains next to cycle hire stations, along bike lanes and in pedestrianised areas. • Shade areas next to cycle hire stations and in pedestrianised zones to decrease exposure to heat. • Increased maintenance of asphalt to avoid corrosion from heat. • Design cycling routes through parks to provide cooling. • Install green roofs in proximity to pedestrianised areas, cycling lanes and cycle hire stations to provide cooling. Sea-level rise • Create vulnerability maps to identify areas at most risk. • Install high-quality, low-cost walking and cycling infrastructure along high-risk shorelines to act as barriers that reduce damage to developments in case of storms. • Improve drainage, for example, pumping of underpasses. • Elevate existing pedestrianised areas, cycling lanes and cycle hire stations in high-risk areas. • Install backup power for e-bike hires. Drought • Assess the likeliness of effects on bike lanes and pedestrianised infrastructure (risk mapping) and avoid new developments in high-risk areas. • Monitor soil conditions of existing roads and pedestrianised areas. • Increase maintenance of asphalt in pedestrianised areas, cycling routes and cycle hire stations. Landslides • Avoid pedestrianised areas, cycling lanes and cycle hire stations in landslide prone zones. • Use the city’s risk assessment plan for modelling landslide risks and identifying alternative lanes, stations and areas. • Have (removable) barriers installed to protect walking and cycling routes from landslides. 12 Table 3: Adaptation strategies that could promote active travel such as walking and cycling 25 Strategy Health benefits Adaptation in hot and dry cities Urban form • Compact city and land use diversity. • Encourages adaptive transport (walking and cycling). • Improves accessibility to work, social networks, and access to health services. • Short walking distances to reduce exposure to hot weather and solar radiation. • Dense network of pedestrian and cycling paths. • Encourages active transport. • Improves accessibility. • Shade is essential for pedestrians and cyclists. • Compact design. • Encourages active transport. • Narrow streets and courtyards provide shade for the day but can increase night-time urban heat. Urban design • Green space with tree canopies next to main pedestrian and cyclist areas. • Improves thermal comfort, exposure to fresh air and psychological wellbeing. • Modest size to conserve water. • Water bodies are not possible owing to water shortage. • Emphasis on shade trees. • Use of suitable materials colours in public spaces and on walking and cycling paths. • Prevents surface heating and reduces heat emission. • Colours should be light to avoid surface heating, but not very light to avoid thermal discomfort and glare from reflected light. • Restrict vehicle access and define pedestrian and cyclists’ zones. • Encourages active transport. • Provide shade and green spaces in such zones. • Priority given to cyclists over motor vehicles. • Encourages active transport. • Reduces road travel injuries. • Convenient for active transport. • Reduces overexposure to heat and solar radiation. 13 Table 3: Adaptation strategies that could promote active travel such as walking and cycling (continued). 25 Strategy Health benefits Adaptation in hot and dry cities Transport planning and policy • Increased accessibility and connectivity of public transport; reduced distances from residential and work zones to public transport stops with connected walking and cycling paths. • Improves accessibility, encourages active transport as a component of public transport trips. • Short walking distances reduce exposure to hot weather; shaded or cooled public transport stops. • Cycling and walking signs; pavement markings and streetlights. • Encourages active transport. • Reduces road travel injuries. • No special adaptation. • Zoning codes specifying maximum vehicle parking instead of minimum requirements. • Discourages private vehicles. • No special adaptation. Image: Sserunjogi Emmanuel | Wikimedia 13 14 1.3. CLIMATE RESILIENT TRANSPORT An inclusive and climate resilient transport system caters for the mobility needs of everyone, allowing them access to essential services, while being resilient to future climate impacts. African cities and national governments can deliver improved low carbon, and climate resilient mobility options and solutions that leaves no one behind. But this requires an inclusive transport planning process that responds to the needs of disadvantaged groups while considering the potential consequences of future climate impact on transport infrastructure. It is unclear how climate-related weather events affect the mobility of NMT users who have no alternative transport options. A better understanding of these issues, from diverse users’ perspectives is needed. Increasing participation in transport planning can improve decision-making processes by creating transparency and increasing acceptance of outcomes. More inclusive and climate resilient transport planning has multiple benefits, including: • Improved accessibility, mobility and safety of disadvantaged groups increasing opportunity, choice and dignity. Increased participation of disadvantaged groups in transport policymaking and planning processes, allowing their voices to be heard in the development of mobility solutions. • Reduced vehicle emissions by enabling and maintaining a shift from motorised to NMT, reducing tail-pipe pollutants, and improving local air quality. Vehicle pollutants include particulate matter and nitrogen oxides, which contribute to urban air pollution and climate change. • Enhanced personal security by having better designed NMT infrastructure that improves personal safety of pedestrians (including women, older persons, disabled and children), and provides protection against climate impacts. • Integration of climate issues in the transport planning process gaining consensus on actions to protect transport infrastructure. • Improved resilience of transport infrastructure, especially by adapting NMT infrastructure that serve the mobility needs of disadvantaged groups. Image: Elisha Muwanguzi | Wikimedia 14 15 Participation in transport policymaking and planning includes stakeholders in the design, development and delivery of transport projects. Consultation has been the primary mechanism for participation in transport planning. However, consultation does not guarantee all voices are considered or heard.26 There is a rising awareness of the value of increased active participation of different stakeholders in the co-design, development, and delivery of change in the transport sector.27 Co-design recognises the role that local knowledge, expertise and preferences can have in developing a more inclusive and climate resilient transport system. It means moving away from knowledge transfer to knowledge sharing and early engagement in the transport planning process.28 This requires using a wide range of engagement approaches to ensure the inclusion of vulnerable and disadvantaged groups.29 Participation should ultimately move towards empowering disadvantaged individuals and groups. However, this will take time, effort and eventually cultural change. The next section presents a range of creative tools available to engage individuals who are often under-represented in transport policymaking and planning processes. These tools allow different voices to be heard in the co-design, development and delivery of climate resilient transport policies and plans in African cities. 1.5. RESOURCES International Bank for Reconstruction and Development /The World Bank (2019). From A Rocky Road to Smooth Sailing: Building Transport Resilience to Natural Disasters. | https://openknowledge.worldbank.org/bitstream/handle/10986/31913/From-A-Rocky-Road-to-SmoothSailing-Building-Transport-Resilience-to-Natural-Disasters.pdf Summarises the main findings on the risk faced by transport networks and users because of natural disasters and climate change, outlines recommendations for building more resilient transport networks. OECD (2018). Climate-resilient Infrastructure, Policy perspectives. OECD environment policy paper no. 14. | https://www.oecd.org/environment/cc/policy-perspectives-climate-resilient-infrastructure.pdf This report highlights emerging good practices and remaining challenges in climate-resilient infrastructure across OECD and G20 countries. Sustainable Urban Transport Project (2021). Adapting Urban Transport to Climate Change, Module 5f.| https://sutp.org/publications/sutp-module-5f-adapting-urban-transport-to-climate-change-ed-2/ This sourcebook guides urban transport professionals on how to incorporate climate change considerations into their decisions and how and when to ensure climatic changes are being appropriately factored into transport policy, design, and implementation. World Bank (2022). Adaptation Principles: A Guide for Designing Strategies for Climate Change Adaptation and Resilience. | https://openknowledge.worldbank.org/handle/10986/34780 The Adaptation Principles offer a guide to effective climate change adaptation, containing hands-on guidance to the design, implementation, and monitoring of national adaptation strategies. 1.4. PARTICIPATION 16 2 Participatory tools for inclusive climate resilient transport planning 16Image: Social Income | Unsplash 17 PARTICIPATORY TOOLS FOR INCLUSIVE CLIMATE RESILIENT TRANSPORT PLANNING This section outlines a range of creative participatory methods that can be used in the assessment of current mobility and climate resilience. Creative participatory methods enable participants to imagine and create objects, environments, or experiences to share and explore ideas, possibilities, and challenge current thinking. An overview of each tool is given below, together with key steps involved in its application. Each of these methods encourages engagement from often hardto-reach vulnerable participants through on-street activities or creative approaches, enabling their voices to be heard in transport policymaking and planning process. 2.1. SELECTING AN APPROPRIATE METHOD This process begins with a decision tree framework (Figure 1) to aid in the identification of an appropriate method depending upon the purpose and goals of the planning activity. Figure 1: A decision tree to assist in the selection of participatory methods 18 Follow the three key steps below to select appropriate participatory methods. Decision tree guidance Step 1 Identify the key decision-making focus that requires wider inclusion. • Climate resilient transport (left-hand side of decision tree). • Current mobility choices (right-hand side of the decision tree). Note: If you are looking at existing interaction of climate on mobility, use the right-hand Current mobility options. Step 2 Identify the purpose of your engagement: • Consensus Building: Activities where you are trying to bring diverse stakeholders together to agree on a shared direction for a decision or policy. • Scenarios and Visioning: Activities when you are generating ideas on how to get to a specific future (what changes are required) or what is likely to happen if a particular policy or development is implemented. • Monitoring and Evaluation: Activities where you have implemented a policy or infrastructure change and want to assess the effects on stakeholders, including vulnerable groups or where you are establishing a baseline of current conditions for different groups. Step 3 Identify the creative methods options that could widen inclusion and deliver your engagement purpose: • Deliberative approaches – Useful for deciding on future strategies among a range of options or to work towards a consensus on disputed topics. • Narratives – Combines storytelling or image creation (photos, art canvases, etc.) that communicate participants’ stories of the future. These approaches can identify specific local contexts and cultural factors that should affect planning and infrastructure developments, including existing effects of climate change. They can be used on-street, in meetings or allow participation over a longer timeline. • Digital stories – Combine photo-voice (where participants take their own pictures to illustrate their situations); documentary photography (where professional photographers take images to communicate someone else’s experiences); and participant-directed video tours that explore community knowledge. • Participatory mapping – These are methods that collect information from participants in a spatial framework (a paper or digital map). The information can include their knowledge of local mobility conditions or ideas of future options. They can be used onstreet, in meetings, or online engagement. • Streetscape models – Are on-street methods where participants interact with streetscape models to identify current mobility challenges or suggest infrastructure improvements for improved futures. They are engaging and interactive, encouraging participation. • Placemaking activities – Are engagements focused on improvements in a particular location. Activities can include a range of creative methods to develop new ideas on place improvements or sensitise stakeholders to planned changes. • Infrastructure experiments – These are temporary changes to infrastructure to encourage a behaviour change typically to improve safety, encourage modal shift, or identify unexpected impacts of a proposed scheme before full permanent implementation. Further information for each tool, its application, advantages and disadvantages, and resources required are given below in each dedicated section. 19 2.2. PARTICIPATORY MAPPING Participatory mapping is a map-making process that attempts to understand the views of local community members using a spatial framework. Two types of participatory mapping exist: paper participatory mapping and digital Participatory Geographic Information System (P-GIS).30 Key differences between these two approaches are explained by what happens to the data after it is collected from participants.31 To be called a P-GIS process, the paper participatory map needs to be transformed into a digital format (digitised). This digital data can then be further analysed or interrogated using GIS software to provide visualised outputs for effective communication and decision-making.32 Figure 2 shows an example of the different stages undertaken in a typical P-GIS activity engaging vulnerable groups in a current mobility assessment.33 Figure 3 presents a decision tree to help decide whether a participatory mapping or P-GIS activity is a suitable method for your planning activity. The process consists of 4 steps. Figure 2: On-street participatory mapping approaches and data conversion into a digital P GIS visualised as hot spots (a) On-street participatory mapping (b) Resulting community map (c) Digital Participatory GIS map Images: D Mwamba| ZRST 20 Figure 3: Decision tree for the type of participatory mapping 21 2.2.1 PARTICIPATORY MAPPING IN AFRICA Participatory mapping has been used to map the journeys of vulnerable groups in two Kenyan cities (see Box 2). Workshops were undertaken to identify, compare and differentiate specific mobility and wellbeing challenges experienced by vulnerable groups. The participatory mapping method was used to develop stakeholder-led solutions to achieve sustainable and equitable mobility. Box 2: Participatory mapping in action Kenya - Participatory journey mapping with disadvantaged groups34 Participatory mapping was used to reveal the lived mobility experiences of disadvantaged groups (see Figure 4). The assessments considered how informal mobility solutions adopted by these groups interact with current transport infrastructure and systems. Outputs included physical and digital maps (see Figure 5). These maps highlighted individual journey types, transport mode, locations that impede individual mobility and positive locations. The maps also identified locations where specific solutions were required to improve journeys. The data on mobility issues (positive and negative) from disadvantaged residents was used to co-design transport improvements in infrastructure with engineers and transport planners to help increase accessibility and wellbeing. Figure 4: Participatory mapping with residents from a low-income community in Mombasa, Kenya Image: S Omang | SEI Figure 5: Journeys and mobility patterns in Nairobi for residents of an informal settlement Table 4 outlines the benefits and drawbacks of applying participatory mapping for inclusive transport resilient transport in Africa. 22 Table 4: On-street participatory mapping in the African context On-street participatory mapping in the African context Benefits Drawbacks • Accesses a high number of participants who would not attend a meeting – for low costs. • Speaks to many participants in a brief space of time. • Records the spatial dimension of the issue. • Engages participants. • Can repeat at different times or places to widen participation. • Analyses in GIS can add value to the data and help visualise the findings for effective communication to decision makers, etc. • Activity must be quite brief – so can lack depth. • Requires trained facilitators and knowledge of GIS to undertake effectively. • Participants can only come from those using the space – not those excluded. • No discussion between participants – all individual answers. Resources required • Trained facilitators. • Access to large-scale maps and ability to print maps. • Stickers or pens for recording locations. • Recording sheets to identify demographics of participants and question responses linked to mapped locations. 22 Image: D Mwamba | ZRST 23 2.3. PARTICIPATORY NARRATIVE APPROACHES Participatory narrative approaches involve individuals gathering and working with raw stories of personal mobility experiences to make sense of complex situations for better transport decision-making.35 Participatory narrative approaches consider values, beliefs, feelings and perspectives by recounting and interpreting lived experiences. Elements of fact, truth, evidence, opinion, argument, and proof are used to form a perspective and to gain a perspective.36 Narrative approaches can be used to identify specific local contexts and cultural factors that affect transport planning and infrastructure developments, including current climate change impacts. Participatory narrative approaches include digital storytelling. This is a simple creative process in which film, images and voice over can tell a personal story. The digital storyteller requires little experience in video production but has a desire to document their lived mobility experience. Digital storytelling includes: • Photo-voice (where participants take their own pictures to illustrate their situations); • Documentary photography (where professional photographers take images to communicate someone else’s experiences); and • Participant-directed video tours that explore community knowledge. Figure 7 presents the steps to follow in undertaking digital storytelling. Table 6 outlines the benefits and drawbacks of applying digital storytelling for inclusive climate resilient transport in Africa 2.3.1 DIGITAL STORYTELLING IN AFRICA Digital storytelling has been used in Uganda to assess the impact of implementing a Boda-boda (motorcycle-taxi) Free Zone in Kampala on the mobility of disadvantaged groups. Image: H Cambridge | SEI 23 24 The approach was used to create short individual digital stories, allowing users to share their experiences and views about their daily journeys (see Box 3). A similar approach was used to explore the mobility challenges of mothers in Côte d’Ivoire (see Box 4). Figure 7: Key steps for undertaking digital storytelling activities. Image: H Cambridge | SEI 24 25 Box 3: Digital storytelling in Africa Uganda - Mobility narratives of Boda-boda (motorcycle taxi) users37 Digital storytelling was used in Kampala, Uganda to explore the impact of implementing the Central Business District Boda-boda Free Zone on the mobility of disadvantaged groups. Short narratives shared individuals’ experiences of their daily travel. The process involved following steps: • Recruited volunteers included a pregnant mother, a person with physical disability, a pedestrian, a bicycle rider and a youth. The purpose of the activity was explained to participants and informed consent obtained for best ethical practice. • Capturing individual experience through videos and photos using a digital camera operated by a professional photographer. The participants and the project team/facilitators worked together to produce powerful stories. The participants described transects along the usual routes they took, then identified and talked about locations where vulnerable individuals, such as themselves, face personal mobility challenges. • Commentary to the video, captions and audio were added by the project team. Computer software was used to organise, edit, arrange, and produce a coherent narrative to the issues. Feedback was provided from the participants to ensure the stories were representative of their viewpoints. • These mobility narratives provided insights into lived experiences and issues that would have otherwise been inaccessible to transport planners or urban decision makers. Box 4: Digital storytelling in Africa Cote d’Ivoire - Mobility narratives with mothers of young children38 Digital storytelling was used to explore the daily mobility challenges of mothers in Yopougon, Côte d’Ivoire. The study used written and photographic time-space diaries to understand the mobility of mothers throughout the city and their experiences of different journeys and travel modes. The research team undertook forty interviews where participants completed a mobility diary detailing journeys undertaken during the previous 24 to 48 hours. An additional five participants were given a digital camera and asked to photograph their regular activities during a five to ten-day period. The participants then reviewed their images and discussed the activities, places, and forms of transport each image depicted. This process provided participants with opportunities to recount and reflect on their activities, comment on aspects of individual trips, and discuss regular day-to-day trips versus more unusual ones they undertook. Using these mobility diaries and photovoice insights, the study illustrated the main daily barriers mothers face using the current transport system. Table 5 highlights the benefits and drawbacks of the digital storytelling approach. 26 Table 5: Digital storytelling – mobility narratives in the African context Digital storytelling – mobility narratives in the African context Benefits Drawbacks • Powerful and interesting method to convey personal experience. • Participants suggested ways of improvement. • Cheap method is to use a mobile phone. • Easily adopted by disability rights groups. • Easy to disseminate using social media. • Can be one-sided – need to hear the perspectives of all stakeholders. • Activity can be time-consuming, for example, editing the video into 2-3 mins. • Safety issues –how video footage is obtained, for example, on the back of Boda-boda and locations chosen–along busy roads. • Ethical challenges of allowing participants to remain anonymous if required. Resources required • Access to suitable cameras (these can include mobile phones) and microphones. • Access to editing software for compiling the video footage into a digital story. • Staff with expertise in video creation and editing. Image: Hennie Stander | Unsplash 26 27 2.4. SCENARIO AND VISIONING ACTIVITIES Scenarios can be used to develop alternative transport futures based on combinations of assumptions, facts and trends, while visioning can define and outline pathways to a preferred future situation.39 Creative engagement methods can stimulate new ideas or solutions to urban mobility challenges. Scenario and visioning activities enable a wider range of people to take part. This ensures identified solutions meet the needs of everyone and disadvantages are recognised. Using narrative approaches (and linking them to other creative engagements, including participatory mapping) can identify varying preferences or synergies between options for different disadvantaged user groups. Figure 8 outlines the key steps involved in scenario and visioning activities.40 Table 6 outlines the benefits and drawbacks of applying scenario and visioning activities for inclusive climate resilient transport in Africa. 2.4.1 SCENARIO AND VISIONING ACTIVITIES IN AFRICA On-street engagement methods were used to explore the potential impact of proposed road improvements in Uganda. Figure 9 shows an example of on-street engagement visioning exercises using artistic approaches in a predictive exercise where a desired future infrastructure change had been identified. Based on this analysis, suggestions were made to modify the proposed plans (see Box 5). Image: Sylvester Mambwe | Unsplash 27 28 Figure 8: Key steps for developing narratives 29 Box 5: Scenarios and visioning activities in Africa Uganda – On-street creative engagement to explore community visions for a street improvement40 To raise public awareness of upcoming changes and explore potential challenges associated with road improvements, creative methodologies were used in a series of on-street engagement activities in Kampala city. The road improvements planned by Kampala Capital City Authority reduced access for motorised transport into the Central Business District to improve road safety and improve air quality. However, there was public concern about the plans and a further investigation was undertaken to ensure that the planned benefits would be delivered. Art canvases were used to engage users in the streetscape to communicate visually the official scheme and capture participants’ scenarios of how the improvements might affect their livelihoods or mobility options (see Figure 9). Using these visions of predicted future impacts, the team investigated how participants could overcome any perceived challenges the scheme would bring and enabled them to suggest minor modifications to the proposed improvements to deliver the desired future mobility benefits. This visioning activity proved useful in engaging street users who were not aware of the proposed upgrades to the infrastructure. It also helped identify potential challenges that could be caused by unexpected behaviours from different stakeholders as they adapted to the changed infrastructure. This was a form of predictive visioning in that the proposed future improvement to transport infrastructure was known; the challenge was understanding how to incorporate the concerns of stakeholders. Figure 9: On-street engagement visioning exercises in Kampala, Uganda using participatory art Image: H Cambridge | SEI 30 Table 6: Scenarios and visioning in the African context Scenarios and visioning in the African context Benefits Drawbacks • Allows a wider range of stakeholders to engage in deciding future developments. • Can identify undesirable futures but also ways to mitigate or prevent these outcomes. • Low-cost activity that can stimulate creative thinking for typically excluded or vulnerable groups. • Can be time-consuming to canvas a wide range of people. • Resulting findings need to be interpreted. • More appropriate to use either as a scoping activity (before any plans are identified– see placemaking) or to refine a specific plan (once a scheme has been designed). Resources required • Staff with expertise of facilitation and creative methods. • Appealing resources such as art canvases to engage on-street participants. 2.5. POP-UP CREATIVE ACTIVITIES Pop-up creative activities use artworks, streetscape models or place making activities to capture local knowledge. They also identify community preferences for transport infrastructure. Pop-up approaches include streetscape models and placemaking. Table 8 outlines the benefits and drawbacks of pop-up creative activities and experiments for inclusive transport resilient transport in Africa. 2.5.1 STREETSCAPE MODELS Architectural 3D streetscape models provide an alternative to participatory mapping. They can be used in on-street engagements or focus group meetings to enable participants to visualise and communicate their knowledge of an environment and preferences for change. This may involve physically moving or introducing additional elements into the model streetscape. These activities provide elements of ‘play’, encouraging creative thinking and exploring different options. Figure 10 provides examples of how streetscape models have been used in transport planning engagements. 31 Images: M Ojal Images: H Cambridge | SEI Figure 10: Use of streetscape models in Nairobi (Kenya) to identify road safety improvements during on-street events and in a stakeholder workshop with paratransit operators 2.5.2 PLACEMAKING Placemaking for transport planning is a practical process for transforming public spaces to improve mobility choices, road safety and climate resilience.41 It involves observing, listening to, and asking questions of the people who live, work and use a particular space. Placemaking can provide an understanding of individual needs and aspirations for a selected space and the local community. The process should include vulnerable users or people who are excluded (for example, disabled users) from using the space. Figure 11 shows placemaking activities that focused on traffic calming and pedestrianisation in Nairobi’s central business district. Figure 11: Placemaking activities in Nairobi using temporary interventions to explore road improvement options with street users, including the business community 32 2.5.3 INFRASTRUCTURE EXPERIMENTS Within placemaking activities, there are opportunities to undertake experiments with infrastructure. These can include the temporary closure of streets to motorised traffic to explore safety and active travel options; or utilising the streetscape for alternative community or economic purposes (for example, recreation spaces and/or cafés or on-street vendors).42 Temporary or semi-permanent (painted) interventions can be linked to placemaking activities to disrupt the business-as-usual behaviour of vehicle drivers and pedestrians to assess the factors that influence road safety. These type of interventions are useful as they can be removed and installed in new locations to maintain the ‘surprise’ element for vehicle drivers. Figure 12 shows how a pop-up 3D zebra crossing infrastructure experiment in Uganda changed vehicle driver behaviour and improved road safety for vulnerable road users. Figure 13 outlines the key steps to follow to undertake placemaking activities. Another 3D zebra crossing was installed on a busy road in Lusaka, Zambia. The effect of this was to reduce the speed of motorists, creating a safer environment for vulnerable road users (see Box 6). Figure 12: Infrastructure experiments to assess the effectiveness of 3D Zebra crossing in Kampala, Uganda Image: A Mwesigwa / i-CMiiST 33 Figure 13: Key steps for undertaking placemaking activities. Note: curved white arrows represent feedback loops and iterative activities; straight white arrows link to method or intervention suggestions. 34 Follow the key steps below to implement a placemaking activity. Placemaking guidance Step 1 • Locate a boundary around a specific neighbourhood or streetscape that you want to improve. • For that place identify who are the key stakeholders you want, or should, engage with – this could include representatives of vulnerable groups. Stakeholders should have some direct connection, as well as an interest in, the space. Step 2 • Evaluate the current conditions in the space – this can be qualitative (interviews, surveys) or quantitative assessments (traffic counts etc.). • With the key stakeholders identify the challenges affecting mobility, road safety, climate change impacts etc. in that place. Participatory mapping can be a useful approach to understanding what and where problems are occurring – and for who? Step 3 • Brainstorm solution ideas with key stakeholders on how to overcome the key challenges identified in Step 2 • Most often these will be physical changes to infrastructure; but could include behaviour changes – like removing pavement parking; or changes to the way the place is managed – like enforcing speed limits or providing a dedicated space for vendors, etc. • Identify how the changes will improve mobility or climate resilience; who will benefit; and any barriers to implementation. Streetscape models or participatory mapping can help co-design a plan. Step 4 • Identify temporary low-cost activities to test the co-designed solutions. This could include temporarily closing or reducing traffic on a street; widening pavements; introducing traffic calming or trying changes to infrastructure – such as our 3D zebra crossing example. Step 5 • Monitor the impacts of the temporary activities – during the experiment (re-assess the use of the street) • Make sure to consider the impacts on vulnerable groups mobility • Afterwards re-evaluate the co-designed plan – and repeat until an optimum solution has been reached or make incremental changes to the place (for example, start with building pavements – then reduce car access or add a cycle lane). Step 6 • Implement the final version of the place improvements. 35 Box 6: Infrastructure experiments in Africa Zambia – 3D Zebra crossings 43 In 2021, a 3D zebra crossing was installed at a major intersection in Lusaka to increase drivers’ awareness of other road users (see Figure 14). The purpose of the 3D crossing was to create a strong visual impact for approaching drivers, encouraging them to reduce their speed. Figure 14: Installation of the 3d zebra crossing in Lusaka, Zambia Image: D Mwamba / ZRST Vehicle speeds were measured before and after the installation. Results showed a decline in average speeds from 19.3 km/h to 16.9 km/h. An evaluation of pedestrian experience found that over 80% of respondents felt ‘safe’ or ‘very safe’ using the crossing. Using creative infrastructure such as 3D zebra crossings has the potential to improve the safety of vulnerable road users. Table 7: Pop-up activities and infrastructure experiments in the African context Pop-up activities and infrastructure experiments in the African context Benefits Drawbacks • Can explore the impact of schemes in a low-cost temporary way. • Temporary interventions can help inform and refine the development of final schemes. • Allows participants to explore or experience potential futures. • Helps reveal any dis-benefits or excluded groups allowing mitigation measures to be identified. • Requires making temporary interventions – that can cause some disruption. • Requires careful negotiation with local stakeholders to ensure acceptance. • Need to monitor the effects of pop-up activities to assess participation rates. Resources required • Depending on activity – it could require paint, facilitators, posters, or other activities to explore mobility options. 36 2.6. A DELIBERATIVE APPROACH A deliberative approach can determine views, test policy questions and gain consensus on future alternative transport and mobility strategies. The Delphi Method is one approach for undertaking this deliberation. This method is focused on experts (that can include representatives of disadvantaged groups) rather than engaging directly with vulnerable communities.44 The method involves sharing experts’ anonymised questionnaire responses to assess existing consensus or disagreement on transport planning options, or the feasibility of desirable futures. Deliberative methods incorporating a Delphi approach have been used to structure transparent participation approaches. Figure 15 outlines the key steps involved in implementing an iterative Delphi process. The Delphi questionnaires can be combined with creative methods (such as participatory mapping) to add details on the location or local contextual factors to the deliberations. Table 8 outlines the benefits and drawbacks of a Delphi method for inclusive transport resilient transport in Africa. Figure 15: Key steps involved in implementing an iterative Delphi process. 37 Follow the key steps below to use the Delphi method for deliberative consensus building activities. Delphi survey guidance Step 1 • You need to identify the focus of the survey – what topic do you want to build consensus around? • For example, this could be – how best to build climate resilience or how to widen inclusive mobility choices. Step 2 • Who are the range of participants who will have knowledge or interest in this topic – who do you want to reach consensus? Should they include representatives of disadvantaged groups or communities? • For debate and influencing opinions you ideally want participants with a range of views and perspectives so that there will be a useful exchange of ideas to build consensus. • A Delphi survey may involve 10 to 50 participants. There is often drop out over iterations – so participation may reduce over time. Step 3 • Develop your initial starting questions related to the topic of your survey. • The first questionnaire typically identifies key issues and generates as many ideas as possible. Step 4 • Deliver your survey to participants. This can be done electronically – which aids analysis or on paper if digital approaches would exclude some important participants – for example low-income community representatives. Step 5 • The initial survey responses are analysed to assess key themes and justifications for different points of view from participants. • The second questionnaire anonymously feeds back all the first-round ideas to participants. This questionnaire should refine each idea, capturing comments on their strengths or weaknesses. • Follow-up questionnaires summarise the input from the second questionnaire and ask for further clarifications. • This can be repeated as many times as necessary until consensus on key points is reached or viewpoints harden into distinct groups. Step 6 • The final report should highlight the new consensus view on likely future developments, or the range of possible developments and their relative strengths or weaknesses. Note: Steps 1 to 4 are required for preparation of the survey. Step 5 is iterative, with the survey rounds repeating until consensus is achieved or divergent positions remain entrenched when Step 6 is undertaken reporting the final outcomes 38 Table 8: Delphi method application in the African context Delphi method in the African context Benefits Drawbacks • Can identify key areas of consensus and disagreement – focusing discussions on points of contention. • Iterative knowledge exchange between peers can build consensus on topics. • Anonymous participation encourages free expression of ideas. • Mapping approaches can help identify at-risk infrastructure in specific places. • Over 70% of the experts engaged in the online mapping, showed that they would find this approach useful in their work. • Requires multiple iterations to build consensus – so time consuming. • Participant fatigue and drop out limit’s consensus development. • Face-to-face discussions could be more effective for building consensus. Resources required • Access to online questionnaire software. • Staff with suitable skills in questionnaire development and statistical analysis. • A pool of experts who will give their time to take part in this process. Image: Lens Envy | Flickr 38 39 2.7. RESOURCES Biderbeck, D. et al. (2021) Preparing, conducting, and analyzing Delphi surveys: Cross-disciplinary practices, new directions, and advancements |https://www.sciencedirect.com/science/article/pii/S2215016121001941 The paper comprehensively demonstrates how to prepare, conduct, and analyse a Delphi study. IDIG Stories (2017). Digital storytelling (DST) toolkit. A practical ‘shortcut’ guide to running a DST workshop | http://idigstories.eu/wp-content/uploads/2017/05/digital_storytelling_toolkit_eng.pdf The DST Digital Storytelling toolkit aims to provide a practical ‘shortcut’ guide to running a DST workshop. Living Cities (2018). 14 smart ways to create public space Real examples from sub-Saharan Africa | http://www.livingcities.se/uploads/1/5/3/3/15335706/4658_skl_symbiocity_public_space_july_2018_1- 32_email_spreads.pdf This publication highlights current placemaking efforts in Sub-Saharan Africa and reveals a broad range of public space projects, methods, and initiators SUTP (2017). Sustainable Urban Mobility Plans | https://sutp.org/publications/inua-1-sustainable-urbanmobility-plans/ This SUTP guide focusses on Sustainable Urban Mobility Plans as a practical tool for identifying and shaping actions for sustainable mobility. SUTP (2020). A Tactical Urbanism Guidebook | https://sutp.org/publications/a-tactical-urbanism-guidebook/ This guidebook decodes the various aspects of Tactical Urbanism – an emerging city-shaping approach. It be adapted to a range of local contexts and is relevant to citizens, experts, and urban local bodies. T-SUM (2021). Transitions to Sustainable Urban Mobility Participatory policy planning | https://core.ac.uk/download/pdf/154444688.pdf The objective of the report is to provide one illustration of how to implement participatory policy processes in the mobility sector, in the context of rapidly growing Sub-Saharan African cities. Image: Sven Hansen | Flickr 39 40 3 Final Considerations Image: Cordelia Persen | Flickr 40 41 3.1 FINAL CONSIDERATIONS This section summaries the key messages from the guidance and outlines actions that transport planners, decision makers and representatives of disadvantaged groups could take to move towards more inclusive climate resilient transport in Africa. This guidance document has outlined core concepts and principles relevant to climate inclusive transport. It has identified three key areas where creative participatory methods can be used: (1) scenarios and visioning; (2) monitoring and evaluation; and (3) consensus building. In Section 2, Figure 1 presented a decision tree to assist in the selection of participatory methods with further information provided in the relevant sections. The guidance has focused upon introducing creative methods which show the most promise for widening inclusion and climate resilience in African transport planning. Implementing creative and participatory approaches will require a change in how transport consultation, planning, and decision-making is undertaken. While increasing inclusion and participation may appear time-consuming compared to conventional consultation activities, it can enhance the quality of information used to make decisions. This should result in more inclusive and equitable outcomes that may, in the medium-term, be more robust, cost-effective, and sustainable. Enabling this shift will also require representatives of disadvantaged groups to engage in participation and co-design activities. 3.1.1 COMMON CHALLENGES Typical issues encountered in using creative and participatory methods include: • Availability of human and financial resources to undertake a participatory approach. The advantages of developing more acceptable planning solutions should be highlighted to secure the required resources. Hiring specialists (for example, facilitators, artists, photographers, or filmmakers, etc.) may be cost-effective in some settings when using these methods. • Motivating and sustaining interest of stakeholders involved in the process. This can be achieved by establishing a shared vision and outlining short-term and long-term benefits, maintaining good communication and varying engagement methods to encourage sustained participation. 3.1. SUMMARY Image D Mwamba | ZRST Image D Mwamba | ZRST 42 • Balancing power relationships. Advocates of increased participation often talk about rebalancing the power relationships between different actors in the decision-making process. This can appear threatening or undermining to transport planners and policymakers. However, better understanding and inclusion of the needs of diverse groups can deliver better information enabling improved outcomes and more transparent decisions. This will benefit all stakeholders, including planners. • Knowing when to use participatory approaches. For some decisions, increased participation or inclusion may not be required, desirable or ethical (for example, when an overarching national policy dictates a local infrastructure change). In these situations, more conventional consultation or informing vulnerable communities or affected stakeholders may still be appropriate. Improved inclusion using the range of creative methods advocated here should only be undertaken when engaging a wider range of stakeholders can affect the decision-making outcome. African transport planners, practitioners, and representatives of disadvantaged groups can take several steps to move towards more inclusive and climate resilient transport. These are outlined below. 3.1.2 TRANSPORT PLANNERS AND PRACTITIONERS Planners and decision-makers engaged in delivering transport infrastructure should use creative participatory approaches in existing transport planning or policymaking processes. • Review existing planning rules and practices and propose amendments to include more participatory engagement approaches. This should include a requirement for increased citizen engagement from disadvantaged groups. • Promote the use of creative participatory methods when widening engagement and inclusion. • Listen to the concerns of vulnerable transport users and explicitly consider the effects of decisions on these disadvantaged groups. • Publicise proposed transport planning infrastructure changes through various media to sensitise people to change. • Undertake campaigns to encourage the participation of NGOs and citizen groups that represent disadvantaged constituencies. Data needs to be gathered and integrated into transport policymaking and planning processes to achieve more inclusive climate resilient mobility outcomes. • Collect data on climatic conditions and weather patterns and trends to determine climate risk to local transport infrastructure. • Improve understanding of travel behaviours, mobility patterns and the needs of transport users, especially those from low-income disadvantaged groups. • Gather local knowledge from communities to identify climate risks to local transport infrastructure (for example, localised flooding issues, extreme heat impacts on roadways, etc.). This information can supplement and enhance climate change forecasts from national agencies. Inclusion and accessibility should be integrated into existing and future transport plans. • Listen to the concerns of a wider cross-section of users to reduce conflicts and costs associated with retrofitting of new transport infrastructure, and address missed opportunities or unexpected behaviours from excluded groups. • Implement plans based on robust information and data, integrate mode choices and user needs, and consider future mobility innovations (for example, electric vehicles). • Universal access design principles (i.e., design that promotes access for individuals with disabilities) should be integrated into street planning and implementation. Lessons learnt should build on good practice to inform policy and upskill practitioners and enhance future projects. • Evaluate and document lessons and good practice through effective monitoring and evaluation. 43 • Put in place citizen evaluation of planning processes through project steering committees that include representatives of disadvantaged groups. If necessary, provide training for these representatives so that they are empowered and can participate effectively. • Document key learning for practitioners in guidance, policy, and legal documents. 3.1.3 DISADVANTAGED GROUPS It is critical for disadvantaged groups to be included in transport planning to ensure their voices and concerns are heard and considered. Disadvantaged groups or their representatives should aim to: • Use current national and international legal frameworks (for example, the UN Convention on the Rights of Persons with Disabilities)45 when advocating for mobility rights. • Assist in identifying areas of greatest mobility concern that require improvements in transport infrastructure relevant for their stakeholders. • Collect their own baseline monitoring and evaluation information or develop visions for the future using the creative engagement approaches outlined here. This information can be used to lobby for inclusion or for improved decision outcomes. Planners should empower disadvantaged groups to take part in processes that inform and influence the design, development, and delivery of transport policy and planning outcomes. Disadvantaged groups should be prepared to participate in these improved official processes. They should be ready to: • Voice their concerns in a coordinated manner. • Familiarise themselves with ways of achieving accessibility, considering their stakeholders unique mobility challenges. Creative participatory processes can empower and upskill disadvantaged groups. In doing so, these groups will better be equipped to control other areas of their lives. This will lead to the institutionalization of changes and enhance the quality of life for disadvantaged communities. Image: S Omangi | SEI 43 44 GLOSSARY Adaptation: The process of change to moderate or avoid harm/exploit beneficial opportunities from actual or predicted climate impacts. Climate impact: The effect of climate hazards on natural and human systems. Climate risk: The potential consequences caused by climate change. Climate-resilient transport system is one that is planned, designed, and built in a way that anticipates, prepares for, and adapts to changing climate conditions. Creative methods enable participants to imagine and create objects, environments, or experiences to share and explore ideas, possibilities, and challenge current thinking. Inclusive transport encompasses transport policies that promote equality and nondiscrimination by improving mobility and access to essential services such as education and health for everyone. Transport resilience: The capacity of a transport system to cope with a hazardous event. ACRONYMS FCDO UK Foreign, Commonwealth and Development Office GHG Greenhouse gases GIS geographic information system HVT High volume transport NMT Non-motorised transport P-GIS Participatory-Geographic Information System UN United Nations REFERENCES 1. Stucki M. (2015). Policies for Sustainable Accessibility and Mobility in Urban Areas of Africa. Sub-Saharan Africa Transport Policy Program (SSATP). No. 106. World Bank, Washington, DC. Available from: https://openknowledge.worldbank.org/handl e/10986/24089 (date accessed 17/3/22). 2. Sub-Saharan Africa Transport Policy Program (SSATP) (2005). Non- motorized transport in African cities: lessons from experience in Kenya and Tanzania. SSATP working paper no. 80. Africa Region, World Bank, Washington DC. Available from: https://www.ssatp.org/publication/nonmotorized-transport-african-cities-lessonsexperience-kenya-and-tanzania-0 (date accessed 17/3/22). 3. UNEP (2019). Calculating the potential climate value of Non-Motorised Transport projects in African Cities. UN Environment Programme, Nairobi. Available from: http://www.airqualityandmobility.org/PDFs/C limateValue_NMT.pdf (date accessed 17/3/22). 4. UNEP (2020). Used vehicles and the environment. UN Environment Programme, Nairobi, Kenya. Available from: https://www.unep.org/resources/report/glob al-trade-used-vehicles-report (date accessed 17/3/22). 5. Lucas, K., van Wee, B. and K. Maat (2016). “A method to evaluate equitable accessibility: combining ethical theories and accessibilitybased approaches.†Transportation 43:473– 490. DOI: https://doi.org/10.1007/s11116- 015-9585-2 6. Porter G, Albane A and Lucas K (2020). User diversity and mobility practices in SubSaharan African cities: understanding needs of vulnerable groups. The Volvo Research and Educational Foundation VREF, Gothenburg, Sweden. Available from: http://www.vref.se/download/18.74c15c6d1 73d8c1d0b2ea183/1607408440344/1- User%20diversity%20and%20mobility%20pra ctices%20in%20SubSaharan%20African%20cities%20-2020.pdf (date accessed 17/3/22). 45 7. Demand ASME (2018). The African commute: city transport trends. Trend analysis on African transportation by Engineering for Change in partnership with Yamaha Venture. Available from: https://medium.com/impactengineered/the-african-commute-citytransport-trends-cf369e5106bd (date accessed 17/3/22). 8. Salon, D. and S. Gulyani (2010). “Mobility, Poverty, and Gender: Travel ‘Choices’ of Slum Residents in Nairobi, Kenya.†Transport Reviews 30(5): 641–57. DOI: https://doi.org/10.1080/01441640903298998 9. Remy, S., Permezel, M. J. and C. Ngomsi (2012). “Transport and Mobility in SubSaharan African Cities: An Overview of Practices, Lessons and Options for Improvements.†Cities 29(3): 183–89. DOI: https://doi.org/10.1016/j.cities.2011.11.005 10. EU (2015). Social inclusion in EU public transport. European Parliament. Available at: https://www.europarl.europa.eu/RegData/et udes/STUD/2015/540351/IPOL_STU(2015)54 0351_EN.pdf (date accessed 17/3/22). 11. Gorman, M., Jones, S. and J. Turner (2019). “Older people, mobility and transport in lowand middle- income countries: A review of the research.†Sustainability 11(21):6157. DOI: https://doi.org/10.3390/su11216157 12. WMO (2020). “State of Climate in Africa 2019.†World Meteorological Organization, Geneva. Available at: https://public.wmo.int/en/ourmandate/climate/wmo-statement-state-ofglobal-climate/Africa (date accessed 17/3/22). 13. UNCTAD (2019). Why the transport sector needs to adapt to climate change. United Nations Conference on Trade and Development. Available at: https://unctad.org/news/why-transportsector-needs-adapt-climate-change (date accessed 17/3/22). 14. Pregnolato, M., Ford, A., Wilkinson, S. M. and R. J. Dawson (2017). “The impact of flooding on transport: a depth-disruption function.†Transportation Research D: Transport and Environment 55:67-81. DOI: https://doi.org/10.1016/j.trd.2017.06.020 15. Cervigni, R., Losos, A., Chinowsky, P. and Neumann J.E. (2015) Enhancing the Climate Resilience of Africa’s Infrastructure: The Roads and Bridge Sector. Africa Development Forum series. Washington, DC: World Bank. DOI: https://doi.org/10.1596/978-1-4648- 0466-3 16. Dickson R and De Sousa D (2010). Climate change and transport infrastructure: are we travelling in the right direction? Australasian Transport Research Forum. Available at: https://www.australasiantransportresearchfo rum.org.au/papers/2010 (date accessed 17/3/22). 17. TRB (2008) Potential impacts of climate change on U.S. transportation. Transport Research Board: Washington DC. Available from: https://www.nap.edu/catalog/12179/potenti al-impacts-of-climate-change-on-ustransportation-special-report (date accessed 17/3/22). 18. Regmi, M. B. and S. l. Hanaoka (2011). “A survey of impacts of climate change on road transport infrastructure and adaptation in Asia.†Environ. Econ. Policy Stud 13:21-41. DOI https://doi.org/10.1007/s10018-010- 0002-y 19. Böcker, L., Dijst, M. and J. Prillwitz (2013). “Impacts of everyday weather on individual daily travel behaviours in perspective: a literature review†Transport Reviews 33(1): 71-91. DOI: https://doi.org/10.1080/01441647.2012.7471 14 20. Miao, Q., Welch, E. W. and P. S. Sriraj (2019). “Extreme weather, public transport ridership and moderating effect of bus stop shelters.†Journal of Transport Geography 74:125-133.9. DOI: https://doi.org/10.1016/j.jtrangeo.2018.11.00 7 21. Urquhart, P. (2009). Comprehensive report: Final version, International Fund for Agricultural Development (IFAD), Rome. Available from: https://www.uncclearn.org/wpcontent/uploads/library/ifad71.pdf (date accessed 17/3/22). 22. Halsnæs, K. and S. Traerup (2009). “Development and climate change: A mainstreaming approach for assessing economic, social, and environmental impacts of adaptation measures.†Environmental 46 Management 43:5, 765-778. DOI: http://doi.org/10.1007/s00267-009-9273-0 23. Bipartisan Policy Center (n.d.) Transportation adaptation to global climate change. Bipartisan Policy Center, Washington DC. Available from: https://bipartisanpolicy.org/download/?file=/ wpcontent/uploads/2019/03/TransportationAdaptation-3.pdf (date accessed 17/3/22). 24. C40 (2020). Reducing climate change impacts on walking and cycling. Online: https://www.c40knowledgehub.org/s/article/ Reducing-climate-change-impacts-on-walkingand-cycling?language=en_US (date accessed 17/3/22). 25. Negev, M., Khreis, H., Rogers, B. C., Shaheen, M. and E. Erell (2020). “City design for health and resilience in hot and dry climate.†BMJ 371:m3000. DOI: https://doi.org/10.1136/bmj.m3000 26. WHO (2015). Taking a participatory approach to development and better health: examples from the regions for Health Network. World Health Organization. Regional Office for Europe. Available from: https://apps.who.int/iris/handle/10665/3263 26 (date accessed 17/3/22). 27. Barnett, C. and S. Parnell (2016). “Ideas, implementation and indicators: epistemologies of the post-2015 urban agenda.†Environment and Urbanization. 28(1):87–98. DOI: https://doi.org/10.1177/0956247815621473 28. Aylett, A. (2010). †Participatory Planning, Justice, and Climate Change in Durban, South Africa.†Environ. Plan. Econ. Space 42:99–115. DOI: https://doi.org/10.1068/a4274. 29. Legacy, C. (2017). “Is there a crisis of participatory planning?†Plan. Theory 16:425– 442. DOI: https://doi.org/10.1177/1473095216667433. 30. Siła-Nowicka, K., Vandrol, J., Oshan, T., Long, J. A., Demšar, U. and A. S. Fotheringham (2016). “Analysis of human mobility patterns from GPS trajectories and contextual information.†Int. J. Geogr. Inf. Sci. 30: 881– 906. DOI: https://doi.org/10.1080/13658816.2015.1100 731. 31. Kamruzzaman, M. D. and J. Hine (2011). “Participation index: a measure to identify rural transport disadvantage?†J. Transp. Geogr. 19:882–899. DOI: https://doi.org/10.1016/j.jtrangeo.2010.11.00 4. 32. Bailey, K. and T. Grossardt (2010). “Toward Structured Public Involvement: Justice, Geography and Collaborative Geospatial/Geovisual Decision Support Systems.†Ann. Assoc. Am. Geogr. 100:57–86. DOI: https://doi.org/10.1080/00045600903364259 . 33. Kahila-Tani, M., Kytta, M. and S. Geertman (2019). “Does mapping improve public participation? Exploring the pros and cons of using public participation GIS in urban planning practices.†Landsc. Urban Plan. 186:45–55. DOI: https://doi.org/10.1016/j.landurbplan.2019.0 2.019 34. Stockholm Environment Institute (2020) Equitable Mobility for City Health and Wellbeing https://www.sei.org/projects-andtools/projects/equitable-mobility-for-cityhealth-and-wellbeing/ (date accessed 17/3/22). 35. Kurtz, C. F. (2014). Working with Stories in Your Community or Organization: Participatory Narrative Inquiry. KurtzFernhout Publishing. 36. Wignall, R., McQuaid, K. V., Gough, K., and J. Esson (2019). "We built this city’: Mobilities, urban livelihoods and social infrastructure in the lives of elderly Ghanaians." Geoforum 103:75-84. DOI: https://doi.org/10.1016/j.geoforum.2019.03. 022 37. High Volume Transport Applied Research Programme (2022). Storytelling for real: how voices of vulnerable road users can be heard http://transport-links.com.w01c1b50.kasserver.com.w01c1b50.kasserver.com/storytelling-forreal-how-voices-of-vulnerable-road-userscan-be-heard/ (date accessed 17/3/22). 38. Doherty, J. (2021). “Mobilizing social reproduction: gendered mobility and everyday infrastructure in Abidjan.†Mobilities 16:5, 758-774, DOI: https://doi.org/10.1080/17450101.2021.1944 288 47 39. Chakraborty, A. (2011). “Enhancing the role of participatory scenario planning processes: Lessons from Reality Check exercises.†Futures, Special Issue: Community Engagement for Sustainable Urban Futures 43:387–399. DOI: https://doi.org/10.1016/j.futures.2011.01.00 4 40. Cinderby, S., de Bruin, A., Cambridge, H., Muhoza, C., and A. Ngabirano (2021). “Transforming urban planning processes and outcomes through creative methods.†Ambio 50(5):1018-1034. DOI: https://doi.org/10.1007/s13280-020-01436-3 41. Fredericks, J., Hespanhol, L., Parker, C., Zhou, D. and M. Tomitsch (2018). “Blending pop-up urbanism and participatory technologies: Challenges and opportunities for inclusive city making.†City Cult. Soc., Innovation and identity in next generation smart cities 12:44– 53. DOI: https://doi.org/10.1016/j.ccs.2017.06.005. 42. Taylor, A. and M. L. Philp (2015). “Investigating the impact of maintenance regimes on the design life of road pavements in a changing climate and the implications for transport policy.†Transport Policy 41:117- 135. DOI: https://doi.org/10.1016/j.tranpol.2015.01.00 5 43. Stockholm Environment Institute (2021). Inclusive Climate-Resilient Transport in Africa. https://www.sei.org/projects-andtools/projects/inclusive-climate-resilienttransport-in-africa/ 44. Zimmermann, M., Darkow, I. L. and H. A. von dar Gracht (2012). “Integrating Delphi and participatory backcasting in pursuit of trustworthiness — The case of electric mobility in Germany.†Technological Forecasting and Social Change 79(9): 1605- 1621. DOI: https://doi.org/10.1016/j.techfore.2012.05.0 16 45 United Nations (2006). Convention on the Rights of Persons with Disabilities (CRPD). United Nations, New York. Available from: https://www.un.org/disabilities/documents/c onvention/convoptprot-e.pdf (accessed 18/3/22) Images Cover Page: Sven Hansen / Flickr. CC-BY-SA 2.0 Colour overlay applied. Page 3: D Mwamba / ZRST. With kind permission. Page 4: Slum Dwellers International / Flickr CC BYNC-ND 2.0 Page 5: Hassan Omar Wamwayi / Unsplash. Page 8: Arsenie Coseac / Flickr. CC BY-ND 2.0. Page 10: Dylan Patterson / Flickr . . CC-BY-SA 2.0. Colour filter applied. Page 13: Sserunjogi Emmanuel / Wikimedia CC BYSA 4.0. Colour filter applied. Page 14: Elisha Muwanguzi / Wikimedia. CC BY-SA 4.0. Colour filter applied. Page 16: Social Income / Unsplash. Page 19: D Mwamba / ZRST. With kind permission. Page 21: S Omangi / SEI. With kind permission. Page 22: D Mwamba / ZRST. With kind permission. Page 23: H Cambridge / SEI. With kind permission. Page 24: H Cambridge / SEI. With kind permission. Page 26:Hennie Stander / Unsplash. Page 27: Sylvester Mambwe / Unsplash. Page 30: H Cambridge / SEI. With kind permission. Page 31: M Ojal. With kind permission. Page 29: H Cambridge / SEI. With kind permission. Page 32: A Mwesgwa / With kind permission. Page 35: D Mwamba / ZRST. With kind permission. Page 37: D Mwamba / ZRST. With kind permission. Page 38: Lens Envy / Flickr. CC BY-ND 2.0 Colour filter applied. Page 39:Sven Hansen / Flickr. CC-BY-SA 2.0 Colour filter applied. Page 40: Cordelia Persen / Flickr CC BY-ND 2.0 Colour filter applied. Page 41: D Mwamba / ZRST. With kind permission. Page 43: S Omangi / SEI . With kind permission. 48 STATEMENT This document is an output of the Applied Research Programme in High Volume Transport funded by the Foreign, Commonwealth & Development Office (FCDO). The views expressed are not necessarily those of the FCDO, UNEP or SEI at the University of York. ACKNOWLEDGEMENTS These guidelines for practitioners were produced by: SEI, the University of York, Zambia Road Safety Trust, Makerere University, and UNEP. March 2022. Sincere thanks are expressed to all those who commented on drafts from the project advisory group, and external reviewers. This document should be cited as: Haq, G., Cinderby, S., Opiyo, R, Ngabirano, A., Wasike, Y.A., Mwamba, D., Cambridge, H., and Muhoza, C. 2022. Using Creative Participatory Approaches for Inclusive Climate Resilient Transport in Africa. Guidelines for Practitioners. First published 2022 © 2022 University of York Front cover picture: S Hansen, Flickr Email: hvtinfo@imcworldwide.com Web: www.hvt.preview.consideredcreative.com