Overview
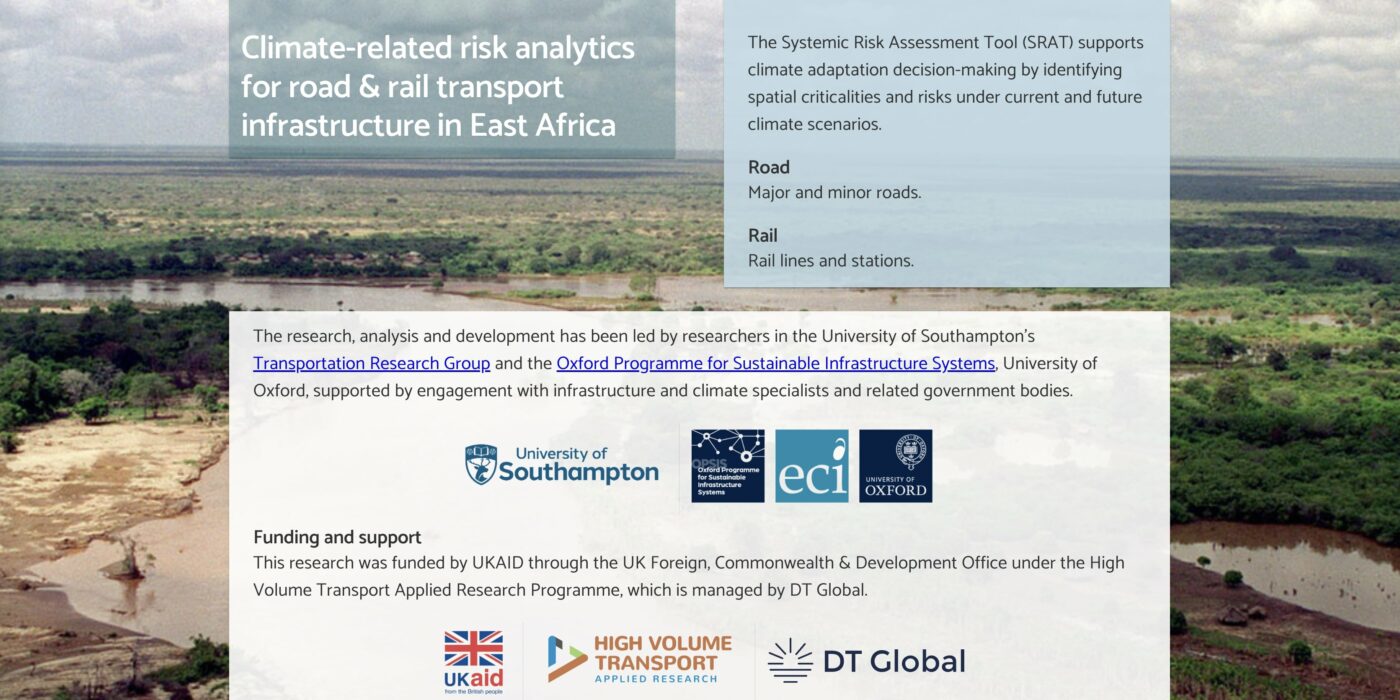
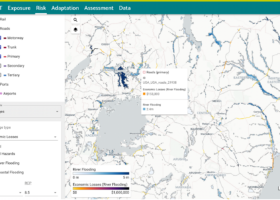
This is the final summary report of project HVT043, “Decision Support Systems for Resilient Strategic Transport Networks in Low Income Countries”. It provides an overview of the research findings underpinning the decision support tool which has been developed during the project. The decision support system is built around an interactive web platform and aims to support investment decisions and options selection for long distance strategic land transport networks exposed to climate risks. It is the first multi-state transport infrastructure decision support system in a low-income country context, based on a case study region covering Uganda, Zambia, Kenya and Tanzania, and is freely available online at https://east-africa.infrastructureresilience.org/. The underlying research has focused on developing a range of future background scenarios for transport development in the case study region, identifying and assembling datasets which form the basis for an assessment of transport resilience and sustainability.
Data requirements, methodologies, related frameworks and example results for the underlying research are presented throughout the report, which also summarises the development of the decision support tool and provides a case study example based on a road enhancement project in Kenya. The case study was one of five identified in discussions during stakeholder workshops. Details of the three sets of online workshops are provided, as well as an overview of the four in-country demonstration workshops carried out in September 2022. The main technical report is available separately.
Publications with the same themes


Publications with the same study countries

Related news & events
News
Blog

Blog
News

Blog

Blog
PDF content (text-only)
Final Summary Report Decision support systems for resilient strategic transport networks in low-income countries January 2023 Project HVT/043 Decision Support Systems for Resilient Strategic Transport Networks in Low Income Countries This research was funded by UKAID through the UK Foreign, Commonwealth & Development Office under the High Volume Transport Applied Research Programme, managed by DT Global (formerly IMC Worldwide). The views expressed in this report do not necessarily reflect the UK government’s official policies. Reference No. HVT/043 Lead Organisation/ Consultant University of Southampton Partner Organisation(s)/ Consultant(s) University of Oxford Title Decision support systems for resilient strategic transport networks in low-income countries – Final Summary Report Type of document Report Theme Long distance transport Sub-theme Resilience and sustainability Author(s) Adrian Hickford, Simon Blainey, Raghav Pant, Diana Jaramillo, Tom Russell, John Preston, Jim Hall, Marcus Young, Gordon Glasgow Lead contact Simon Blainey Geographical Location(s) Southampton/Oxford, UK (Researchers) Kenya, Tanzania, Uganda, Zambia (Case study countries) Abstract This is the final summary report of project HVT043, “Decision Support Systems for Resilient Strategic Transport Networks in Low Income Countries”. It provides an overview of the research findings underpinning the decision support tool which has been developed during the project. The decision support system is built around an interactive web platform and aims to support investment decisions and options selection for long distance strategic land transport networks exposed to climate risks. It is the first multi-state transport infrastructure decision support system in a low-income country context, based on a case study region covering Uganda, Zambia, Kenya and Tanzania, and is freely available online at https://east-africa.infrastructureresilience.org/. The underlying research has focused on developing a range of future background scenarios for transport development in the case study region, identifying and assembling datasets which form the basis for an assessment of transport resilience and sustainability. Data requirements, methodologies, related frameworks and example results for the underlying research are presented throughout the report, which also summarises the development of the decision support tool and provides a case study example based on a road enhancement project in Kenya. The case study was one of five identified in discussions during stakeholder workshops. Details of the three sets of online workshops are provided, as well as an overview of the four in-country demonstration workshops carried out in September 2022. The main technical report is available separately. Keywords Long-distance transport; Risk and resilience; Sustainability; Sustainability indicators; Decision support systems Funding FCDO High Volume Transport Applied Research Programme FINAL SUMMARY REPORT: DECISION SUPPORT SYSTEMS FOR RESILIENT STRATEGIC TRANSPORT NETWORKS IN LOW INCOME COUNTRIES CONTENTS Introduction 2 Research Question 1: Future scenarios 4 Research Question 2: Data review and assembly 6 Research Question 3: Climate resilience 10 Research Question 4: Sustainability assessment 17 Stakeholder engagement 23 Tool development 26 Case study example 27 Dissemination and next steps 31 FIGURES Figure 1: Case study region ....................................................................................................................................2 Figure 2: SRAT home page......................................................................................................................................2 Figure 3: Work programme structure ....................................................................................................................3 Figure 4: Population projections (UN DESA) ..........................................................................................................4 Figure 5: Schematic view of generation of future transport interventions and scenarios....................................5 Figure 6: Graphical representation of a multi-modal transport system-of-systems..............................................6 Figure 7: Map representation of the OSM road network created for this study showing roads classified as (a) trunk, primary, secondary, and tertiary; and (b) paved or unpaved......................................................................7 Figure 8: Map representation of the data created for the study showing the status of existing and proposed spatial railway routes across Kenya, Tanzania, Uganda and Zambia .....................................................................7 Figure 9: Map representation of all the ports considered in the study .................................................................8 Figure 10: Generalised direct damage (fragility) curves vs flood depths for different types of infrastructure assets (a) paved roads; (b) unpaved road; (c) railway lines ...................................................................................9 Figure 11: Graphical representation of transport system-of-systems risk and adaptation assessment framework ........................................................................................................................................................... 10 Figure 12: Graphical representation of the cost-benefit analysis for evaluating the effectiveness of adaptation options................................................................................................................................................................. 12 Figure 13: Length of flooded (a) roads and (b) railways from river flooding in 2030, 2050, and 2080 under baseline, RCP 4.5, and RCP 8.5 scenarios............................................................................................................ 13 Figure 14: Direct damages to (a) roads and (b) railways from river flooding in 2030, 2050, and 2080 under baseline, RCP 4.5, and RCP 8.5 scenarios............................................................................................................ 14 Figure 15: Mean expected annual damages to railways and roads in million US$ from fluvial and coastal flooding under baseline conditions and for future outlooks under RCP 4.5 and 8.5.......................................... 16 Figure 16: Simplified methodology for the option assessment tool ................................................................... 22 Figure 17: Case study – Kenya’s Lesseru-Kitale and Morpus-Lokichar road improvements, flood risk assessment .......................................................................................................................................................... 27 Figure 18: Kenyan case study – Estimated annual damages chart...................................................................... 28 FINAL SUMMARY REPORT: DECISION SUPPORT SYSTEMS FOR RESILIENT STRATEGIC TRANSPORT NETWORKS IN LOW INCOME COUNTRIES TABLES Table 1: Components of transport interventions................................................................................................ 17 Table 2: Framework of component themes of sustainable transport ................................................................ 18 Table 3: Indicators selected for inclusion in the study........................................................................................ 18 Table 4: In-country workshops summary ............................................................................................................ 23 Table 5: Kenyan case study – Estimated direct damages.................................................................................... 28 Table 6: Kenyan case study – Expected indirect losses per day (most affected road segments) ....................... 29 Table 7: Kenyan case study – Default and revised values for impacts and weightings of related sustainability indicators............................................................................................................................................................. 29 FINAL SUMMARY REPORT: DECISION SUPPORT SYSTEMS FOR RESILIENT STRATEGIC TRANSPORT NETWORKS IN LOW INCOME COUNTRIES 1 Overview This report highlights the first multi-state transport infrastructure decision support system in a lowincome country context, based on a case study region covering Uganda, Zambia, Kenya and Tanzania, freely available online at https://east-africa.infrastructureresilience.org/. The decision support system is built around an interactive web platform and aims to support investment decisions and option selection for long distance strategic land transport networks exposed to climate risks. The underlying research has focused on developing a range of future background scenarios for transport development in the case study region, identifying and assembling datasets which form the basis for an assessment of transport resilience and sustainability. From the outset, the project has focused on four specific research areas: • Future scenarios and transport interventions A framework has been created to help classify relevant transport intervention types which affect the use and nature of long-distance transport networks, and guide the development of exogenous scenarios of change in demand related to population growth, economic factors and climate change. • Data review and assembly Beyond the data associated with scenarios and transport interventions, the risk and resilience aspect of the decision support tool requires data on transport network topology and use, in order to map out where climate hazards are greatest, where they overlap with transport assets, and the impact and costs of any disruptions caused by flooding. • Climate resilience of road and rail networks A system-of-systems assessment of climate risk and adaptation options has been developed, focusing on four main themes: Criticality (the importance of a transport link based on its disruptive impact on the wider network); Vulnerability (understanding the negative consequences caused by failures of transport links from external shock events); Risk (the likelihood of hazards occurring, and the subsequent consequences of transport link failures); and Adaptation planning (identifying which assets and locations should be prioritised for targeted investments to provide maximum benefits in reducing risks). Results suggest that considerable lengths of roads and railways are currently exposed to river flooding, and there is a significant increase in the exposure lengths when comparing the future climate scenario driven flood outcomes with the current situation. • Sustainability assessment The option assessment tool is based on a range of sustainability indicators, grouped around the three main ‘pillars’ of sustainability: environmental, economic and social sustainability, and can compare the impacts of future scenario change and transport interventions aimed at improving long-distance transport, either by technological advances, government policy or transport planning. Stakeholder engagement has been key to this research, and ongoing partnerships with relevant organisations in each of the four case study countries have been crucial in identifying a range of multisectoral stakeholders who could provide feedback on the research. Firstly, three rounds of online workshops each focused on a different aspect of the research. Secondly, a set of in-person workshops in each of the case study countries covered each aspect of the project, and demonstrated an early version of the web-based decision support tool. Finally, five potential case studies were identified during the incountry workshops, and feedback from the workshop discussions have helped in the further development of the online tool and the case studies. FINAL SUMMARY REPORT: DECISION SUPPORT SYSTEMS FOR RESILIENT STRATEGIC TRANSPORT NETWORKS IN LOW INCOME COUNTRIES 2 Introduction This summary report provides an overview of the research undertaken during High Volume Transport Project 043, ‘Decision Support Systems for Resilient Strategic Transport Networks in Low Income Countries’. The full technical report is available separately. HVT project 043 is one of 10 research projects funded in 2020 following an open call for co-created research as part of the HVT programme. The overall aim of this particular project has been to support investment decisions and option selection for long distance strategic land transport networks exposed to climate risks by creating the first multi-state transport infrastructure decision support system in a LIC context, based on a case study region covering Kenya, Tanzania, Uganda and Zambia (Figure 1). Figure 1: Case study region The decision support system is built around an interactive web platform (Figure 2) which is freely and openly available online at https://east-africa.infrastructureresilience.org/. The tool has been created based on research undertaken at the Universities of Southampton and Oxford, in collaboration with stakeholder partners in each of the case study countries. Figure 2: SRAT home page FINAL SUMMARY REPORT: DECISION SUPPORT SYSTEMS FOR RESILIENT STRATEGIC TRANSPORT NETWORKS IN LOW INCOME COUNTRIES 3 The decision support system provides a fast and consistent methodology for comparing the advantages and disadvantages of different climate adaptation options with respect to a range of development and sustainability indicators. As well as covering infrastructure investments, the system is sufficiently flexible to also allow assessment of changes to the management and operation of long-distance road and rail systems during the strategic and tactical planning process. From the outset, the project has aimed to answer four Research Questions. These questions are set out below, together with a summary of how this research has sought to answer each. They have been investigated through a series of six linked Work Packages (WP), as shown in Figure 3. Figure 3: Work programme structure The research findings from WP1 to WP4 map on to the research questions RQ1 to RQ4 respectively. The main body of the technical report (available separately) sets out the research which has been undertaken in each of these four WPs, culminating in the development of the decision support tool as part of WP5. This summary report provides an overview of the research undertaken, the development of the decision support tool and provides results for a case study example based on a road enhancement projects in Kenya. The research questions have been considered within the context of long-distance transport, which is defined as being the movement of goods and people between some generator or attractor hub, such as a major port or airport, and major destinations along a series of corridors emanating from that hub. For the purposes of this study, the components of long-distance transport are the physical transport networks (mainly roads and railways, along with inland waterways) that facilitate movement, and the vehicles which use these networks to move goods and people (predominantly freight traffic and passenger rail). FINAL SUMMARY REPORT: DECISION SUPPORT SYSTEMS FOR RESILIENT STRATEGIC TRANSPORT NETWORKS IN LOW INCOME COUNTRIES 4 Research Question 1: Future scenarios RQ1: What is the expected range of future scenarios for transport development in the case study region, with respect to factors such as population, economic growth, climate and technology? One of the main aims of this research project was to undertake analysis of the potential effectiveness and consequences of transport system interventions in LICs, and for this to be achieved it is necessary to have information on the exogenous conditions in which the interventions might be situated, along with an understanding of the different types of potential transport interventions. WP1 of this project focused on the production of a framework to classify intervention types and guide the development of exogenous scenarios. Before building this framework, an assessment of change and trends between 2000 and 2018 was undertaken, which not only provided an understanding of the likely future trajectories of change for relevant factors based on historical trends, but also provided insight into the availability, reliability and accuracy of data related to long-distance transport networks. The trend assessment highlighted the three different types of factors which would need to be included as inputs to the decision support tool: • Exogenous factors – drivers of demand such as population growth, economic factors such as GDP and energy costs, and climate change. • Transport-related change – intervention factors which are largely outside the control of transport policy makers in LICs, such as changes in vehicle, fuel and other technologies, and behaviour change affecting how long-distance transport networks are used. • Future transport policy and strategic interventions – endogenous factors derived from existing plans to improve the long-distance transport network, or strategies for changing how the networks are currently used. In order to generate future options for each of these components, it is possible to use established datasets and projections where they exist, such as for future population change (UN DESA, Figure 4), and global climate change (IPCC and Future Climate for Africa). Figure 4: Population projections (UN DESA) Historical trends can also be used to provide an estimate of future change where good quantitative data exists, such as for GDP, and simple modifications to these future estimates can provide higher or lower rates of change, reflecting the uncertain nature of future scenario development. However, for many of the transport-related components of future change, such reliable datasets do not exist. In that case, it is possible to consider more qualitatively how those components are likely to affect either the transport networks, the origin-destination matrix of people and goods, or the costs associated with long-distance transport. A combination of these approaches has been used in this project to provide an understanding of the likely impacts of future change, and the framework developed in WP1 (Figure 5) provides a method of generating a FINAL SUMMARY REPORT: DECISION SUPPORT SYSTEMS FOR RESILIENT STRATEGIC TRANSPORT NETWORKS IN LOW INCOME COUNTRIES 5 range of exogenous scenarios and a classification of different intervention types most likely to impact the use and nature of long-distance transport networks in the future. Figure 5: Schematic view of generation of future transport interventions and scenarios Exogenous drivers of demand Vehicle and network use (road and rail) Fleet Tech Behaviour Policy and planning Network Logistics Pricing Population Economy Costs Scenario 1 Scenario 2 Intervention 1 Intervention 2 Intervention 3 Intervention 4 Interventions Scenarios FINAL SUMMARY REPORT: DECISION SUPPORT SYSTEMS FOR RESILIENT STRATEGIC TRANSPORT NETWORKS IN LOW INCOME COUNTRIES 6 Research Question 2: Data review and assembly RQ2: What data are required in order to develop an effective decision support system for long distance transport in LICs? While the data gathering exercise undertaken as part of WP1 provided an understanding of the impact of exogenous drivers of change and possible transport interventions, the risk and resilience aspect of the decision support tool also required more detailed data on transport network topology, flows and movements of goods and people. This was the focus of WP2, which initially set out the data requirements for the risk analysis work to be undertaken, and subsequently reviewed and assembled relevant open-source datasets. This project uses river (fluvial) and coastal flood maps (openly available from the Aqueduct flood product datasets) to estimate climate risks to transport assets, by generating flood return period extents and flood depths for flooding across the case study countries. The resultant future flood maps can then be used in the decision support tool to identify locations or transport assets that would be at risk of damage caused by different flood scenarios, with outputs given for the years 2030, 2050, and 2080, for a range of different flooding extents under climate change scenarios represented by different Representative Concentration Pathways (RCP 4.5 and RCP 8.5). In order for this flood analysis and subsequent damage costs estimation to be undertaken, the decision support tool requires a detailed model of the different infrastructure networks and associated assets, along with an estimate of the network flows. There are a range of data collection requirements for creating infrastructure network models with flows. Physical topological network information describes the network structure, and the existence of physical links with information about their connecting node locations is a necessary and essential condition for the creation of transport network models, because of the geospatial nature of the transport systems (stylised in Figure 6). Network condition attributes such as link length, link width and link condition help to provide details of the physical network properties, used to infer their intersections with hazards and failure criteria. Network cost assignment attributes provide the basis of selecting the least generalised cost route (an estimate of the monetary value in US Dollars of transporting freight) between a selected origin-destination pair and modal option, in order to assign origin-destination flows on the networks. Figure 6: Graphical representation of a multi-modal transport system-of-systems Data for the road networks (classified as motorways and trunk roads, primary roads, secondary roads, and tertiary roads in this project) and rail networks (classified as functional (the railway routes which were in operation) and non-functional (the railway routes which were no longer in use, or were being rehabilitated following periods of disuse)) were extracted from OpenStreetMap, which provides very accurate location, geometry and connectivity information for long-distance transport (Figure 7). The rail network data was enhanced to incorporate missing information, for example with regard to the location of some stations (Figure 8). Nodes Links Road sections Railway lines Waterway routes FINAL SUMMARY REPORT: DECISION SUPPORT SYSTEMS FOR RESILIENT STRATEGIC TRANSPORT NETWORKS IN LOW INCOME COUNTRIES 7 Figure 7: Map representation of the OSM road network created for this study showing roads classified as (a) trunk, primary, secondary, and tertiary; and (b) paved or unpaved (a) (b) Figure 8: Map representation of the data created for the study showing the status of existing and proposed spatial railway routes across Kenya, Tanzania, Uganda and Zambia FINAL SUMMARY REPORT: DECISION SUPPORT SYSTEMS FOR RESILIENT STRATEGIC TRANSPORT NETWORKS IN LOW INCOME COUNTRIES 8 Ports are significant hubs linking to the road and railway networks (Figure 9). The waterway ports are either maritime ports located along the eastern coastline of the region, connecting it to the routes on the Indian Ocean, or inland ports which tend to be concentrated along two main lake waterbodies (Lake Victoria, where the ports connect Tanzania to other ports in Uganda and Kenya, and Lake Tanganyika, where the ports connect Tanzania to other ports in Burundi, The Democratic Republic of Congo and Zambia). Data on these ports is not readily available in global open access datasets, but can be extracted from national port authority documents and annual reports. The project also considers the main airports in the case study countries, which handle significant volumes of freight or passengers that would have a substantial effect on the long-distance land transport networks. The largest airport in the case study region is in Nairobi (Jomo Kenyatta International Airport, Kenya), with other large airport hubs located in Kampala (Entebbe International Airport, Uganda), Dar Es Salaam (Julius Nyerere International Airport, Tanzania), Lusaka (Kenneth Kaunda International Airport, Zambia), Eldoret (Eldoret international Airport, Kenya) and Mombasa (Moi International Airport, Kenya). Data on annual passenger movements and imported and exported freight tonnage can be extracted from country specific reports. Figure 9: Map representation of all the ports considered in the study A significant challenge that has been faced in this project is the lack of any information on network flows in terms of passenger or freight movements along road and rail links, with no openly available road or rail passenger or freight traffic flow model or data available for Africa generally or the case study countries specifically. There are, however, global datasets from which estimates can be created of trade import-export flows between countries, using high-level statistics at specific border crossings (ports, airports) to assign flows to specific locations in countries. Modal-splits are estimated to assign flows to road and rail networks and then assigning flows along networks based on the conglomeration of population and economic activities within countries. Beyond the topological and flow data essential to traffic network flow models, and the intersection of those networks with flood maps, further data is required on the impacts of flooding on the various transport assets, in order to assess the likelihood of damage, and the subsequent direct and indirect costs of network disruptions. Flood fragility curves (Figure 10) are used to estimate the amount of damage an asset would sustain due to hazard exposures, while a range of estimated rehabilitation or reconstruction costs for railway FINAL SUMMARY REPORT: DECISION SUPPORT SYSTEMS FOR RESILIENT STRATEGIC TRANSPORT NETWORKS IN LOW INCOME COUNTRIES 9 lines and for different types of paved or unpaved roads are derived from multiple sources, providing an understanding of the typical costs of major construction projects, and the variability of such costs. These data can be combined to generate estimated direct and indirect costs caused by flooding, but for costbenefit analyses to be undertaken, further information is required on the costs and likely impacts on flood defence of the array of strategies and measures that are available and appropriate. These strategies and measures are referred to here as ‘adaptation options’ for sections of roads and railway tracks. Figure 10: Generalised direct damage (fragility) curves vs flood depths for different types of infrastructure assets (a) paved roads; (b) unpaved road; (c) railway lines (a) (b) (c) The six different adaptation options considered are: swales (broad shallow channels topped with vegetation, designed to attenuate and infiltrate runoff volume from adjacent impervious surfaces), spillways (designed to discharge flows that cannot either be used immediately or stored in a reservoir for future use), mobile flood embankments (mobile and reusable inflatable tube segments that are used to insulate/dam flood water, offering immediate use and protection, and subsequent storage), flood walls (a freestanding, permanent, engineered structure designed to prevent encroachment of floodwater), drainage rehabilitation (the systematic removal of accumulated material from watercourses, canals, or drainage systems, increasing the efficient conveyance of water), and upgrading unpaved roads to paved. The actual costs and the applicability of each option will depend heavily on the specific local conditions and topography. For example, the implementation of swales may be constrained by space and slope considerations as well as by suitability of native vegetation. 0 0. 0.4 0. 0. . 0 0. 0. 0.3 0.4 0. 0. 0. 0. 0. . .4 . . . .4 . . 3 3. 3.4 3. 3. 4 Damage frac on Flood depth m Rail Direct damage fragility curves State State State 3 State 4 State FINAL SUMMARY REPORT: DECISION SUPPORT SYSTEMS FOR RESILIENT STRATEGIC TRANSPORT NETWORKS IN LOW INCOME COUNTRIES 10 Research Question 3: Climate resilience RQ3: How resilient is long distance transport infrastructure in the case study region to climaterelated and other hazards? Using the data set out above, the research approach adopted in this study is one that (i) maps out where climate hazards are greatest; (ii) identifies the elements and locations in the transport network that are exposed to climate hazards; (iii) assesses the significance of climate risk by mapping the flows of people and goods on the network and the potential for socio-economic disruption; (iv) assesses the costs and benefits (in terms of risk reduction) of adaptation options under different future scenarios; and (v) prioritises adaptation options, so that limited budgets can be used to climate-proof the network as efficiently as possible. A methodological framework for climate risk and adaptation assessment has been developed (Figure 11) and implemented for multi-modal infrastructure systems comprised of the road and rail networks, and the airports and waterway ports that connect with these networks. Figure 11: Graphical representation of transport system-of-systems risk and adaptation assessment framework The road and rail networks are large-scale spatially distributed systems with complex interactions, each defined as a collection of nodes joined together by a collection of links. Nodes are point representations of key locations of physical facilities and human systems in the transport systems – ports, airports, railway stations, and road junctions. Links are line representations of physical connections between nodes – road sections, railway lines, and waterway routes. The framework presents different types of system-of-systems assessments useful for decision-making: 1. Criticality assessment – measuring the importance of a transport link based on its disruptive impact on the rest of the transport infrastructure. 2. Vulnerability assessment – measuring the negative consequences caused by failures of transport links from external shock events, carried out in the context of natural hazards and resulting in understanding of the relative impacts of hazards on the continued transport availability. 3. Risk assessment – providing an understanding of the likelihood of hazards occurring, and the subsequent consequences of transport link failures. FINAL SUMMARY REPORT: DECISION SUPPORT SYSTEMS FOR RESILIENT STRATEGIC TRANSPORT NETWORKS IN LOW INCOME COUNTRIES 11 4. Adaptation planning – identifying which assets and locations should be prioritised for targeted investments to provide maximum benefits in reducing risks. Within the framework the steps of network risk estimation are divided into two parts: 1. Direct damage calculations – losses that are incurred due to the physical damages to the network nodes and links, when they are exposed to extreme hazards (i.e. flooding in this case). 2. Indirect economic loss calculations – losses that are incurred due to disruptions to network flows following direct damage to network nodes and links. In this study, such losses are estimated in terms of changes to the freight flows on these networks, but similar methods could be extended to estimating changes to passenger flows. In particular, freight flow disruptions either lead to increased costs of rerouting and redistributing freight along networks, or loss of value of freight when there are no flow rerouting options, especially if the damaged nodes or links only connected to a single location on the network. The system-of-systems methodological approach consists of the following components: • Hazard assembly – external shock events which initiate failure in the transport systems, quantified through static hazard maps that capture the spatial extent, magnitude, return period or the annual exceedance probability, climate scenario and time epoch. • Multi-modal transport networks assembly – achieved by collecting geospatial data for use in Geographical Information Systems (GIS) and creating connected network models, identifying and assigning attributes to locations on the networks, identifying key nodes of freight transport origins and destinations, integrating freight data with the network locations, and assigning origin-destination flows onto the networks based on a least generalised cost criteria to create flow estimates. • Exposure analysis – achieved by creating spatial intersections of hazards and network assets, overlaying each hazard map layer with each asset geometry and estimating the magnitude of the hazard at a particular location, and the extent of the asset geometries that are within the hazard areas. The process results in compiling hazard levels and spatial extents affecting each infrastructure asset across all return periods, climate scenarios, and time epoch of every hazard type. This leads towards the estimation of direct and indirect risks associated with assets and network failures. • Direct damage estimation – quantifying the rehabilitation costs (in US$) of assets subjected to different hazard shocks across current and future climate scenarios. This is achieved by selecting a level of hazard that might cause physical damage to assets such that there will be a need for rehabilitation, then using fragility or vulnerability functions which quantify the percentage (or fraction) of replacement cost sustained by an asset for a given magnitude of a hazard. In the analysis, the uncertainties of vulnerability functions and asset unit costs are combined to quantify a range of direct damage costs to assets exposed to hazards. • Indirect economic loss estimation – measuring the disruptions to infrastructure networks’ overall performance and services, in particular the indirect economic losses from import-export trade flow disruptions (in US$/day). This is achieved by identifying all existing origin-destination trade routes which are disrupted, rerouting flows towards alternative routes, and estimating flow disruptions in terms of freight tonnage lost when there are no rerouting options. • Direct and indirect risk metrics – estimated as a function of the hazard annual exceedance probabilities and the total impacts (direct damages plus indirect losses). Due to the uncertainties associated with hazards events and climate scenarios, asset fragilities, and disruption impacts, two risk metrics are estimated: a) Expected Annual Damage (EAD) – the average damage costs (US$) incurred for an asset in any given year due to a given hazard type for a given time epoch and climate scenario. b) Expected Annual Economic Losses (EAEL) – the average economic losses (in US$) incurred following the damages to an asset in any given year due to a given hazard type for a given time epoch and climate scenario. The asset level total risk can be calculated as total risk = EAD + EAEL. There are different ways in which the risk estimates can be presented, either through damage(loss)-probability curves or as a network map highlighting the most critical assets across the country in terms of value of EAD and EAEL estimates. FINAL SUMMARY REPORT: DECISION SUPPORT SYSTEMS FOR RESILIENT STRATEGIC TRANSPORT NETWORKS IN LOW INCOME COUNTRIES 12 This approach can be used to understand future transport failures and losses, by (a) assembling statistics on future origin-destination flow growth scenarios (based on different indicators such as projected trade growth, projected increase in tonnage growth at specific locations such as ports, airports); (b) incorporating structural changes to the networks (if possible) in terms of changing conditions of links; (c) estimating the changes in performance measures that determine new estimates for generalised cost functions in the future, and (d) creating modal options for new flow assignments. Once the estimation of asset level risks across multiple hazards, climate scenarios and time epochs is completed, an adaptation assessment with respect to a set of adaptation options can be undertaken, quantifying the effectiveness of different adaption options with estimated costs for building resilience (to climate shocks) of individual assets and networks. This is achieved through a cost-benefit analysis of a chosen option (Figure 12), where the costs of an adaptation option are compared with the benefits due to reduced or avoided risks. The estimation of costs, risk reduction benefits and co-benefits of adaptation options leads towards prioritisation of investment interventions, which is achieved by evaluating different options and ranking them by their benefit-cost ratios. Figure 12: Graphical representation of the cost-benefit analysis for evaluating the effectiveness of adaptation options The technical report presents a series of results showing the degree to which transport assets in the four case study countries are exposed to extreme river and coastal flooding. This is followed by the quantification of direct damages for different flood return periods. The risks are then quantified in terms of the EAD values at the asset level and the aggregated sum for the whole region, which is an indicative of the magnitude of largescale disaster impacts. Following these analysis results, the indirect risk estimates are shown as the EAEL values at the asset level, which capture the systemic impact of each asset’s disruption on network performance. Having shown the risk analysis results, the findings from the adaptation assessment are presented in terms of the benefits, costs and BCR values of adaptation options associated with assets. Finally, sensitivity analysis results show how the output metrics are sensitive to some of the model assumptions. The results suggest that considerable lengths of roads and railways are currently exposed to river flooding, and there is a significant increase in the exposure lengths when comparing the future climate scenario driven flood outcomes with the baseline (Figure 13). In almost all cases, there is no flooding in a 1/2 return period for the baseline, but some flooding is seen at this return period in the future. In the baseline (current) scenario, an average of 1.0% (1,790km) by length of the current road networks and 1.5% (158km) by length of the current railway networks are exposed to river flooding across all flooding scenarios considered. In a 1/5 flooding scenario, 182km of roads are flooded (an estimated US$ 29 million in direct damages), which increases to 2,243km in a 1/100 scenario (US$ 412 million in direct damages) and in the most extreme case to 3,333km in a 1/1,000 flooding scenario (US$ 688 million estimated direct damages). FINAL SUMMARY REPORT: DECISION SUPPORT SYSTEMS FOR RESILIENT STRATEGIC TRANSPORT NETWORKS IN LOW INCOME COUNTRIES 13 Figure 13: Length of flooded (a) roads and (b) railways from river flooding in 2030, 2050, and 2080 under baseline, RCP 4.5, and RCP 8.5 scenarios (a) (b) FINAL SUMMARY REPORT: DECISION SUPPORT SYSTEMS FOR RESILIENT STRATEGIC TRANSPORT NETWORKS IN LOW INCOME COUNTRIES 14 Figure 14: Direct damages to (a) roads and (b) railways from river flooding in 2030, 2050, and 2080 under baseline, RCP 4.5, and RCP 8.5 scenarios (a) (b) FINAL SUMMARY REPORT: DECISION SUPPORT SYSTEMS FOR RESILIENT STRATEGIC TRANSPORT NETWORKS IN LOW INCOME COUNTRIES 15 Railway networks show less variability to different flooding scenarios. For a 1/5 flooding scenario, 24km of railways are flooded (resulting in estimated direct damages of US$ 3.4 million). This increases to 304km for a 1/1,000 flooding scenario (resulting in direct damages as much as US$ 216 million). There is no predicted coastal flooding of railways. Roads are less exposed to coastal flooding than river flooding with only 7.3km of roads exposed to coastal flooding across all baseline scenarios. These low estimates of coastal flood exposures might also be as a result of low infrastructure coverage over the coastal areas, along with a low prediction of flooding in the hazard datasets. Under future climate outlooks, the flood risk to roads and railways gets more severe across all return periods. On average across all return periods in 2080 under RCP 8.5, 1.6% (2,876km) by length of the road networks and 1.9% (200km) by length of the future railway networks are exposed to fluvial flooding. This means that on average by 2080 an extra 1,086km of roads will be exposed to extreme fluvial flooding, which is quite a significant increase of 60% from baseline flooding estimates. Under RCP 8.5, transport networks will be even more exposed to flooding as compared to RCP 4.5. For example, in a future 1/5 river flooding, 705km of roads are potentially going to be flooded in 2080 under RCP 4.5, which is a significant increase from the 182km of baseline flooding. This increases to 1,066km of flooded roads in 2080 under RCP 8.5, a 485% increase from baseline flooding. If, as is suggested in other research, assets in the region are generally designed for 1/10 to 1/50 flood levels, then any significant increase in flood exposure and severity at lower return periods will result in road and railway assets (designed against existing levels of flood return period) being unable to withstand future extremes. These results imply that direct damage costs to transport networks from flood exposure will be substantially magnified in the future due to climate change (Figure 14). The results of the EAD analysis provide an estimate of the annual cost if direct damages from all hazard probabilities and magnitudes were spread out equally over time (Figure 15), and these results can be mapped to reveal those transport links with especially high EADs. The results presented in the technical report reveal that several segments of the road network in the case study region have significant EAD which increase in the future across both climate scenarios, particularly around the Great Lakes, in the east to northeast in Kenya, and along the southern part of the Zambezi River in Zambia. In the baseline year, EAD can reach as much as US$ 2.4 million. In 2080 under RCP 8.5, this can reach as much as US$ 3.9 million. When these risks occur in locations where the road density is very low, this might result in loss of connectivity for network users if just a few of the high-risk roads were all damaged at the same time. High EAD values seen along linkages close to where the rail damages were also significant could create potential connectivity issues if both networks were flooded at the same time. High EAD values for the cross-border roads can potentially impact trade. One of the highest EAD railway links is in Tanzania along the Central Corridor, which is the main route for transporting commodities from the port of Dar es Salaam towards the Lake Victoria ports providing access to Uganda and Burundi. Some of the highest EAD railway links in the case study area under future years are along proposed routes. Specifically: the new SGR line connecting Mwanza to Isaka, Tabora, and Makutupora in Tanzania; the proposed Mtwara line in Tanzania; and the Chipata-TAZARA line in Zambia. Future flooding risks must be taken into consideration when constructing these proposed lines in order to avoid investment losses from future failures. FINAL SUMMARY REPORT: DECISION SUPPORT SYSTEMS FOR RESILIENT STRATEGIC TRANSPORT NETWORKS IN LOW INCOME COUNTRIES 16 Figure 15: Mean expected annual damages to railways and roads in million US$ from fluvial and coastal flooding under baseline conditions and for future outlooks under RCP 4.5 and 8.5 These results of the adaptation assessment show a significant number of assets on the road network for which options such as drainage rehabilitation are most effective, while installing flood walls and swales are also effective options in many cases. From these results it is estimated that investing in adaptation of the top 20 most benefit-incurring road investments would amount to about US$ 9 million in adaption costs (net present value) against benefits of about US$ 875 million in avoided risk (net present value). For railways, the results suggest that options such as swales, flood walls and mobile flood embankments are the most effective adaptation options. Several of these options should be applied to new railway lines such as the new standard gauge railway line along the Central Corridor in Tanzania where swales could help avoid potential risks. Investing in adaptation measures for rail assets ranked in the top 20 most benefit incurring rail investments would amount to about US$ 92 million adaptation costs (net present value) and provide US$ 234 million in avoided risk (net present value) benefits. The adaptation analysis shows that most of the highest benefits and cost-effective investments are key linkages that facilitate trade flows across the whole networks. For such assets there is a very compelling case for investing in climate adaptation to improve systemic resilience of transport networks. Based on these results, it is possible to prioritise the assets and locations for building climate resilience, while having estimates of the scales of adaptation investment requirements. The risk analysis summarised here is a high-level indicative assessment of transport systems and their exposures, damages, economic losses, risks and adaptation options assessment due to flooding, and can be used to identify a significant sample of assets and locations of potential risks, at the regional scale. These analyses should be used as a first-order screening of potential assets that require further detailed investigation, which should be carried out subsequently. 3 3 0 3 3 4 0 3 0 3 0 0 4 0 0 0 00 0 40 aseline 2 3 2 2 2 3 2 2 RC . RC . xpected nnual Damages million U D River - Railways River - Roads Coa s ta l - Roads FINAL SUMMARY REPORT: DECISION SUPPORT SYSTEMS FOR RESILIENT STRATEGIC TRANSPORT NETWORKS IN LOW INCOME COUNTRIES 17 Research Question : ustainability assessment RQ4: How can the sustainability of long-distance transport systems in the case study region be quantified and assessed? Investments in long-distance land transport networks can help drive regional and national development in low-income countries, but while such developments can contribute to economic growth, they often impact negatively on society and the environment, contrary to the ideals of sustainable development. There is no consistent definition of ‘sustainable transport’, particularly in the context of long-distance transport. There are, however, commonalities among the various definitions in the literature, and the definition of sustainable long-distance transport has been developed for this project as “a transport system that is compatible with net-zero emissions of greenhouse gases, has a net-neutral or net-positive impact on environments at all scales, provides safe and secure accessibility and movement for both people and goods, and is economically viable with respect to both its infrastructure and its operations.” There are close links between definitions of sustainable transport and the UN’s Sustainable Development Goals (SDGs), and the following themes emerge from the SDG indicators that are directly relevant to longdistance transport: • Road Safety: Death rates due to road traffic accidents – particularly for long-distance road transport. • Air Pollution: Death or long-term health problems associated with air pollution – particularly caused by long-distance transport, or along long-distance transport corridors. • Access/Road Density: Proportion of people with nearby access to long-distance transport network – which can potentially be linked to the availability of public transport options. • Freight and Passenger Movements: Passenger and freight volumes using long-distance transport networks. • GHG Emissions: CO2 emissions by industry – for long-distance transport, this could be reduced to CO2 and other tailpipe emissions due to freight and passenger movements. • Promoting Sustainability: Finance and knowledge sharing relating to making long-distance transport systems more sustainable and resilient. • Access to Public Transport: Proportion of population that has convenient access to (long-distance) public transport. There are other issues which are relevant to long-distance transport, but which are not embedded within these SDG indicators, such as transport costs (related to journey times, fuel costs and tariffs), the resilience and quality of infrastructure, and issues related to governance. Providing decision makers with tools to help understand the impact on sustainability of investments affecting long-distance transport is the focus of WP4, providing an understanding of the main interactions between the scenarios, potential transport interventions, and the sustainability indicators. The option assessment tool can compare the impacts of change based on exogenous scenarios (population, economic growth and transport costs), and transport interventions aimed at improving long-distance transport, either by technological advances, government policy or transport planning as shown in Table 1. Table 1: Components of transport interventions Intervention theme Sub-theme Specific intervention Vehicle and network use Changes to the fleet Fleet electrification Technical innovation Vehicle efficiencies (e.g. better engines) System efficiencies (e.g. improved route choice) Behavioural change Demand for goods Demand for travel Policy and planning Network change Infrastructure construction Infrastructure maintenance Logistics Logistics planning Pricing Road user charging FINAL SUMMARY REPORT: DECISION SUPPORT SYSTEMS FOR RESILIENT STRATEGIC TRANSPORT NETWORKS IN LOW INCOME COUNTRIES 18 These are considered to be the major intervention types that will have significant impacts on long-distance transport systems, and the interactions between these interventions and the set of sustainability indicators developed for long-distance transport corridors. The sustainability indicators are grouped around the three main ‘pillars’ of sustainability: environmental, economic and social sustainability, and this project has developed a framework comprising an initial set of 11 major themes of sustainability of long-distance transport shared across these three ‘pillars’ (Table 2). Table 2: Framework of component themes of sustainable transport Environmental Economic Social - Transport emissions - Energy usage - Impacts on biodiversity and land use - Transport demand - Operational efficiency - Infrastructure - Accessibility and mobility - Safety - Health impacts - Social structure The three main pillars were subdivided into separate indicators, and those selected for inclusion in this study are shown in Table 3, with an example metric and sustainability aims for each indicator. Where appropriate, the related SDG is also noted. Where there is a direct and clear link between changes in metrics and sustainability (e.g. lower levels of emissions will increase the environmental sustainability of transport) this is noted. However, there are circumstances where the link is ambiguous or unclear, such that a particular direction of change in combination with other metrics might be better for some aspects of sustainable transport, but worse for others. For example, creating new transport links may be beneficial for economic sustainability, but detrimental to environmental sustainability due to habitat loss. Table 3: Indicators selected for inclusion in the study Sustainability Indicator Example metric Related SDG Sustainable transport aims ENVIRONMENTAL INDICATORS – EMISSIONS RELATED Greenhouse gas emissions Transport-related GHG emissions per capita (tons of CO2 per capita) 9.4 Lower levels of emissions are better Data source: Our World in Data https://ourworldindata.org/transport Air quality PM2.5 air pollution, mean annual exposure 3.9 Higher quality/lower levels of exposure are better Data source: World Bank https://data.worldbank.org/indicator/EN.ATM.PM25.MC.M3 ENVIRONMENTAL INDICATORS – ENERGY USAGE Transport non-renewable energy consumption Non-renewable energy used by mode (ktCO2e) Lower consumption of fossil fuels is better Data source: None, but could be derived from vehicle km and vehicle/engine types ENVIRONMENTAL INDICATORS – IMPACTS ON BIODIVERSITY AND LAND USE Habitat and ecosystem disruption Proportion of land area of particular habitat type disrupted by transport infrastructure Less disruption is better Data source: None FINAL SUMMARY REPORT: DECISION SUPPORT SYSTEMS FOR RESILIENT STRATEGIC TRANSPORT NETWORKS IN LOW INCOME COUNTRIES 19 Sustainability Indicator Example metric Related SDG Sustainable transport aims Land take by transport infrastructure Proportion of land area required for transport infrastructure Less land take is better Data source: None ECONOMIC INDICATORS – TRANSPORT DEMAND Passenger transport volume Number of passengers 9.1 Ambiguous, e.g. less congestion is better, but greater access is better. Could consider using an intensity (per unit of GDP) metric instead). Data source: World Bank Rail https://data.worldbank.org/indicator/IS.RRS.PASG.KM Data for other modes may be available via national datasets Freight transport volume Freight tonnage 9.1 Ambiguous, e.g. fewer fossil fuels are better but greater access is better. Could consider using an intensity (per unit of GDP) metric instead). Data source: World Bank Rail https://data.worldbank.org/indicator/IS.RRS.GOOD.MT.K6 Data for other modes may be available via national datasets ECONOMIC INDICATORS – OPERATIONAL EFFICIENCY Occupancy rate of passenger vehicles Number of people per vehicle Higher occupancy is better Data source: None Load factors for freight transport Average load factor More efficient is better (although there could be problems of overloading) Data source: None Average age of vehicle fleet Average age in years Newer vehicles tend to have lower operating emissions, but these have to be traded off against the embodied carbon in vehicle production. Data source: None Border restrictions / cooperation Delay to freight vehicles at border crossings Less restriction, more cooperation is better Data source: None, other than national freight strategy documentation FINAL SUMMARY REPORT: DECISION SUPPORT SYSTEMS FOR RESILIENT STRATEGIC TRANSPORT NETWORKS IN LOW INCOME COUNTRIES 20 Sustainability Indicator Example metric Related SDG Sustainable transport aims ECONOMIC INDICATORS - INFRASTRUCTURE Road/rail infrastructure quality Infrastructure quality index Higher quality is better (although ‘gold plating’ could be an issue) Data source: WEF via World Bank Road https://tcdata360.worldbank.org/indicators/haa1ef7dc Rail https://tcdata360.worldbank.org/indicators/h403e9361 Total length of road/rail networks Route km of road / rail Ambiguous, e.g. less congestion is better, but excess capacity is a waste of resources. Data source: World Bank, International Road Union, CIA World Factbook Rail https://data.worldbank.org/indicator/IS.RRS.TOTL.KM Other data may be available at a national level, or derived from open source geospatial data (such as OpenStreetMap) Density of infrastructure Km of infrastructure per km2 Ambiguous, e.g. less congestion is better, but lower use of fossil fuels is better Data source: Could be derived from OpenStreetMap data SOCIAL INDICATORS – ACCESSIBILITY AND MOBILITY Average passenger journey time Average journey speed Faster is often better, but high speeds may increase emissions. Data source: None Average passenger journey length Km per average journey Ambiguous. Unnecessary travel is environmentally damaging and has a negative time cost, but longer journeys can in some cases increase social inclusivity. Data source: None SOCIAL INDICATORS - SAFETY Persons killed in traffic accidents Number of deaths by mode 3.6 Fewer deaths are better Data source: World Bank https://data.worldbank.org/indicator/SH.STA.TRAF.P5 Traffic accidents involving personal injury Number of accidents by mode Fewer accidents are better Data source: None. Data is likely to be available at a national level SOCIAL INDICATORS – HEALTH IMPACTS Population exposed to or affected by traffic noise Percentage of population affected (by mode) Less exposure is better Data source: None FINAL SUMMARY REPORT: DECISION SUPPORT SYSTEMS FOR RESILIENT STRATEGIC TRANSPORT NETWORKS IN LOW INCOME COUNTRIES 21 Sustainability Indicator Example metric Related SDG Sustainable transport aims Cases of chronic respiratory diseases Percentage population with such diseases Fewer cases are better Data source: None SOCIAL INDICATORS – SOCIAL STRUCTURE Diversity Gender/ethnic split of labour force. Gender/ethnic split which is closer to the underlying ratio in the local/national population is better. Data source: None Equality and fairness Magnitude of gender/ethnic pay gap Smaller pay gaps are better. Data source: None Inclusivity Proportion of population served by intervention who are in the ‘most excluded’ quartile of the national/regional population. More inclusivity is better Data source: None The assessment methodology utilises the interactions between the range of sustainability indicators, interventions and scenarios by generating a decision matrix based on these interactions. Different options can be compared using weighting values (dependent on their relevance to the assessment criteria) and assigning impact values to each element for each option (depending on the strength of the relationship between intervention/scenario and sustainability indicator). Given a particular scenario or set of interventions, the tool provides pre-set expected impacts on sustainability for each of the main ‘pillars’ and their constituent indicators. Given the requirement for the assessment tool to be applicable across a range of geographical contexts, there is built-in flexibility, such that users are given an opportunity to alter these pre-set values, as local knowledge of the long-distance corridor’s geography or usage could provide a greater understanding of the impacts on sustainability, which may differ from the expected impacts provided by the option assessment tool. Any changes made during the setup of options will be logged as part of the reporting process. There are three main steps involved in the use of the sustainability assessment tool (Figure 16): 1) User selected intervention and scenario options. The intervention options are selected by the end user, using a set of menu options (with the opportunity to add bespoke interventions as necessary). A second set of options allows the user to select which scenario to include in the assessment (if any). 2) Agree expected impacts and weightings for each sustainability indicator. The user is presented with default weightings for each indicator, and the expected impacts of the selected scenario/ intervention(s). Users are asked to confirm agreement of the expected outcomes, or provide alternative outcomes based on other local knowledge and expertise. 3) Presentation of results. Once scenarios, interventions and sustainability impacts are agreed, the tool presents results, giving the expected impacts on sustainability for each of the three main ‘pillars’ of sustainable long-distance transport, presented as comparative change (either more sustainable, less sustainable, or unchanged compared with the ‘do minimum’ baseline). FINAL SUMMARY REPORT: DECISION SUPPORT SYSTEMS FOR RESILIENT STRATEGIC TRANSPORT NETWORKS IN LOW INCOME COUNTRIES 22 Figure 16: Simplified methodology for the option assessment tool The recommended approach when the sustainability assessment tool is being used by practitioners would be for the process to be undertaken by multiple stakeholders who may have different assumptions about the scale and types of impacts of different interventions. The decision processes, inputs and results could subsequently be compared to either provide a range of output results, or to promote further discussion prior to arriving at a consensus. FINAL SUMMARY REPORT: DECISION SUPPORT SYSTEMS FOR RESILIENT STRATEGIC TRANSPORT NETWORKS IN LOW INCOME COUNTRIES 23 takeholder engagement Stakeholder engagement has been key to this research, and from the outset the research team developed partnerships with relevant organisations in each of the four case study countries, building on previous collaborations with the two UK institutions which are leading the project. These ‘lead’ partner organisations are Strathmore University (Nairobi, Kenya), World Bank Group Transport & ICT (Dar es Salaam, Tanzania), National Roads Authority (Kampala, Uganda) and the Road Development Agency (Lusaka, Zambia). Effective links with these partner institutions have been crucial in identifying a range of stakeholders associated with multiple sectors, ranging from national governments and international finance institutions to local transport practitioners, advocacy groups and consultants, who could be approached to attend workshops and provide feedback on the research. There have been three rounds of workshops held online as the travel restrictions caused by the impact of Covid-19 meant visits to case study countries were not possible. The first set of five workshops were held in the Autumn/Winter of 2020/21, intended to ensure effective stakeholder engagement and LIC partner participation at an early stage in the project life, focusing on the scenarios, transport interventions and data requirements across the project. The second set of online workshops (in November 2021) was based on the sustainability of long-distance transport, while the final online workshop in June 2022 focused on the risk, resilience and adaptation options work. The three sets of online workshops attracted 44 different individuals in total, of which six attended two workshops, and two attended all three workshops, resulting in 54 total attendees (of the 134 who had expressed an interest in participating, a 40% attendance record). The final set of workshops in each of the case study countries were able to go ahead in person, summarised in Table 4. Five members of the research team travelled to East Africa on 17th September 2022, to carry out four half-day workshops, covering each of the main project WPs, and demonstrating an early version of the webbased decision support tool. Table 4: In-country workshops summary Details Attendance/ Registration 19/09/22: Zambia Co-host: Zambia Road Development Agency Location: Mulungushi International Conference Centre, Lusaka 15 / 21 Zambian organisations in attendance: • Chongwe Municipal Council • COMESA (The Common Market for Eastern and Southern Africa) • Lusaka City Council (LCC) • National Road Fund Agency (NFRA) • Ng'andu Consulting Limited • Oxford CCG • Oxford University • Road Development Agency (RDA) • UNDP Zambia • UNILUS & Private Consultant • Zambia Environmental Management Agency (ZEMA) • Zambia Institute for Policy Analysis and Research FINAL SUMMARY REPORT: DECISION SUPPORT SYSTEMS FOR RESILIENT STRATEGIC TRANSPORT NETWORKS IN LOW INCOME COUNTRIES 24 Details Attendance/ Registration 21/09/22: Tanzania Co-host: World Bank Location: Golden Tulip Hotel, Dar es Salaam 8 / 17 Tanzanian organisations in attendance: • AMEND • Dar Rapid Transit Agency (DART) • ITDP Tanzania • Tanzania Railway Corporation (TRC) • TAZARA Details Attendance/ Registration 23/09/22: Uganda Co-host: National Roads Authority Location: Protea Hotel by Marriott, Kampala 10 / 20 Ugandan organisations in attendance: • ICS Global • ITDP Africa • Makerere University • MBW Consulting • Prudens Law Advocates • Tripartite Transport and Transit Facilitation Programme (TTTFP) • UNRA FINAL SUMMARY REPORT: DECISION SUPPORT SYSTEMS FOR RESILIENT STRATEGIC TRANSPORT NETWORKS IN LOW INCOME COUNTRIES 25 Details Attendance/ Registration 26/09/22: Kenya Co-host: Strathmore University Location: Strathmore Business School, Nairobi 19 / 31 Kenyan organisations in attendance: • ASIRT Kenya - road safety NGO • Federation of East African Freight Forwarders Associations • Global Center on Adaptation • Kenya National Highways Authority (KENHA) • Ministry of Roads • Nairobi University • Northern Corridor Transit and Transport Coordination Authority (NCTTCA) • Strathmore University • Sustainable Transport for Africa • Trademark East Africa Of the 52 attendees across the four workshops, 40 were attending their first workshop event associated with this project. The visit has led to a significant increase in user interest and uptake of the work to help transport stakeholders in the region to improve their understanding of climate risk and adaptation prioritisation. Five potential case studies were identified during the in-country workshops, and subsequently assessed for suitability for inclusion in the main report, which includes a summary of each case study, and provisional results are provided for the risk and resilience assessment, together with the likely impact on sustainability using the option assessment tool. Results for the case study example in Kenya are provided below. FINAL SUMMARY REPORT: DECISION SUPPORT SYSTEMS FOR RESILIENT STRATEGIC TRANSPORT NETWORKS IN LOW INCOME COUNTRIES 26 Tool development The Systemic Risk Assessment Tool (SRAT) demonstrated in the in-country workshops has since undergone further development, based on feedback from those workshops, and discussions within the research team. The overall objectives of the SRAT are to: • present the results of a climate risk analysis for long-distance transport networks to estimate the economic impacts of physical climate risks and identify critical locations of vulnerability; • enable evaluation and prioritisation of policies and investment options to reduce losses and enhance infrastructure resilience; • assess transport interventions against indicators of economic, social and environmental sustainability. The tool development has largely relied on three components: • Data compiled on transport networks, freight flows, trade, hazards, costs, benefits and indicators; • Analysis methodology and codes used to conduct the risk assessment for road and rail networks in the case study countries, calculating exposure, risks of damages and disruption, and the potential to avoid risks through adaptation interventions; • Visualisation and user interface development to present and allow the detailed interactive exploration of data and the results of analysis, aiming to support decision-making processes around both riskreduction and broader aspects of sustainability in transport system interventions. The three web pages on Exposure, Risk and Adaptation take the user through the data used in the climate risk analysis, and the subsequent results generated. Please refer to the WP5 SRAT User Guide for a full walkthrough of the interactive web-based tool. The interactive web platform is freely and openly available online at https://eastafrica.infrastructureresilience.org/. The source code for the tool is developed and documented at https://github.com/nismod/infra-risk-vis/tree/release/east-africa. The analysis for the case study countries is produced using the code and models at https://github.com/nismod/east-africa-transport. All code is published open-source under an MIT license. FINAL SUMMARY REPORT: DECISION SUPPORT SYSTEMS FOR RESILIENT STRATEGIC TRANSPORT NETWORKS IN LOW INCOME COUNTRIES 27 Case study example Five potential case studies were identified during the in-country workshops, and subsequently assessed for suitability for inclusion in the main report. The case study for Kenya is summarised briefly below, and provisional results are provided for the risk and resilience assessment, together with the likely impact on sustainability using the option assessment tool. It should be noted that this is one individual example of how the tool can be applied, with values generated by the research team. The recommended approach when being used by practitioners would be for the sustainability assessment tool to be used by multiple stakeholders who may have different assumptions about the scale and types of impacts of different interventions. The decision processes, inputs and results could subsequently be compared to either provide a range of output results, or to promote further discussion prior to arriving at a consensus. Kenya: long-distance highway projects The Kenya National Highways Authority (KeNHA) is planning two long-distance highway projects: the LesseruKitale project, which is 55km in length, and the Morpus-Lokichar project, spanning 142km. Both projects are shown in Figure 17. Finance for these projects is beinfg provided by the African Development Bank (AfDB), who are receiving support from the Global Center on Adaptation (GCA). According to the AfDB, the road improvement projects on the corridor will “significantly enhance connectivity within the Eastern Africa Region, connecting the southern regions to the northern parts of Kenya linking landlocked South Sudan to Kenya”. Improvements to both sections will include changes to the road geometries, surface improvements and carriageway widening, although not adding extra lanes. In addition, pedestrian crossing facilities will be added in more urban areas. These improvements are likely to impact on road safety, reducing traffic accidents on the route. Using the flood risk assessment tool suggests that both road sections will be impacted by future river flooding, as shown in Figure 17, with estimated direct damages shown under different climate scenarios in Table 5 and displayed graphically in Figure 18. The EAEL for the most affected road segment in each section is shown in Table 6. These results suggest that a review of the adaptation options currently planned to limit the damage caused by potential future flooding would be prudent, to ensure they are appropriate given potential future risks. Figure 17: Case study – Kenya’s Lesseru-Kitale and Morpus-Lokichar road improvements, flood risk assessment FINAL SUMMARY REPORT: DECISION SUPPORT SYSTEMS FOR RESILIENT STRATEGIC TRANSPORT NETWORKS IN LOW INCOME COUNTRIES 28 Table 5: Kenyan case study – Estimated direct damages Section Scenario Year EAD (US$) (Sum of average EAD) Section 1 Lesseru-Kitale (55km) RCP 4.5 2030 23,698 2050 49,070 2080 28,883 RCP 8.5 2030 24,326 2050 66,398 2080 234,651 Section 2 Morpus – Lokichar (142km) Baseline 2019 67,417 RCP 4.5 2030 944,639 2050 1,087,527 2080 1,105,026 RCP 8.5 2030 1,014,464 2050 1,323,095 2080 2,188,378 Figure 18: Kenyan case study – Estimated annual damages chart - 500,000 1,000,000 1,500,000 2,000,000 2,500,000 3,000,000 Baseline 2030 2050 2080 2030 2050 2080 RCP 4.5 RCP 8.5 Expected Annual Damages (USD) Section 1 Section 2 FINAL SUMMARY REPORT: DECISION SUPPORT SYSTEMS FOR RESILIENT STRATEGIC TRANSPORT NETWORKS IN LOW INCOME COUNTRIES 29 Table 6: Kenyan case study – Expected indirect losses per day (most affected road segments) Section Scenario Year EAEL (US$/day) (Sum of average EAD) Section 1 Lesseru-Kitale RCP 4.5 2030 57 2050 286 2080 1,340 RCP 8.5 2030 56 2050 318 2080 3,360 Section 2 Morpus – Lokichar Baseline 2019 16 RCP 4.5 2030 192 2050 490 2080 3,250 RCP 8.5 2030 190 2050 653 2080 3,650 In terms of sustainability, these projects can be considered as major maintenance programmes. The default expectation for such an intervention in the assessment tool is that GHG emissions and energy consumption will reduce, road quality will improve resulting in reduced journey times and less noise caused by traffic. In addition, these road projects are expected to result in improved road safety. An example of the default and revised values for impacts and weightings are presented in Table 7. This road improvement project is likely to result in improved road surface conditions, but the impact will depend on how well the road is paved before any work is carried out. In this example, it is assumed that there will be moderate improvements (as the road surface is described as in a fairly good condition), the impact values in this example are reduced to 60% of the default values. In addition, road safety indicators are added to the assessment. The weighting values for all affected sustainability indicators are left unchanged, as they are all considered to be equally important. However, if for example the impact on road safety was of particular importance to the planners and decision makers, the weighting for the indicators relating to fatalities and accidents could be increased accordingly. Table 7: Kenyan case study – Default and revised values for impacts and weightings of related sustainability indicators Sustainability Indicator Default impact values Default weighting values Revised impact values Revised weighting values Improve infrastructure through maintenance GHG emissions 0.5 0.5 0.3 0.5 Energy consumption (non-renewable) 0.5 0.5 0.3 0.5 Road quality 1 0.5 0.6 0.5 Average passenger journey time 0.5 0.5 0.3 0.5 Population affected by traffic noise 0.5 0.5 0.3 0.5 Total number killed in traffic accidents 0 0.5 0.3 0.5 Total number injured in traffic accidents 0 0.5 0.3 0.5 Applying these impact values to the assessment suggest that this road expansion project will have FINAL SUMMARY REPORT: DECISION SUPPORT SYSTEMS FOR RESILIENT STRATEGIC TRANSPORT NETWORKS IN LOW INCOME COUNTRIES 30 • a slightly positive effect on environmental sustainability • a slightly positive effect on economic sustainability • a slightly positive effect on social sustainability Overall, this intervention could be considered to have a slightly positive effect on sustainability. Scores are translated from weighted numerical values to qualitative text descriptions as follows: scores less than or equal to -0.3 are considered strongly negative, scores in the range (-0.3, -0.05) are considered slightly negative, scores in the range [-0.05, 0.05] are considered neutral, scores in the range (0.05, 0.3) are considered slightly positive, and scores greater than or equal to 0.3 are considered strongly positive. FINAL SUMMARY REPORT: DECISION SUPPORT SYSTEMS FOR RESILIENT STRATEGIC TRANSPORT NETWORKS IN LOW INCOME COUNTRIES 31 Dissemination and next steps In addition to the stakeholder workshops and the various project reports produced as project deliverables, a number of other dissemination activities have taken place during the life of the project. Several blog posts have been published on the HVT website, and research outputs have been presented at several conferences and external events, including a CCG-organised side event at COP27 in Egypt. One academic paper is in the process of being published as part of the proceedings from the DRI technical conference held in New Delhi in October 2022. Two further papers are (at the time of writing) in the process of being put together and will be submitted to peer-reviewed academic journals in early 2023. It is also planned to hold a final project dissemination event in London on 24 January 2023, in partnership with project HVT050. While this research project has now come to an end, we have identified several potential next steps which could help increase both the impact from and the functionality of the tools generated during the project. These can be summarised as follows: 1) While this report includes some case study examples of how the decision-support tool can be used to assess specific interventions, there would be additional value in undertaking joint work with local stakeholder partners to carry out a more in-depth implementation of the methodology for specific schemes that are currently in development. This would ideally involve getting multiple stakeholder representatives (from different interest groups) to complete the sustainability assessment process and then conducting a focus group to help understand and resolve any differences in the results produced by the different stakeholders. Such work would include setting up locally hosted instances of the decision support tool. 2) Either as part of the work undertaken during item 1) or as a separate task, we would recommend working with local stakeholders to create case study (demonstrator) examples of how the sustainability assessment tool can be integrated with existing locally used modelling tools (such as traffic models or accident models). This would help demonstrate the flexibility and versatility of the decision support system through the incorporation of outputs from other models in the sustainability assessment process. 3) The resilience assessment carried out during this project focused on resilience to flooding. However, the general methodology that has been developed would be equally suitable for assessing other hazard types, assuming that suitable datasets on hazard likelihood are available. We would therefore recommend extending the resilience assessment to cover a range of other hazard types (such as landslides and extreme heat) to give a more comprehensive indication of which transport network links and nodes are most vulnerable to disruption. 4) While the methodologies and tools presented in this report have been presented and applied in the context of a specific case study region in Eastern Africa, they should also be suitable for application in other contexts. It would therefore seem sensible to explore what challenges might arise in transferring the methods to other context by applying them in case study LICs and/or LMICs in other parts of the world, such as South Asia or West Africa. 5) The main focus of much of this research has been on climate adaptation and mitigation, but there is also a clear imperative for transport systems to decarbonise as part of efforts to limit the extent of global heating. The sustainability assessment tool developed here does include an indicator relating to carbon emissions, but does not contain methods which specifically consider the most suitable interventions for decarbonising transport in LICs. There is therefore clear potential for research which would aim to create a specific decarbonisation (mitigation) module for the SRAT tool to complement the existing resilience (adaptation) module. This module would identify and quantify the main sources of carbon emissions associated with LDT in a particular country or region, and conduct a high level CBA of potential interventions to remove, reduce or offset those emissions. The existing sustainability assessment tool could then be used to consider and compare the broader sustainability of the most promising interventions identified by the decarbonisation module. Such an extension to the existing tool could prove extremely valuable to planners and policy makers working on decarbonisation plans in LICs and LMICs. FINAL SUMMARY REPORT: DECISION SUPPORT SYSTEMS FOR RESILIENT STRATEGIC TRANSPORT NETWORKS IN LOW INCOME COUNTRIES 32 University of Southampton Boldrewood Campus Burgess Road Southampton, SO16 7QF Email: S.P.Blainey@soton.ac.uk Web: www.trg.soton.ac.uk University of Oxford Environmental Change Institute School of Geography and Environment South Parks Road, Oxford, OX1 3QY Email: raghav.pant@ouce.ox.ac.uk Web: www.eci.ox.ac.uk