Overview
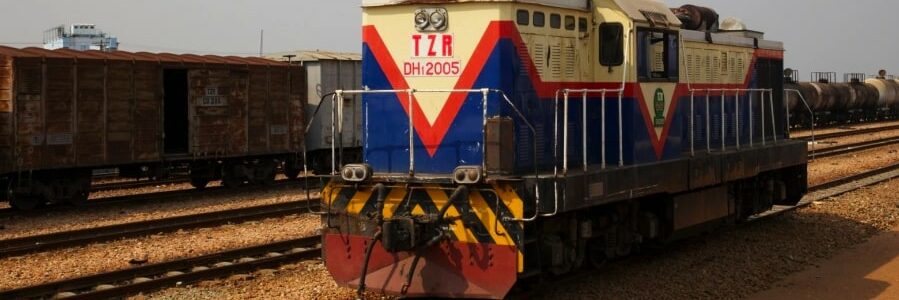
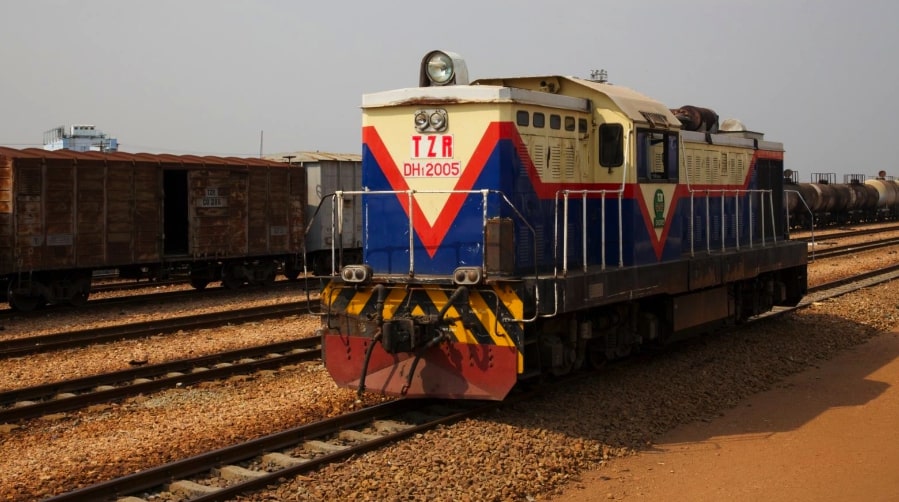
The project HVT/038, named Novel Traction Systems for Sustainable Futures in LICs, was set to investigate the feasibility and potential implementation of alternative technologies to railway electrification in low-income countries (LICs) in Sub-Saharan Africa. The ambitious research builds on a challenging context of growing pressures to decarbonise the transport sector, which are accompanied by financing constraints in developing countries. This final report compiles all research outputs and activities from the project, and sets out further steps to increase research uptake and potential pathways to commercialisation.
Publications with the same themes
Publications with the same study countries

Related news & events
News
PDF content (text-only)
Final Report Novel traction systems for sustainable railway futures in LICs February 2023 HVT/038 This research was funded by UKAID through the UK Foreign, Commonwealth & Development Office under the High-Volume Transport Applied Research Programme, managed by DT Global. The views expressed in this [leaflet/paper/report/other] do not necessarily reflect the UK government’s official policies. Reference No. HVT/038 Lead Organisation/ Consultant University of Birmingham Partner Organisation(s)/ Consultant(s) Title Novel traction systems for sustainable railway futures in LICs Type of document Project Report Theme Low carbon transport Sub-theme Climate Change: Adaptation and Mitigation Author(s) Marcelo Blumenfeld Tajud Din Stuart Hillmansen Clive Roberts Lead contact Clive Roberts (c.roberts.20@bham.ac.uk) Geographical Location(s) Sub-Saharan Africa Abstract The project HVT/038, named Novel Traction Systems for Sustainable Futures in LICs, was set to investigate the feasibility and potential implementation of alternative technologies to railway electrification in low-income countries (LICs) in Sub-Saharan Africa. The ambitious research builds on a challenging context of growing pressures to decarbonise the transport sector, which are accompanied by financing constraints in developing countries. This final report compiles all research outputs and activities from the project, and sets out further steps to increase research uptake and potential pathways to commercialisation. Keywords Railways, decarbonisation, Rail transport, low carbon, hydrogen trains, Sub-Saharan Africa, low-income countries Funding Acknowledgements Issue Status Author(s) Reviewed By Approved By Issue Date 1 Draft Marcelo Blumenfeld Tajud Din Stuart Hillmansen Clive Roberts 30/11/2022 Final Marcelo Blumenfeld Tajud Din 24/02/2023 i FINAL REPORT CONTENTS Section 1: Background to the project 5 1. Context 5 2. Aims and objectives 6 3. Methodology 6 4. Scope 7 Section 2: Traffic volume analysis 8 1. Update on the State of Knowledge (SoK) 8 2. Scenario analysis 10 2.1 African Vision 11 2.2 Renewed links 13 2.3 Private railways 13 2.4 Forgotten tracks 14 3. Selection of case studies 15 Section 3: Capability analyses 17 1. Single train simulator graphical user interface tool 17 2. Route analysis 19 Section 4: Architectural design 23 1. Revision of case studies 23 2. Details of the rolling stock configuration 23 2.1 Kampala – Namanve line 23 2.2 Dar es Salaam – Kigoma line 24 2.3 Abuja – Kaduna line 25 2.4 Volumetric analysis 26 Section 5: Retrofitting analysis 29 1. Introduction 29 1.1 Recent developments in Tanzania 29 1.2 Current fleet and infrastructure 29 2. Analysis of concepts of operations (CONOPs) 30 2.1 Key elements of CONOPs 30 2.2 Simulation Results 33 2.3 Hydrogen Production & Refuelling strategies 35 2.4 Added hydrogens wagons 38 3. Overall Comparative analysis of all CONOPs 38 4. Pathways for decarbonising an existing railway in low-income countries in SSA 38 Section 6: Conclusion and further steps 42 Section 7: Dissemination activities 44 Section 8: References 48 ii FINAL REPORT TABLES Table 1: List of countries within the scope of the project [9, 10] 7 Table 2: Data currency for countries (and international routes) within the study scope 10 Table 3. List of selected case studies 16 Table 4. Configuration used for each case study 20 Table 5. Summary of fuel requirements and respective emissions for each route studied 21 Table 6. Revised list of case studies 23 Table 7. Components considered for volumetric analysis 26 Table 8. Summary of volumetric analysis for alternative traction systems in each case study 27 Table 9: Components removed from the diesel train and the components added to the hybrid train 30 Table 10: 11 wagon formation with one locomotive 31 Table 11: 15 wagons formation with one locomotive 32 Table 12: 11 wagons formation with two locomotives 32 Table 13: 15 wagons formation with two locomotive 32 Table 14: 11 Wagons formation of retrofitted trains with one locomotive 33 Table 15: 15 Wagons formation of retrofitted trains with one locomotive 34 Table 16: 11 Wagons formation of retrofitted trains with two locomotive 34 Table 17: 15 Wagons formation of retrofitted trains with two locomotive 35 Table 18: Estimated costs of equipment required in production of hydrogen 36 Table 19: Estimated costs of operation and maintenance wind turbine, solar farm and electrolyser 37 Table 20: Estimated costs for retrofitting the hydrogen hybrid locomotive 37 Table 21: Pros and Cons of the different forms of traction systems 39 Table 22. Attendance list of key stakeholder workshop in January 2021 45 Table 23. Attendance list of steering board meeting in May 2021 45 Table 24. List of participants of the Short Course on Railway Decarbonisation 47 iii FINAL REPORT FIGURES Figure 1. Overall project methodology 6 Figure 2: Different track gauges in use in Sub-Saharan Africa (adapted from Creative Commons) [11] 8 Figure 3: Scenarios used for analysis 11 Figure 4: Proposed High-Speed Rail Network of the AU Agenda 2063 [32] 12 Figure 5: Future scenarios and their trajectories in selected themes 15 Figure 6: Screenshot of STS GUI 18 Figure 7: Photos of representative rolling stock used for simulations - (a) Uganda; (b) Liberia; (c) Tanzania; (d) Nigeria 20 Figure 8: Illustrative Example of a ULR vehicle 24 Figure 9. External view of an EMD GT22C-3M locomotive [49] 25 Figure 10. An illustrative example of a GE U26 locomotive 26 Figure 11. Flyer for Short Course on Railway Decarbonisation 46 Figure 12. Photos from the Short Course on Railway Decarbonisation 47 iv FINAL REPORT ABBREVIATIONS/ACRONYMS BCRRE Birmingham Centre for Railway Research and Education CDN Northern Development Corridor CEAR Central East African Railways CONOPs Concepts of operations EMU Electric Multiple Unit GNI Gross National Income HDI Human Development Index HVT High Volume Transport IP Intellectual Property IGBT Insulated-gate bipolar transistor kW Kilo Watt LIC Low-income countries RDC Railroad Development Corporation RSSB Rail Safety and Standards Board SDG Sustainable Development Goals SGR Standard Gauge Railway SMR Steam Methan Reformation SoK State of Knowledge STS Single Train Simulator UIC International Union of Railways UKRRIN UK Rail Research and Innovation Network ULR Ultra-light Rail 5 FINAL REPORT SECTION 1: BACKGROUND TO THE PROJECT 1. Context As the world enters the 21st century, the environmental impact of human activities is becoming an urgent matter to avoid irreparable damage. This includes the transport sector, which is one of the greatest pollutant emitters and energy consumers globally. According to the International Energy Agency, transport is responsible for 24% of direct CO2 emissions from fuel combustion. Road vehicles – cars, trucks, buses and two- and three-wheelers – account for nearly three-quarters of transport CO2 emissions. Moreover, as the global transport sector relies on fossil fuels for 92% of its energy, it is a considerable challenge to change energy paradigms whilst still supporting economic growth. Such over reliance on fossil fuels is seen as a time bomb that will hinder the ability of countries and regions to prosper under constrained energy conditions. This is a particular issue in low-income countries (LICs) in Sub-Saharan Africa, where road transport carries more than 80% of the goods and 90% of the passengers. It is not surprising that many countries have started ambitious programmes for decarbonisation to move away from their heavy dependence on fossil fuels. The matter is taken with high priority at a global scale. At least four of the United Nation’s Sustainable Development Goals (SGDs) relate directly with the reduction of carbon emissions and energy consumption for more resilient societies. Rail transport is therefore returning to a priority position in the sector, since it is one of the most sustainable modes of transport. Railways have the potential to reduce external costs of transport by at least 47.5% per passenger-km and 75.4% per tonne-km when compared to road modes. Furthermore, rail freight produces between 75% and 85% less greenhouse gas emissions per transport unit when compared to articulated trucks [1]. However, there is both an infrastructure and financial challenge in LICs in Sub-Saharan Africa. In these countries, most of the railway transport in Sub-Saharan Africa is still carried by combustion engines, and the electrification of lines seems a far-fetched vision. Less than 15% of the almost 80,000km of railway lines in Africa are electrified, spread across only eight countries. In fact, if South Africa is not counted, then only 6% of the railways are electrified [2]. In Sub-Saharan Africa, the only countries which have electrified railway lines are the Democratic Republic of Congo (858km) and Ethiopia (760km) [3]. Firstly, electrifying railway lines involves significant investments. Costs can range from £100,000 per kilometre in India to over £2,000,000 in European countries [3, 4]. Adding these amounts to the ongoing costs of building new lines and renewing existing routes could prove an unfeasible reality to most LICs. Secondly, the general production and availability of electricity in Sub-Saharan Africa is very low when compared to other regions. According to the World Bank, only 23% of the population has access to electricity [5]. In rural regions, less than one in ten inhabitants have such access. Considering that 2,500 kW is necessary to haul a train of 2,000 tonnes [6], efforts to electrify the railways in low-income countries would also have to include the capital investments of establishing power grids that are robust enough to cope with the high demands that can be of 0.05KWh per tonne-km and 0b.1KWh per passenger-km [8]. In turn, demands can be as high as 605MWh for the current traffic of Mozambique [8]. It logically follows that the decarbonisation route taken by high-income countries, namely the electrification of railway networks, seems unfeasible and uneconomic to low-income countries unless in a few main corridors. These countries currently operate traffic volumes that could not promote a justifiable investment in power grids to feed the railway network, especially at times when alternative traction systems are gaining momentum. 6 FINAL REPORT 2. Aims and objectives Therefore, the research project was set with an aim to explore cost-effective traction solutions for sustainable railway futures in Sub-Saharan low-income countries. Investigation of this kind is still unprecedented and can significantly assist the continent in leapfrogging the need for costly electrification whilst ensuring the growth in railway capacity in the region. The project focused on three primary areas: (i) modelling tools for the identification of specific capabilities in tractive requirements; (ii) architectural models for cost-effective traction solutions, and (iii) capacity building for research uptake on the operational and technical aspects of railway traction. To achieve that, five main objectives were pursued: • Analyse current and future traffic volumes in key railway corridors to draw representative case studies; • Model and simulate representative lines to identify the main capability requirements for alternative traction systems; • Develop a model architecture for zero-emission traction systems for LICs using volumetric analyses of a case study; • Devise retrofitting concept of operations (CONOPs) to maximise the potential benefits of using existing fleets; • Produce dissemination and research uptake in LICs on the technologies and solutions developed. 3. Methodology The methodology was devised over five main technical work packages aimed at transforming the initial literature review into representative case studies. Those were analysed using modelling and simulation tools to derive key capabilities and volumetric requirements. Subsequently, a case study was used to produce a more detailed perspective on the feasibility of retrofitting existing stock. These all converged into the production of the model as well as the delivery of dedicated training and engagement for dissemination and research uptake. Figure 1. Overall project methodology 7 FINAL REPORT 4. Scope The project focused on low-income countries (LICs) in Sub-Saharan Africa. The general definition of SubSaharan Africa is drawn from the United Nations Statistical Division and can be defined as the part of the African continent south of the Sahara desert consisting of the overwhelming majority of Africa’s landmass [7] [8]. We decided to exceptionally include Sudan in the research because of the similarities between the country’s railway infrastructure and the other Sub-Saharan African countries. Small island countries were not considered due to their scale. The definition of low-income countries in this project follows that of the World Bank, of having a Gross National Income (GNI) of US$1,035 per capita or less [9] in 2020. Nonetheless, it was found that the economic criterion alone would exclude countries that share similar issues with railway infrastructure and also qualify for international lending. The project team decided to add a second layer based on Human Development Indices (HDI) as defined by the United Nations Development Programme [10]. In this evaluation, countries scoring 0.55 or less are classed as low-development countries. It was found that some countries in Sub-Saharan Africa are classed as low-income but not as lowdevelopment, and some countries are classed as low-development but not as low-income. Some countries are found to be both in the low-income and low-development groups. These countries share some similarities in their state of infrastructure and operational performance. Some excluded countries were added to commentary and analysis as they may have a similar context or share railway lines with the countries within the scope of the project. Table 1 lists the countries within the scope of the project, as well as their GNI per capita and Human Development Index in 2021. Different colours have been used as identifiers: Table 1: List of countries within the scope of the project [9, 10] Country GNI per capita (in USD) Human Development Index Benin 1250 0.545 Burkina Faso 780 0.452 Cote d'Ivoire 2290 0.538 Djibouti 3310 0.524 DR Congo 530 0.480 Eritrea 600 0.459 Ethiopia 850 0.485 Guinea 930 0.477 Liberia 580 0.480 Madagascar 520 0.528 Malawi 380 0.483 Mozambique 490 0.456 Nigeria 2030 0.539 Sierra Leone 540 0.452 South Sudan 1090 0.433 Sudan 590 0.510 Tanzania 1080 0.529 Togo 690 0.515 Uganda 780 0.544 It is important to emphasise that the combined criteria may have left out countries that were also relevant to the study. Firstly, because they may not currently operate railway services, even if there is any railway infrastructure within the country. Secondly, because they may have development indicators which are closer to the scope of this project than the countries in the middle-income tier. Finally, because some countries may share border-crossing lines with countries that are within the scope of the project. As observed, it is difficult to set hard boundaries in scope because economic and/or development indicators do not necessarily correlate with the maturity of railway infrastructure or levels of operational performance. 8 FINAL REPORT SECTION 2: TRAFFIC VOLUME ANALYSIS 1. Update on the State of Knowledge (SoK) In 2018, the University of Birmingham’s Centre for Railway Research and Education (BCRRE) conducted a review of the state of knowledge on railway infrastructure in low-income countries (LICs) in Sub-Saharan Africa. The project was part of Phase 1 of the High Volume Transport (HVT) Programme and consisted of a thorough literature review supported by a stakeholder workshop in Nairobi, Kenya, to assess the levels of infrastructure and operational performance in the region. Regarding the maturity of the railway infrastructure, the overall state of Sub-Saharan African countries continues to be mostly in poor shape. With the exception of a few newly built lines, the network in the region has remained unchanged since the period of European influence, with assets dating back to almost 100 years ago. As a result, most lines are extraction lines connecting commodity hubs to ports. Moreover, also as a result of the fragmented and competitive European exploitation of the region, there is very little connectivity and interoperability. Figure 2: Different track gauges in use in Sub-Saharan Africa (adapted from Creative Commons) [11] With the emergence and subsequent dominance of road transport in the second half of the twentieth century, the railways in Sub-Saharan African low-income countries entered a downward spiral of shrinking revenues, insufficient maintenance, and inefficient operations that led to the current state. It was found that in many countries, major sections of tracks were not in operation and required rehabilitation before any operation could recommence, such as Ghana, Uganda, and Benin. Since the 1990s, the region has experimented with privatisations and concessions as an attempt to revitalise the railway sector with varying levels of success. Concessions such as SITARAIL (Burkina Faso/Cote d’Ivoire), CAMRAIL (Cameroon), Nacala-CDN (Mozambique), and MADARAIL (Madagascar) remain active and even productive in some cases. Other agreements were not as successful such as the Rift Valley Railway concession (Kenya/Uganda), where the operator did not achieve the expected performance set in the contract. Similarly, 9 FINAL REPORT TransRail operating between Senegal and Mali, has recently stopped operations due to the fluctuation in the price of commodities. Regardless of the ownership structure, the state of infrastructure in Sub-Saharan LICs was found to be insufficient when compared to the global averages, with a much more drastic contrast when compared to world leaders in railway transport [12, 13, 14]. For instance, The network density for all Sub-Saharan LICs, measured in route-km per km2 of land area, is only one-tenth of that of the United States, which has a similar land area. The total network size of the countries of this study combined is smaller than that of the top ten countries in the world in terms of network size and traffic. Data availability and consistency remain one of the main challenges for railway research in the region. Information regarding railway performance and assets was found to be outdated or missing. This was emphasised in the three main sources for the state of knowledge in the region [12, 15, 13]. Until 2009, the World Bank maintained a comprehensive database dedicated to railway infrastructure in Africa, which was used to fill knowledge gaps during phase one [16]. Since then, improvements in data reporting have been found to vary greatly among countries, being also influenced by changes in ownership. An updated commentary was made for data availability: • Lines operated by concessionaires were mostly found to lack transparency reporting. Information about Benin (BENIRAIL) and SITARAIL (Burkina Faso/Cote d’Ivoire) was only briefly available in the company’s annual report from 2018 [17]. The document mentions only the annual tonnage moved, in that tonne-km had to be inferred by multiplying it by the length of the line. • The Democratic Republic of Congo (DRC) was the only country where up-to-date data was published by the International Union of Railways (UIC) [3]. Being one of the few countries in the region to hold a membership of the union, the national operator (SNCC) maintains an updated record annually up to 2019 [18]. • Up-to-date information regarding the Ethio-Djibouti Railway Corporation was sent via e-mail in January 2021, with 2020 data, by the operator’s director following the project stakeholder engagement workshop. • Obtaining information about Guinea's railway network was particularly challenging due to its fragmented and independent private mining lines. Despite being the region's highest volume of traffic, the latest available information dates back to 2005, according to the World Bank database. • Similarly, there are few concrete sources of primary and secondary statistics for the Liberian railway sector. Building from the concessionaire’s latest annual report [19], Arcelor Mittal operates its renewed line between Buchanan and Tokadeh, connecting its mining operation and its port. • MADARAIL (Madagascar) has published partial reports on their respective websites, which are slightly outdated (2017) [20]. All statistics are included and allow the completion of their respective indicators. • Malawi publishes aggregated statistics on rail traffic through its Statistical Yearbook [21] • Three countries were found to lack any updated information: Togo and South Sudan. • Nigeria, despite being one of the few countries where renovation work and the construction of new lines have taken place, did not publish complete data sets within international standards (UIC) since 2005. In its Annual Abstract of Statistics [22], the country publishes the total number of passengers and the total number of tonnes carried but not passenger-km, not tonne-km. Similarly, information on railway transport stock is not published. A number of contacts in the Federal Ministry of Transportation have been contacted to provide updated information, but none has been received to date. • It was found that Sudan reported their national statistics regularly and comprehensively until 2014 within the UIC database [18]. No later data was found. Staff from the Sudan Railway Corporation were contacted to provide up-to-date information, but none has been received to date. 10 FINAL REPORT • Tanzania and Mozambique publish annual reports that were up-to-date (2019 and 2021, respectively), comprehensive, and clear in terms of performance (passenger-km and tonne-km) [23, 24]. • Traffic information from the Uganda Railways Corporation is up to date and found in the Statistical Abstract of the Uganda Bureau of Statistics [25]. Data includes net tonnes, tonne-km, and the number of passengers. There is no information regarding passenger-km. Table 2: Data currency for countries (and international routes) within the study scope Country/ International Route Data Currency Source(s) Benin 2005 2018 UIC database Bollore Logistics report [17] SITARAIL 2018 Bollore Logistics report [17] DR Congo 2019 UIC database [18] Ethio-Djibouti Railway 2021 Ethiopian Railway Corporation Guinea 2005 World Bank database [26] Liberia 2018 Arcelor Mittal [19] Madagascar 2014 MADARAIL website [20] Malawi 2007 UIC database [18] Mozambique 2019 Annual statistical report [24] Nigeria 2005 World Bank database [16] Sudan 2014 UIC database [18] Tanzania 2019 National statistics [23] Togo 2005 World Bank database [16] Uganda 2021 Uganda Bureau of Statistics [25] 2. Scenario analysis Trend analyses of railway traffic in low-income countries in Sub-Saharan Africa have indicated little predictability and highlighted the shortcomings of potential forecasts in the region. The fragmented trade and diverse uses and maintenance levels of lines across the region mean that volumes are highly volatile. The story in Uganda is a relevant example where the network was concessioned in an attempt to increase productivity which was not realised. Other countries, such as Guinea and Liberia, resorted to authorisation pathways where private companies have become responsible for the lines used, which led to high productivity and traffic densities [1]. Of the countries studied in this project, Tanzania represents the third group where large investments are being made in the construction of new Standard Gauge Lines to increase traffic volumes and make rail transport more attractive through economies of scale. In place of forecasts, therefore, the study applied scenario analysis methods to assess four different futures and their impacts on traffic volumes. Due to a lack of a comprehensive set of forecasts for traffic growth, scenarios build on projections made for the East African region by the World Bank [27]. In 2013, the report projected that traffic would grow 800% from 1.6 million tonnes to 14.6 million tonnes annually. Such forecasts were potentially taking into account the contemporary plans for an East African Standard Gauge Network, which has only been partially completed. Moreover, there have been issues and uncertainties surrounding the matter. While it was believed that a Standard Gauge Railway (SGR) line could carry 25 million tonnes annually against 5.5 million tonnes of a renovated legacy line, growth was not fully realised in the Kenyan case where the Port Authority needed to impose mandates on importers to fully utilise the line [28]. 11 FINAL REPORT However, the use of scenarios is meant to accommodate a range of possible futures, with the intent to capture the space between the probable and the desirable. There are many variables influencing traffic volumes, such as the quality of infrastructure; sections in use/disuse; speed limits; presence/absence of subsidies; ownership models; etc. This research used a more flexible approach based on the work of Gallopin et al. [29]. Four distinct scenarios were developed based on a two-dimensional matrix that encompasses two dimensions of Governance (the presence of strong strategic directions from the national and regional governments) and Technical Development (the implementation of current and future technologies on the systems). For a more detailed description of each scenario, please refer to the Traffic Volume Report [30] from this project. Figure 3: Scenarios used for analysis Scenarios were then evaluated against classes and variants, and their behaviour was analysed over a set of themes. In alignment with the HVT programme, the themes expand beyond operational indicators to include environmental, economic, and social aspects consideration. The themes in question are below, and the relevant behaviour of each scenario against the themes is shown in Figure 3Error! Reference source not f ound.. • Traffic volumes, as a product of operational efficiency • Technology adoption as a measure of innovation • Environmental impacts of railway transport • Financial viability reflecting the profitability of railway lines • Governance reflecting the role of government in maintaining the railway sector • Social impacts encompassing the wider influence on mobility, equity, and access to opportunities 2.1 African Vision This scenario explores the possibility of the completion, or at least part-completion, of the goals stated in the Agenda 2063 initiative of the African Union [31]. This includes a network of ten High-Speed Rail Corridors, as pictured in Figure 4 [32]. Very close to a desirable scenario; it encompasses significant changes in integration, technological advancement, modal shift, and cohesive governance. Based on a study by CPCS [32], these links can carry at least 50 million tonnes, whilst some may achieve much greater volumes of up to 15 billion tonnes 12 FINAL REPORT thanks to improved capacity and speed. Construction of new tracks occurs simultaneously with the renewal of existing lines for regional traffic and adds up to 20,000 km of tracks to the continent. This increases the network density and improves overall access by the population and businesses. Figure 4: Proposed High-Speed Rail Network of the AU Agenda 2063 [32] It logically follows that in such a vision, traffic volumes will increase considerably, perhaps achieving the 800% growth foreseen by the World Bank. Nonetheless, the growth will not be linear but an exponential curve. To achieve such an outcome, a slower start is to be made with works on interoperability, the construction of new infrastructure and the procurement of rolling stock. Once the systems are in place, the curve shoots upwards. To achieve that, the constant adoption of technological advancements must take place so that capabilities and performance levels are paved to enable the following steps in traffic volumes. This goes hand in hand with financial viability, where a positive feedback loop increases efficiency, which in turn lowers the price of haulage. Novel traction systems can find ways to increase capacity without the initial costs of electrification until volumes make the latter a justifiable investment. The positive impacts on the environment, however, can be observed from the beginning of the development trajectory and takes an accelerated pace. These are a result of cleaner technologies that reduce emissions at the point of use, as well as modal shifts resulting from lower haulage prices. Savings in emissions, however, follow the law of diminishing returns, and once technological capabilities reach a certain point, improvements begin to result in ever smaller marginal reductions. All the changes in the African Vision scenario are built on the understanding of better and more cohesive governance. This is in stark contrast to the situation so far, where initiatives for railway development have been fragmented and dispersed. The scenario envisages a more active presence of policy maker and regulators as enabling forces to facilitate the adoption of new technologies and facilitate funding of railways to promote a modal shift. 13 FINAL REPORT Social impacts, if these lines are planned cohesively as per the Agenda 2063 plan, will take place throughout the timeline. Firstly with the revitalisation of local routes, then with the possibility of easier travel through longer routes, and also benefitting in access to goods from more cost-effective supply chains. On a smaller but not irrelevant scale, the growth of the railway industry in the region also has a positive impact on jobs, entrepreneurship, and opportunity. 2.2 Renewed links The scenario of Renewed Links foresees a much more modest growth in the railway network, especially across low-income countries. In this scenario, high-speed rail links are achieved in higher-income countries but cannot find economic justification in low-income countries within the timeframe. Instead, it views a greater focus on the renewal and some upgrading of the existing network to reinstate traffic across the region. The scenario presents a mix of probable and possible futures based on the latest happenings in countries such as Nigeria, Kenya, and Uganda. Nigeria and Kenya, both countries that built new Standard Gauge Rail lines using international loans, have found considerable challenges in matching the high construction costs with sufficient traffic. Kenyan and Ugandan railways have also decided to invest in the revitalisation of existing metre gauge lines as a more cost-effective way to improve traffic in the region. Traffic volumes in the Renewed Links scenario take an initial hit as works must be performed on the only track available. However, once the work is done, sections of the network that are currently unused or with severe speed restrictions will return to full capacity and permit greater overall volumes. According to the World Bank study [27], track renewal could achieve up to 5.5 million tonnes hauled (considering 40 train services per week and 40 wagons per train) or 60 million per line fully upgraded to allow for 25 tonnes per axle. The physical limitations of renovated/upgraded tracks, in contrast to new SGR lines with higher specifications, may result in a slower upwards curve in traffic volumes. Nonetheless, considering a constant increase in governance and, consequently, technological adoption, it is expected that achievable (and achieved) traffic volumes are to increase at an accelerating pace and potentially exceed the initial calculations. The study highlights that metre gauge lines in Brazil can achieve 45 tonnes per axle, which could see traffic volumes reach 100 million tonnes on busy links. This scenario understands the crucial role of governance in providing a fruitful platform for innovation so that capabilities can be increased further than just returning the legacy network to its original state. Strong support in capacity building accompanies funding, especially when the latter comes from international loans. Also, governance plays an important role in connectivity and interoperability, improving the border crossing on currently dispersed and fragmented standards. Such a combination adds much-needed capacity to the networks and reinstates sufficient financial viability so that haulage costs are competitive against the rail. Regulation may still be necessary at points to internalise external costs and promote fair competition that benefits stakeholders equally. The increased role of rail in freight traffic, currently relegated to around 10% of the volumes moved in LICs in Sub-Saharan Africa, is expected to have a direct impact on the overall emissions from transport. With that, environmental benefits are expected to follow an S-shaped trajectory. Slower in the beginning, reflecting the time to reinstate infrastructure, but rapidly accelerating once the lines are at full capacity. At a certain point, diminishing returns result in marginal gains over increasing efforts until the sector achieves carbon neutrality. Similarly, social benefits increase from added accessibility of the reinstatement of abandoned routes, but at a smaller scale to the African Vision scenario where rail offers competitive alternatives to medium and longdistance links. Opportunities arise in the sector, yet given the scale of the industry, the impacts are constrained. 2.3 Private railways This analysis examines the likelihood of railways in low-income countries (LICs) in sub-Saharan Africa following the footsteps of Guinea, Liberia, and parts of Mozambique, where private companies take full or partial 14 FINAL REPORT control of railway lines. The study presents a potential version of the "business as usual" scenario, where the railways remain underdeveloped and are not renovated to stimulate sufficient traffic for financial sustainability. It highlights that some countries in the region may be moving towards this direction due to financial and governance challenges that hinder the funding of railway operations and maintenance, resulting in the gradual deterioration of rail infrastructure and making it increasingly challenging to sustain traffic. Private companies taking over may be the only solution when railways in LICs in Sub-Saharan Africa reach a point where they become financially unsustainable due to inadequate funding for operations and maintenance. However, it's important to note that not all concessions fall under this scenario as it depends on contractual terms. In cases where regulation is absent, concessions may follow a similar trajectory. The lack of governance and regulatory oversight may result in a downward curve, where the role of regulators and policy makers in the sector is gradually reduced. In such cases, traffic volumes tend to follow a predictable trajectory. Initially, traffic volumes stagnate, and the need for private investment becomes apparent. Private companies, driven by their incentives to reduce costs and increase productivity, select only the most profitable lines to operate. This approach is supported by examples from around the world, where essential upgrades are carried out on promising lines, resulting in traffic densities comparable to those found in high-income countries. Typically, such transformations occur in mining connections, where economies of scale generate healthy profit margins. These upgrades may involve line improvements or even the construction of Standard Gauge lines capable of carrying maximum axle loads and hauling as many tonnes as possible. However, relying on a single product for traffic may create limitations on traffic volume due to demand forces rather than technical capability. This situation is observed in Guinea and Liberia, where the haulage of a single product reaches values of over 7 million tonnes annually. On the other hand, some corridors have the potential to achieve much greater volumes by linking entire regions (such as the East African Community). Additionally, traffic volumes are also limited by the law of diminishing returns. At a certain point, the amount of engineering effort required to increase volumes becomes financially uninteresting. That is why the Private Railways scenario understands that financial viability follows a similar curve to traffic volumes, as both are closely linked in this case. Financial viability is limited by demand, and in the case of extractive activities, it may also be limited by supply. Technology adoption is also modest in this scenario because market forces drive it. There is a push for technologies that increases productivity, but cost-benefit analyses strictly scrutinise all innovation. Radical innovations like traction systems are less likely to be adopted if they require large fleets and/or infrastructure investments. Consequently, the environmental impacts remain largely unchanged since they are unlikely to be prioritised. In fact, since some less profitable corridors may be abandoned, the modal shift can revert to even greater dominance of road transport and lead to further environmental degradation. The same can be said for social benefits where there are few changes, lest some negative impacts. The productivity of privately run lines may not revert to social benefits if all are focused on the exports of commodities. 2.4 Forgotten tracks This scenario is a variation of the Private Railways and, to some extent, a projection of current trends in some LICs. Forgotten tracks explore the possibility that, apart from a few lines, most lines fail to produce sufficient financial viability to maintain operations. The lack of appropriate maintenance (due to financial shortcomings and skills gaps) initiates a vicious circle where capacity is reduced and, therefore, haulage costs increase. As a result, they fail to attract private investment and cannot justify the high level of subsidies or direct funding from public money. One by one, lines are slowly abandoned while goods are transported on roads where lower operational costs ensure some level of movement. Such a trajectory comprises an apathy towards the adoption of new technologies since continuous losses prevent stakeholders from investment beyond the bare essentials. Following the slow degradation of assets, 15 FINAL REPORT financial viability slowly declines from maintenance to speed restrictions, to section closures, to line abandonment. With it, the social benefits linked to railway transport erode to give way to unregulated modes where societal interests are an afterthought. With that, affordability and accessibility are reduced at the expense of unsolved cartels and high fares in the road and air transport. The trajectory of governance is expected to take an up-and-down curve until oblivion. Initially, the government and public funds are required to take over in order to maintain services. This is not dissimilar to the recent examples in Uganda, where the concession could not produce sufficient volumes, so assets were returned to the government body, and Kenya, where the face of the high interests on the loaned Standard Gauge line has led the government cancel the renewal of the concession and operate the line itself. Nonetheless, once the lines start to degrade to a certain level, funding for governance starts to be applied elsewhere, and with that, the network rapidly enters a downward spiral of shrinkage. Finally, the impacts on the environment are felt as the mode shifts towards more polluting options, mainly on the road. This scenario does not take into account potential changes in the road sector and adopts a businessas-usual perspective on it. Without appropriate policies, the unregulated road sector maintains reluctance to implement cleaner technologies, and 10% of freight moved by rail ends up generating up to three times more emissions per tonne-km. Figure 5: Future scenarios and their trajectories in selected themes 3. Selection of case studies Given the difficulty in elaborating a systematic process to select case studies in the region for further research, the project team adopted an alternative qualitative approach based on stakeholder inputs and line characteristics. The approach was based on representative case studies that would stand as example lines that can be found across the region so that quantitative analyses based on modelling and simulations were to be conducted. Following a key stakeholder workshop (page 44), in January 2021, experts were asked to submit their suggestions for case studies that are representative of the services operated in the region. From the comments received during the workshop and on a survey afterwards, four case studies were selected and are 16 FINAL REPORT listed in Table 3. The selection of case studies was through on the agreement level on their representativeness, indicated by the number of mentions in surveys or during the workshop. Table 3. List of selected case studies Route considered Country Route type Length Gauge Kampala – Namanve Uganda Commuter 14km 1,000mm Buchanan – Tokadeh Liberia Heavy haul freight 243km 1,435mm Dar es Salaam – Kigoma Tanzania Long distance passenger 1,254km 1,000mm Abuja – Kaduna Nigeria Standard Gauge Railway (designed for mixed traffic but currently only operating passenger services) 186km 1,435mm 17 FINAL REPORT SECTION 3: CAPABILITY ANALYSES 1. Single train simulator graphical user interface tool Following the selection of case studies performed in the simulation report [33] of this project, it was possible to analyse the traction capabilities required for each route in the form of traction power and energy consumption. This essential process enabled us to assess the feasibility and suitability of alternative traction systems. We used the University of Birmingham’s Single Train Simulator (STS), a piece of code written in Matlab (a mathematics ‘engine’). This was then used to calculate the traction energy required for a return journey, adding an estimated load to cover on-train services such as Heating, Ventilation and Air Conditioning (HVAC) and lighting. The Single Train Simulator (STS) is a software simulation tool developed by researchers at the Birmingham Centre for Railway Research and Education (BCRRE) for evaluating the energy consumption of railway traction. It is based on the first principle of longitudinal dynamics and the energy conservation principle. The longitudinal dynamics are expressed in the form of mathematical formulae that, when combined, form a simulation model. The model is then used to predict the motion of a train under a set of conditions, namely gradient, train mass, friction, and traction force applied [33]. For a more detailed description of STS, please refer to the Simulation Report [33] from this project. STS first computes the traction force 𝐹𝑇 required to fulfil a given acceleration profile 𝛼 using the Davis equation formula: m(1+λ)α=F(T-(a+bv+cv^2+mgθ) ) Where 𝑚 is train mass, 𝑎 + 𝑏𝑣 + 𝑐𝑣 2 is the summation of frictional forces, and 𝑚𝑔𝜃 is gravitational pull. The acceleration profile 𝛼 is derived from a given velocity profile 𝑣. After obtaining the traction force required to fulfil a trip, STS then computes the energy required by the respective traction system. STS uses powertrain efficiency curves that are custom to the selected traction technology in order to provide more accurate energy estimates. The energy required at each step is computed using the formula: 𝑬 = 𝑭𝑻𝜟 𝜼 𝛥 is the distance for which a specific 𝐹𝑇 is applied, and 𝜂 is the powertrain’s efficiency. Total energy consumption is then computed by adding the consumption of all steps. The energy calculation only accounts for traction requirements and does not account for hotel loads. The STS is highly flexible by allowing the user to specify the railway route and the parameters of the train simulated and modular enough to accommodate various traction systems, both conventional and hybrid. The state-of-charge 𝜁 of the energy storage device of hybrid powertrains is modelled using the formula: 𝒅𝜻 𝒅𝒕 = −𝒊 𝟑𝟔𝟎𝟎. 𝑸 𝑖 is battery current, and 𝑄 is battery capacity. Battery current is computed using battery voltage and traction power. 18 FINAL REPORT As part of the dissemination outputs of the project, we developed a Graphical User Interface (GUI) where stakeholders can conduct their own capability assessments for other lines beyond our case studies. The GUI was made publicly available, and the link was also shared directly with contacts in the project database. Figure 6 shows the interface of the tool. Figure 6: Screenshot of STS GUI The left part of the screen is dedicated to simulation settings and parameters, whereas the right part is reserved for plotting and displaying numerical results. This allows users to adjust routes and parameters without requiring reprogramming and presents key results clearly and understandably. However, it is important to note that the STS only provides values related to the kinetic energy required to move the train, which includes factors such as gravitational potential energy and drag. Other energy-consuming factors, such as lighting, heating, and cooling of passenger cars, are not included in the STS calculations. However, the power supply to these factors is isolated via the parameter Auxiliary Power to differentiate between traction power and auxiliary power. Section 1 of the GUI concerns vehicle characteristics. There are several default options, or one can customise their own train using the train properties in this section, including: • Tare mass (tonnes/trainset). This is the mass of the train (in tonnes) without crush load or passengers weight • Maximum speed (km/h). The maximum speed at the train is permitted to travel • Rotational inertia. This figure describes the fact that when a train moves, it is not just a particle; within the bearings etc., components have to be turned to achieve movement. To correct for this, a factor is applied, usually around 0.08 [34] • Max. motor power (kW). The maximum power (in kilowatts) that can be used to propel the train • Dwell time (s). This is the time (in seconds) allowed at each station by the simulator • Passenger/freight load (tonnes). The mass (in tonnes) of freight or passengers carried • Max. tractive effort (kN). The maximum force that the train can develop to move forward • Max. accelerating rate (m/s^2). The maximum acceleration which the train is permitted to use • Max. braking rate (m/s^2). The maximum deceleration which the train is permitted to use. 19 FINAL REPORT Section 2 of the GUI concerns the traction system, the system which takes a fuel or electricity supply and turns it into power for the wheels in order to drive the train. There are several types of traction systems to choose from, including: • Line side electrification. This is a system of supplying electricity to a train using the lineside infrastructure. When selected, the user may select a voltage for the substations (AC for overhead lines and DC for line side electrification) and the resistance of both the traction current distribution and the return current distribution (that is, the resistance of the circuit between the substation and the train, and back to the substation respectively) • Diesel. This simulates a diesel engine. When selected, the user may select the maximum power of said diesel engine • Hydrogen hybrid. This simulates a system made up of a hydrogen fuel cell and a battery. When selected, the user may input the power of the fuel cell stack (in kW), the capacity of the battery, and its C rate (more on this in Section 4) • Diesel hybrid. This is very similar to the hydrogen hybrid, but with a diesel engine in place of the fuel cell stack • Hydrogen only. This simulates a system made up of a hydrogen fuel cell only. When selected, the user may input the power of the fuel cell stack • Battery only. This simulates a train powered exclusively by a battery. One may input the capacity and C rate of the battery It should be noted that, while in theory, any of these can be simulated, some are not recommended in certain cases. For example, battery-powered trains are not appropriate for larger energy requirements due to the energy storage limitations of current battery technology. This was discussed in further detail in the Capability Analysis Report [35]. Section 3 concerns the route data. There are several test routes to choose from and a customised route option; this is entered externally in a spreadsheet provided with the STS. More information is found in the manual in Appendix B. The outputs consist of three diagrams: • A running diagram with velocity on the y-axis and time on the x-axis • A power diagram showing the power used by both the traction system and the brakes during the run • An energy diagram showing the cumulative energy use over the simulation run There are also several number outputs. For all cases, the journey time is listed, as is the kinetic energy required. The other outputs concern energy and fuel consumption, whether that be in terms of kilowatt hours (kWh) for batteries, diesel (litres) or hydrogen (kg) consumption. The user interface was hosted on the project website and the link sent via newsletter to stakeholders in the project’s mailing list in order to reach out potential users within a secure framework for file sharing. 2. Route analysis We used the Single Train Simulation (STS) tool to estimate the capability requirements of the four representative case studies. Due to the lack of digitalised and publicly available information, the topography of the routes was derived from Google Earth. The elevation is a critical component of the research as steeper inclines require more tractive power and therefore consume more fuel, under the assumption that speed is to be maintained. The line in Tanzania was divided into sections due to its length, which did not affect the accuracy of the simulation. Each line was assumed to have its relevant configuration in the number of locomotives and carriages or wagons. In addition, the weight of the rolling stock was also considered in a route-by-route manner, with more powerful locomotives being heavier and wagons having distinct loads. The detailed report on the 20 FINAL REPORT simulation, including figures on gradient profiles and results from the STS tool, can be found in our Capability Analysis Report [35]. The line between Kampala and Namanve, given its uniquely short length, lower speeds, and commuting characteristics, had obvious potential for battery systems. That is due to the lower power requirements and the shorter range required for the duty cycle. Therefore, it was simulated already using the battery-powered systems known as Ultra Light Rail (ULR). These are battery-powered multiple units that do not require a locomotive or additional large-scale infrastructure intervention [36]. Consequently, it is seen as a naturally cost-effective solution close to implementation. The train configuration was applied to the number of services run in each case study. Those were inferred from timetables found on operators’ reports and/or websites [37, 38]. There is a lack of available and accurate data for those. Figure 7 illustrate the rolling stock found to be in use in those countries, and Table 4 describes the configuration used for each case study. Figure 7: Photos of representative rolling stock used for simulations - (a) Uganda; (b) Liberia; (c) Tanzania; (d) Nigeria (a) [39] (b) [40] (c) [41] (d) [42] Table 4. Configuration used for each case study Configuration Uganda Kampala-Namanve Liberia Buchanan-Tokadeh Tanzania Dar - Kigoma Nigeria Abuja – Kaduna Number of locomotives 0 3 1 1 Number of wagons 5 75 10 6 Total mass (loaded) 160 tonnes 9580 tonnes 500 tonnes 340 tonnes 21 FINAL REPORT Traction power 840kW 9780 kW 1800 kW 1500kW Auxiliary power 50kW 120 kW 200 kW 120kW Using the configurations above in the STS tool gave us important outputs regarding each case study's fuel and/or energy requirement, measured against distinct types of traction systems. Both diesel and diesel hybrid systems were examined to account for the latest developments on existing combustion engines. Batteries were only considered for case studies where they could provide enough capabilities and therefore were limited to mostly the commuter case study in Uganda. Table 5 summarises the findings from the capability analysis in terms of fuel requirements and the associated CO2 emissions for each case study. The commuter line between Kampala and Namanve in Uganda was examined with four different traction systems as Diesel only, Diesel hybrid, Hydrogen hybrid and Battery only are presented in Table 5, whereas the others were only assessed with diesel, diesel hybrid and hydrogen hybrid systems. The term hybrid in both instances (diesel and hydrogen) means a combination with batteries to reduce fuel consumption. In railways, batteries can play an important part in storing energy also from regenerative braking. In many instances, diesel hybrid systems can provide marginal reductions in fuel consumption and emissions but still produce considerably more CO2 than alternative traction. Batteries and hydrogen systems are seen as having zero emissions at the point of use. However, our calculations [35] also considered that the production of hydrogen could be associated with emissions; therefore, our outputs highlighted the range of emissions produced. In all but one case, alternative traction systems have shown the potential to reduce CO2 emissions associated with railway services, even considering the externalities of hydrogen production from non-renewable sources. The exception found is the heavy haul line in Liberia, which could result in more environmental impacts due to the very high power requirements and steep gradients. Table 5. Summary of fuel requirements and respective emissions for each route studied Route Country Duty cycle considered Energy and emissions Capability analysis Traction system Amount required CO2 emissions Kampala – Namanve (Short distance, lightweight commuter train) Uganda Daily use (5 return trips) Diesel only 610 litres 1,633 kg Diesel hybrid 535 litres 1,431 kg Hydrogen hybrid 14 kg 0 to 192 kg Battery only 366 kWh 0 kg Dar es Salaam – Kigoma (Long distance, locomotive hauled passenger) Tanzania Return trip Diesel only 12,394 litres 33,214 kg Diesel hybrid 12,719 litres 34,084 kg Hydrogen hybrid 1,498 kg 0 to 20,508 kg Buchanan – Tokadeh (Medium distance, heavy locomotive hauled freight) Liberia Return trip Diesel only 2,814 litres 7,510 kg Diesel hybrid 2,470 litres 5,150 kg0 Hydrogen hybrid 1,941 kg 0 to 19,016 kg 22 FINAL REPORT Abuja – Kaduna (Medium distance, locomotive hauled passenger) Nigeria Daily use Diesel only 2,728 litres 7,311 kg Diesel hybrid 2,717 litres 7,282 kg Hydrogen hybrid 345 kg 0 to 4,715 kg The key overarching findings were as follows: • The shorter commuting route could be operated using a number of different types of traction, including hybrid drives, hydrogen and operated using ULRs rather than conventional rolling stock; • However, the longer passenger and freight routes require a considerable quantity of energy to be stored on-board, which restricts the number of alternative traction options that would be suitable; • The heavy haul freight route (in Liberia) requires a high-level of installed power which further restricts the suitable range of traction types. • Battery and hydrogen powertrains provide a clear emissions reduction in comparison to diesel for commuter and long-distance routes This step of the project was critical as it helped identify a case study that was not feasible to pursue due to the current performance of alternative traction systems. In contrast, electrification may be a more justifiable approach to decarbonising a heavy haul line by providing the required power and capacity between the mine and port, considering the existing high traffic volumes. This would increase the certainty of return on investments. For the other routes, findings show that alternative traction systems can stand competitively, providing enough capability to operate services as they are or as they may be in the future. In doing so, adopting alternative traction systems could lead to considerable reductions in CO2 emissions: 600 tonnes/year in Uganda, 1,000 tonnes/year in Nigeria, and over 10,000 tonnes/year in Tanzania. The values for hydrogen hybrid are given as a range because they depend on the source of electricity used to produce the fuel. The production of hydrogen is energy-intensive, so if the electricity comes from fossil fuel sources, the emissions associated with them will be high. Should the production of hydrogen come from zero-carbon sources, then all hydrogen hybrid systems are free of emissions. 23 FINAL REPORT SECTION 4: ARCHITECTURAL DESIGN 1. Revision of case studies Following the results from the capability analyses, it was established that the heavy haul case study in Liberia would not be yet suitable for alternative traction systems at the current state of technological performance. The analysis indicates that the total round-trip hydrogen requirement for the entire trip would be onerous, which makes it less suitable for the alternative traction system. Even if a hydrogen-hybrid option were pursued, refuelling would be performed at each end of the line rather than just fuelling the train once for the entire trip, which would still be far in excess of any existing hydrogen-powered train. Additionally, there is no overall benefit to hybridisation in terms of CO2 emissions, and the diesel hybrid option produces worse fuel consumption than the diesel-only option due to the constant speed nature of the route. The report also suggests that the SMR hydrogen emissions figure is exceedingly high due to the fuel cells operating in an inefficient regime for a protracted period, combined with the inherently high carbon emissions of SMR hydrogen production. Table 6 then shows the three case studies that were taken forward to the next stage, namely the Architectural Design process. Table 6. Revised list of case studies Route considered Country Route type Length Gauge Kampala – Namanve Uganda Commuter 12km 1,000mm Dar es Salaam – Kigoma Tanzania Long distance passenger 1,254km 1,000mm Abuja – Kaduna Nigeria Standard Gauge Railway (designed for mixed traffic but currently only operating passenger services) 186km 1,435mm 2. Details of the rolling stock configuration 2.1 Kampala – Namanve line Kampala to Namanve is a 12 km route located in the suburbs of the Ugandan capital Kampala. The complete track is designed with a 1000 mm gauge (also known as a meter gauge). The route consists of five stations, including the terminus at the Namanve [43]. The track comes with a mild elevation of a few meters on a few sections. The track serves approximately 2,000 passengers daily over 2 round trips per day. Due to a lack of data, the line speed of this route was assumed to be 40 kph. The rolling stock operating on the above-mentioned route is a locomotive-hauled train with an average of 5 coaches, which includes only seated coaches [44]. Data was very sparse for that specific fleet. Thus, we decided to approach the capability using a current solution, namely an ultra-lightweight rail vehicle (ULR). The ULR, although unavailable in LICs, was chosen to expand the research on novel traction systems to those where electric traction may be sufficient. In the simulation report, the ULR was simulated in a configuration with five carriages to match that operating in Uganda. Alternative operations that could require shorter trains were not calculated as they are outside the scope of the project. The hydrogen hybrid ULR would require considerable hydrogen storage space, 24 FINAL REPORT specifically if the operator does not choose to refuel tanks frequently on stops at the terminus station. However, in this case study, the route is quite short, and only 2 round trips are carried out during the day. It should be noted that the Severn Lamb ULR is a hybrid. This usually consists of a diesel generator feeding a hybrid series system, but a hydrogen fuel cell module could reasonably be fitted in place of the diesel generator. In addition, a battery-only ULR option was modelled by assuming a 100 kWh battery pack per vehicle to give a total of 500 kWh of storage and the same total power output of 840 kW. It is assumed that the existing rolling stock consists of an 80-tonne locomotive (a typical weight for a locomotive of this size), hauling five conventional coaches of 35 tonnes each. This gives a total of 255 tonnes for the train. However, the mass of the ULR-based model, consisting of 5 vehicle configurations, was assumed to be 160 tonnes, including 60 tonnes crush load. In the absence of more accurate data, a line speed of 25 mph has been assumed for the model. The reason for the relatively slow speed is that the line is mainly open with no boundary fence, so there is a significant risk of collisions with pedestrians. It is also the case that most stations have no platforms or expected waiting areas, and people commonly gather around the track. Considering the specific energy and energy density of diesel and hydrogen fuel, 1 kg of hydrogen provides 33.3 kWh of energy; however, 1 litre of diesel fuel provides 10.96 kWh of energy [45] [46]. To match the amount of kWh energy required for the completion of a round trip for the above-mentioned route, 14 kg of hydrogen is required to be stored in hydrogen tanks. Since the ULR vehicle lacks regenerative braking, its batteries can only be charged by the onboard fuel cell. However, the Kampala-Namanve line, being a regional line with five stops, has great potential for generating regenerative energy that can be used to charge the onboard batteries. Figure 8: Illustrative Example of a ULR vehicle 2.2 Dar es Salaam – Kigoma line Dar es Salaam to Kigoma route is a 1,200 km track in Tanzania that starts from Dar es Salaam on the Indian ocean coast towards Kigoma on the shore of Lake Tanganyika. The track was built between 1905 and 1914, starting from Dar es Salaam to Kigoma. The complete track is designed with a 1,000 mm narrow gauge. The track comes with significant elevation gains throughout, such as towards Tabora, there is an elevation of 1,300 m; towards Mwanza, there is an elevation of 1,140 m and towards Kigoma, there a depression of 770 m [47]. A more detailed illustration of the gradients, elevation, and calculations of each route can be found in the Capability Analysis Report [35] of this project. 25 FINAL REPORT The rolling stock operating on the above-mentioned route is a locomotive-hauled train with an average of 10 coaches, including sleepers and seated coaches. Since the lack of availability of data about a specific train that operates on the mentioned route, an example locomotive EMD GT22C-3M was considered for simulation and architectural design. The choice of locomotive took into account its wide use in the region, and the choice of this locomotive for the simulation and architectural design appears to have been driven by practical considerations such as availability, cost-effectiveness, and reliability. The locomotive weighs 110 tonnes and comes with a gross power of 1,850 kW. It has a diesel-electric traction system and a capacity of 7,500 l of diesel fuel [48]. Figure 9. External view of an EMD GT22C-3M locomotive [49] Results from capability analysis indicate that a total of 12,394 l of diesel fuel is required to complete a round trip from Dar es Salaam to Kigoma using a diesel-only locomotive. The fuel requirements include the +20% for eventualities [35] presented in Table 16in the capability analysis report. On comparative analysis, the results also indicate that only 1,498 kg of hydrogen would be required to complete a round trip from Dar es Salaam to Kigoma for a hydrogen hybrid version and 12,719 l for a diesel hybrid version. The modelling parameters such as velocity, mass, Davis parameters and traction powers of simulated trains are assumed to be the same or nearest possible as the existing rolling stock. 2.3 Abuja – Kaduna line The route Abuja-Kaduna in Nigeria is 185 km long and runs from the Nigerian capital Abuja to the city of Kaduna. The track was built by China Civil and Engineering Construction company between 2011-2014. This track is among the first modern standard gauge line in Nigeria. Currently, all passenger trains on this route are cruising at a maximum speed of 100 kph consuming 2 hours of journey time for both sides. The track comes with a moderate elevation at a few locations, as on the way back from Kaduna to Abuja, there are two major elevation points [50]. The rolling stock operating on the above-mentioned route is a locomotive-hauled train with an average of 6 coaches, which includes seated coaches only. Since the lack of availability of data about a specific train that operates on the mentioned route, an example locomotive GE U26 was considered for simulation and architectural design. The choice of locomotive took into account its wide use in the region, and the choice of this locomotive for the simulation and architectural design appears to have been driven by practical considerations such as availability, cost-effectiveness, and reliability. The locomotive weighs 100 tonnes and comes with a gross power of 1,500 kW. It has a diesel-electric traction system and a capacity of 7,500 l of diesel fuel [51]. 26 FINAL REPORT Figure 10. An illustrative example of a GE U26 locomotive Based on the results from the capability analysis report [35], the train that was simulated over the abovementioned route was assumed to be a set of 7 carriages, with a total mass of 340 tonnes, as presented in Table 4. The simulated train comes with a total power of 1,500 kW, providing 120 kW for auxiliaries and 1,380 kW for traction. Simulation suggests that with an average speed of 100 km/h, the train took 4 hours for a return trip from Abuja to Kaduna. Results from capability analysis indicate that a total of 1,358.43 l of diesel fuel is required to complete a round trip from Abuja to Kaduna by a diesel-only locomotive. To match the amount of kWh energy required for the completion of a round trip for the above-mentioned route, 172.08 kg of hydrogen is required to be stored in hydrogen tanks. The modelling parameters such as velocity, mass, Davis parameters and traction powers of simulated trains are assumed to be the same or nearest possible as the existing rolling stock. 2.4 Volumetric analysis The volumetric analysis combined the findings of the capability analysis with the detailed configuration of locomotives and consisted of evaluating whether alternative traction systems would fit within the volumes and the weight of existing assets to produce similar capabilities. The results from the simulation provided the amount of hydrogen in kgs that would be necessary to fulfil the respective duty cycle. The architectural design stage transformed the conceptual, quantitative assessment of the capability analysis into a physical evaluation of assets and their suitability for conversion into an alternative system. This is an important stage before any retrofitting study because it sheds light on whether alternative systems can be fitted within existing rolling stock and infrastructure or whether changes to their concept of operations must be made to address the different performance and capabilities. With that, the volumetric analysis looked at the physical aspects of replacing the components related to combustion engines in each locomotive with the components needed for a hydrogen hybrid system. Table 7 lists all components that were considered for the calculations. Table 7. Components considered for volumetric analysis Combustion engine components Hydrogen hybrid components Fuel Tank (Dry) Fuel Cell Modules Sand Tank (Empty) Fuel Cell Coolants 27 FINAL REPORT Engine Battery Box Compressor/ Air subsystem Auxiliary Battery Box Hydrogen Pipework, Valves & Ancillaries Auxiliary Heating & Ventilation Unit Hydrogen Tanks Alternator / Generator (GTA11 C.C) Hydrogen (H2) Engine GE 7FDL-12 (wet) Battery Pack Turbo Charger Traction Motors Traction Motor GE-761A17 (x6) Insulated-gate bipolar transistor (IGBT) Silencer & exhaust pipes Converter Charged air cooler (nested pipework) Lube Oil Cooling Water Tank (Dry) Miscellaneous/Others Our results show that conventional vehicle operating on the shorter commuter route is feasible for conversion based on the energy required for daily trips due to the lack of data available, which was based on an illustrative use of modern ultra-light rail (ULR) vehicles in a similar configuration. Results show that a battery-electric system would also suffice for the line, demonstrating potential feasibility in the use of alternative traction for such cases. The longer passenger and mixed traffic routes, however, showed opposite results. Both long-haul freight and passenger locomotives require the storage of a large amount of hydrogen, which subsequently requires installing a large number of hydrogen tanks. Since there isn’t any specific data available about different trains where the number of installed tanks can be identified, therefore, it cannot be quantified in this specific area other than providing a general expression about quantity and storage. This installation will technically increase the overall weight and volume of the train. Both cases did not require much more weight than a diesel equivalent but required a considerably larger volume (around 40% more), which is challenging at this stage. Table 8 below summarises our findings. Table 8. Summary of volumetric analysis for alternative traction systems in each case study Case study Weight (kg) Volume (m3 ) Commuter Line with ULR (Kampala – Namanve) Within Weight (-1.75%) Within Volume (-2.65%) Mixed traffic long-distance (Dar es Salaam – Kigoma) Over-weight (+5.3 %) Over-volume (+37.7%) Medium distance passenger (Abuja – Kaduna) Over-weight (+5.78%) Over-volume (+42.9%) Despite case studies initially suggesting that ULR is a feasible choice as being within weight and volume, the technology is still in development, and full-scale implementation is yet to be carried out by manufacturers. This would require an entire overhaul of technology and regulatory capabilities. Therefore, ULR may not be deemed a cost-effective solution for the “Kampala-Namanve” route. Considering this, it was decided to proceed with the Tanzania case study because it was more realistic and representative of sub-Saharan railway operations, especially those concerning the movement of goods. The Standard Gauge line in Nigeria is still part of a select group of lines using more modern standards and, due to economic and political issues, does not run freight services at the moment. It must be highlighted that our 28 FINAL REPORT calculations at that stage maintained the concept of operations intact, meaning that the requirements were based on the same duty cycles of diesel trains. Further discussions on a different concept of operations were conducted in the retrofitting stage 29 FINAL REPORT SECTION 5: RETROFITTING ANALYSIS 1. Introduction The retrofitting analysis advanced the work of capability analysis and architectural design to investigate the physical viability of novel traction systems. More specifically, it focuses on the retrofitting of the current fleet of LICs into pure hydrogen and hydrogen hybrid versions based on volumetric analysis of the traction requirements identified in the previous stages. For this stage, only one case study was selected, that of the Dar es Salaam – Kigoma line in Tanzania for being the most representative line of current services in Sub-Saharan Africa. The main objectives were to develop multiple versions of pure hydrogen and hydrogen hybrid railway fleets, analyse the possibility of Hydrogen as a new alternative fuel for the LICs railway sector, and compare it with existing diesel counterparts. This was achieved by developing sixteen models of existing trains, retrofitted with hydrogen fuel cells and batteries assessed with 11 and 15 wagons configurations, including single and dual locomotive formations. The configuration of consists was based on conversations with the Tanzania Railways Corporation. The retrofitted models of the train were simulated on the 1,254 km metre gauge line. 1.1 Recent developments in Tanzania Such distinction is important as the Tanzanian Railway Corporation is currently building a new Standard Gauge Line. The construction of the central railway standard gauge involves the use of highly advanced technology and power, which enables the increase of speed from 30km/h to 160km/h [52]. Moreover, the new standard gauge railway line will also increase axle load from 13 tonnes to 35 tonnes [53]. The standard gauge central line is being built into phases; phase one will be from Dar es Salaam to Mwanza (1219km), which is also implemented in sections as follows [54]: 1. Dar es salaam- Morogoro (205 km), 2. Morogoro – Makutupora (336 km), 3. Makutupora- Tabora (km 249), 4. Tabora- Isaka (km 133) and, 5. Isaka- Mwanza (km 249). Construction of the first section completed in 2022. For the rest of the sections, construction is expected to be completed in November 2025. The SGR has a modern Signalling and Telecommunication (S&T) System based on European Railway Traffic Management System (ERTMS-II) and GSM – R [55] [56]. Despite the significant advancements in the capacity that the new line will provide, TRC has highlighted that the existing metre gauge line is still a valuable asset and will not be dismantled. Instead, it can be used for local passenger and freight services and support the role of the railways in the country’s economic development. With that, the investigation of alternative traction systems on the metre gauge line still holds relevance and timeliness. 1.2 Current fleet and infrastructure The TRC uses 23 GE U2C diesel-electric locomotives rated at 2,200 kW output power as their primary mover to complete their railway transport operation. [57] In 2021, Tanzania Railway Corporation (TRC) awarded Hyundai Rotem a KRW 335.4 billion (USD 280.67 million) contract to deliver 80 multiple electric units and 17 electric locomotives expected to be delivered by 2024 [58]. The same year The Tanzania Railway Corporation (TRC) received 44 freight wagons as part of a project (SGR) to upgrade the country’s central line to improve cargo transportation [59]. 30 FINAL REPORT 2. Analysis of concepts of operations (CONOPs) This section describes the key parameters considered while developing the retrofitted train configurations. As it was found in the volumetric analysis, the volume available on a locomotive would not be sufficient to cover the entire length of the line between Dar es Salaam and Kigoma. Therefore, two alternative concepts of operations (CONOPs) are analysed: Refuelling stops The first concept of operations maintains the existing configuration of one locomotive (and 11 or 15 wagons), adding refuelling stops where necessary. This CONOP builds on the assumption that refuelling can be done without detriment to existing timetables. Range extender tanker The second concept of operations includes a tanker car filled with hydrogen to extend the range of the fuel cell system. The tanker is specifically pressurised at 350 bar to fit sufficient amounts of hydrogen that justify its addition to length and weight. In contracts to smaller vehicles that use hydrogen pressurised at 700 bar, railway vehicles only require 350 bar pressure to have a similar range to a gasoline vehicle due to the available space on the top, bottom or inside of the railway vehicle to mount the hydrogen storage tanks [60]. 2.1 Key elements of CONOPs Four different basic sets of train formations were considered in the modelling of retrofitted trains: • The first set of formations includes 11 wagons and one locomotive. • The second set of formations includes 15 wagons and two locomotives. • The third set of formations includes 11 wagons and one locomotive. • The fourth set of formations includes 15 wagons and two locomotives. On those, three types of traction systems were considered: • Diesel: conventional combustion engine. • Pure hydrogen: using hydrogen fuel cell systems. • Hydrogen hybrid: combining fuel cell systems with batteries. The extended version with the tanker was considered for both hydrogen systems.Error! Reference source not f ound. Table 9 presents the components with the weight that has been removed from the existing diesel train and the components that were added to the existing train to model the hybrid hydrogen version. The weight of the existing diesel locomotive was 110 tonnes. After retrofitting the existing locomotive, the hybrid hydrogen train weight resulted in 107 tonnes. Table 9: Components removed from the diesel train and the components added to the hybrid train Components Removed From Diesel Train Components Added To Hybrid Hydrogen Train Components Weight (kg) Components Weight/Item (kg) Quantity Total Weight (kg) Diesel Fuel 5,762 Fuel Cell Modules 280 15 4,200 Fuel Tank (Dry) 2,345 Fuel Cell Coolants 44 15 660 Engine Battery Box 230 Compressor/ Air subsystem 61 15 915 Auxiliary Battery Box 230 Hydrogen Pipework, Valves & Ancillaries 100 8 800 31 FINAL REPORT Auxiliary Heating & Ventilation Unit 100 Hydrogen Tanks 324 32 10,368 Alternator / Generator (AR10) 2,000 Hydrogen (H2) 27.8 32 889.6 Engine EMD 12-645E3C (wet) 12,800 IGBT Converter 300 6 1,800 Turbo Charger 560 Battery 352 13 4,576 Silencer & exhaust pipes 172 Traction Motors 1800 6 10,800 Charged air cooler (nested pipework) 100 Lube Oil 627 Cooling Water Tank (Dry) 787 Miscellaneous/Others 1,000 Traction Motors 10,800 Total 37,513 35,008 Detailed information on train formations is presented in Table 10 to Table 13. Table 10: 11 wagon formation with one locomotive 11 Wagon formation with one locomotive Parameters Diesel Pure Hydrogen Hydrogen Hybrid Pure Hydrogen Extender Hydrogen Hybrid Extender Locomotive Weight (Tonnes) 110 106 107 106 107 Empty wagon Weight (Tonnes) 30 30 30 30 30 Crush Load (Tonnes) 70 70 70 70 70 Hydrogen Tanker Weight (Tonnes) 0 0 0 46 46 Additional H2 Weight (Tonnes) 0 0 0 3 3 Total Weight (Tonnes) 1,210 1,206 1,207 1,255 1,256 Table 10 suggests a 0.33% and 0.25% decrease in the weight of pure hydrogen and hydrogen hybrid retrofitted versions of trains, respectively, compared to their diesel counterpart. However, a 3.7% and 3.80% weight increase is observed in the extended version of pure hydrogen, and hybrid hydrogen retrofitted versions, respectively, compared to the original diesel version. This is due to carrying an additional hydrogen tanker. 32 FINAL REPORT Table 11: 15 wagons formation with one locomotive 15 Wagons formations with one locomotive Parameters Diesel Pure Hydrogen Hydrogen Hybrid Pure Hydrogen Extended Hydrogen Hybrid Extended Locomotive Weight (Tonnes) 110 106 107 106 107 Empty wagon Weight (Tonnes) 30 30 30 30 30 Crush Load (Tonnes) 70 70 70 70 70 Hydrogen Tanker Weight (Tonnes) 0 0 0 46 46 Additional H2 Weight (Tonnes) 0 0 0 3 3 Total Weight (Tonnes) 1,610 1,606 1,607 1,655 1,656 Table 11 shows a 0.25% and 0.19% decrease in the weight of pure hydrogen and hydrogen hybrid retrofitted versions of trains, respectively, compared to their diesel counterpart. However, a 2.8% and 3.86 % weight increase is observed in the extended version of pure hydrogen and hybrid hydrogen retrofitted versions, respectively, compared to the original diesel version. This is due to carrying an additional hydrogen tanker. Table 12: 11 wagons formation with two locomotives 11 Wagons formations with two locomotives Parameters Diesel Pure Hydrogen Hydrogen Hybrid Pure Hydrogen Extended Hydrogen Hybrid Extended Locomotive Weight (Tonnes) 220 212 214 212 214 Empty wagon Weight (Tonnes) 30 30 30 30 30 Crush Load (Tonnes) 70 70 70 70 70 Hydrogen Tanker Weight (Tonnes) 0 0 0 46 46 Additional H2 Weight (Tonnes) 0 0 0 3 3 Total Weight (Tonnes) 1,320 1,312 1,314 1,361 1,363 Table 12 presents a 0.61% and 0.45% decrease in the weight of pure hydrogen and hydrogen hybrid retrofitted versions of trains, respectively, compared to their diesel counterpart. However, compared to the original diesel version, a 3.11% and 3.26 % weight increase is observed in the extended version of pure hydrogen and hybrid hydrogen retrofitted versions. This is due to carrying an additional hydrogen tanker. Table 13: 15 wagons formation with two locomotive 15 Wagons formations with two locomotives Parameters Diesel Pure Hydrogen Hydrogen Hybrid Pure Hydrogen Extended Hydrogen Hybrid Extended Locomotive Weight (Tonnes) 220 212 214 212 214 Empty wagon Weight (Tonnes) 30 30 30 30 30 33 FINAL REPORT Crush Load (Tonnes) 70 70 70 70 70 Hydrogen Tanker Weight (Tonnes) 0 0 0 46 46 Additional H2 Weight (Tonnes) 0 0 0 3 3 Total Weight (Tonnes) 1,720 1,712 1,714 1,761 1,763 Table 13 suggests a 0.46% and 0.35% decrease in the weight of pure hydrogen and hydrogen hybrid retrofitted versions of trains, respectively, compared to their diesel counterpart. However, compared to the original diesel version, a 2.4% and 2.5% weight increase is observed in the extended version of pure hydrogen and hybrid hydrogen retrofitted versions. This is due to carrying an additional hydrogen tanker. 2.2 Simulation Results The detailed results of simulations for each version of pure hydrogen and hydrogen hybrid trains are presented in Tables 14 to 17, along with the extended version of retrofitted trains. Each table shows the hydrogen each train uses to complete the journey, along with its range and journey time. It should be noted that each trip represents a return journey comprised of 2400 km, i.e. from Dar e Salaam to Kigoma and Kigoma to Dar e Salaam. Table 13 illustrates that the pure hydrogen train consumed 1,485 kg of hydrogen, and the hydrogen hybrid consumed 1,528 kilograms of hydrogen to complete the returned journey in 55.48 hours with one refuelling stop. However, the extended version of pure hydrogen and hydrogen hybrid trains consumed 1,516 kg and 1,559 kg of hydrogen to complete the return trip in approximately 55.76 hours without any refuelling stop. Table 14: 11 Wagons formation of retrofitted trains with one locomotive 11 Wagons formations with one locomotive Parameters Diesel Pure Hydrogen Hydrogen Hybrid Pure Hydrogen Extended Hydrogen Hybrid Extended Available Hydrogen (kg) - 890 890 3,913 3,913 Hydrogen Consumption (kg) - 1,485 1,528 1,516 1,559 Available Diesel (Litres) 6,700 - - - - Diesel Consumption (Litres) 9,362 - - - - Energy Consumption (kWh) 102,606 49,495 50,917 50,536 51,951 Journey Time (Hours) 55.50 55.48 55.48 55.76 55.77 Range (km) 1,716 1,438 1,398 6,194 6,025 Refuelling Required 1 1 1 0 0 Total Trips (Full Return) 0 0 0 2 2 Table 14 presents that the 15 wagons formation of pure hydrogen train consumed 1,768 kg of hydrogen to complete the returned journey in 57.76 hours with one refuelling stop. The hydrogen hybrid consumed 1,812 kilograms to complete the returned trip in 57.76 hours with two refuelling stops. However, the extended version of pure hydrogen and hydrogen hybrid trains consumed 1,806 kg and 1,852 kg of hydrogen to complete the return trip in approximately 58.03 hours without any refuelling stop. The energy consumption in Table 14 refers to the energy consumed by each train to complete the journey. 34 FINAL REPORT Table 15: 15 Wagons formation of retrofitted trains with one locomotive 15 Wagons formations with one locomotive Parameters Diesel Pure Hydrogen Hydrogen Hybrid Pure Hydrogen Extended Hydrogen Hybrid Extended Available Hydrogen (kg) - 890 890 3,913 3,913 Hydrogen Consumption (kg) - 1,768 1,812 1,806 1,852 Available Diesel (Litres) 6,700 - - - - Diesel Consumption (Litres) 11,132 - - - - Energy Consumption (kWh) 122,003 58,927 60,398 60,188 61,711 Journey Time (Hours) 57.78 57.76 57.76 58.03 58.03 Range (km) 1,445 1,208 1,179 5,200 5,072 Refuelling Required 1 1 2 0 0 Total Trips (Full Return) 0 0 0 2 2 Table 16 shows that the pure hydrogen train consumed 1,1807 kg of hydrogen, and the hydrogen hybrid consumed 1,867 kilograms of hydrogen to complete the returned journey in approximately 52.29 hours with one refuelling stop. However, the extended version of pure hydrogen and hydrogen hybrid trains consumed 1,865 kg and 1,925 kg of hydrogen to complete the return trip in 52.47 hours without any refuelling stop. Table 16: 11 Wagons formation of retrofitted trains with two locomotive 11 Wagons formations with two locomotives Parameters Diesel Pure Hydrogen Hydrogen Hybrid Pure Hydrogen Extended Hydrogen Hybrid Extended Available Hydrogen (kg) - 1,780 1,780 4,803 4,803 Hydrogen Consumption (kg) - 1,807 1,867 1,865 1,925 Available Diesel (Litres) 13,400 - - - - Diesel Consumption (Litres) 11,436 - - - - Energy Consumption (kWh) 125,337 60,222 62,211 62,161 64,172 Journey Time (Hours) 52.32 52.29 52.30 52.47 52.47 Range (km) 2,812 2,364 2,289 6,181 5,987 Refuelling Required 0 1 1 0 0 Total Trips (Full Return) 1 0 0 2 2 Table 16 illustrates that the pure hydrogen train consumed 2,127 kg of hydrogen, and the hydrogen hybrid consumed 2,194 kilograms of hydrogen to complete the returned journey in approximately 53.67 hours with one refuelling stop. However, the extended version of pure hydrogen and hydrogen hybrid trains consumed 2,179 kg and 2,245 kg of hydrogen to complete the return trip in 53.81 hours without any refuelling stop. 35 FINAL REPORT Table 17: 15 Wagons formation of retrofitted trains with two locomotive 15 Wagons formations with two locomotives Parameters Diesel Pure Hydrogen Hydrogen Hybrid Pure Hydrogen Extended Hydrogen Hybrid Extended Available Hydrogen (kg) - 1,780 1,780 4,803 4,803 Hydrogen Consumption (kg) - 2,127 2,194 2,179 2,245 Available Diesel (Litres) 13,400 - - - - Diesel Consumption (Litres) 13,441 - - - - Energy Consumption (kWh) 147,312 70,883 73,127 72,635 74,835 Journey Time (Hours) 53.67 53.65 53.66 53.81 53.81 Range (km) 2,393 2,009 1,947 5,289 5,134 Refuelling Required 1 1 1 0 0 Total Trips (Full Return) 0 0 0 2 2 2.3 Hydrogen Production & Refuelling strategies Each retrofitted locomotive can store about 890 kg of Hydrogen at 350 bar pressure. In dual locomotive formation, the total available Hydrogen is 1,780 kg. Simulation results indicate that the non-extended version trains required at least one refuelling stop at approximately 1,200 km distance to complete a return trip, except the hydrogen hybrid locomotive with 15 wagons which requires 1,812 kg of hydrogen to complete the return trip. Therefore, this version of the train will need two refuelling stops to complete the journey. In this case, the requirement of completion of the given return journey, a minimum of one refuelling station is required at each terminus station, i-e. Dar e Salaam and Kigoma. The hydrogen refuelling time is similar to its diesel counterpart refuelling time [61], therefore not affecting the current timetable of the current operation. The methods that can be used to produce hydrogen are given below. Steam Methan Refrormation (SMR): The energy required to produce hydrogen through SMR varies depending on several factors, including plant efficiency and the source of energy used. According to a study by the National Renewable Energy Laboratory (NREL), the energy required to produce one kg of hydrogen through SMR ranges from 45-60 kWh, depending on the efficiency of the plant and other factors [62]. Assuming the plant efficiency at 65% and an average energy requirement of 52.5 kWh/kg of hydrogen, we would need a total of 88.846 kWh of energy to produce 1100 kg of hydrogen through SMR. To calculate the amount of methane and water required. The balanced chemical equation for the SMR reaction is: CH4 + 2H2O -> CO2 + 4H2 From this equation, we can see that for every mole of methane (CH4) consumed, we need two moles of water (H2O) to produce four moles of hydrogen (H2) [63]. To produce 1100 kg of hydrogen with an assumed efficiency of 65%, we would require a total of 550 kg of methane, which is equivalent to 34.28 moles of methane. In addition, we would require 2200 l of water, which is equivalent to 122.09 moles of water. These values are calculated based on the stoichiometry of the SMR process, which requires 2 moles of water per mole of methane to produce 4 moles of hydrogen and 1 mole of CO2 [64]. . 36 FINAL REPORT Wind Power: To determine the power required from a wind turbine to produce 1100 kg of hydrogen daily, the efficiency of the wind turbine must be taken into account. If the wind turbine has an efficiency of 75%, then the power required can be calculated by dividing the energy required by the efficiency and the amount of time available. Using the calculated energy content of 1100 kg of hydrogen, the power required would be 77,733 kW, assuming 24 hours of operation [65]. Solar Farm: The energy required to produce 1 kg of hydrogen by electrolysis is approximately 53 kWh [66]. Therefore, the energy required to produce 1100 kg of hydrogen would be 58,300 kWh. Assuming that the sunlight is available for 6 hours per day [67], the solar power required would be 9,717 kW. To calculate the number of solar panels required, we need to consider the maximum output power of each panel. If the maximum output power of each solar panel is 425W at 21.4% efficiency, then the number of panels required would be 22,864 solar panels [68]. The efficiency of solar panels varies depending on the type of panel and environmental conditions. For Tanzania, the average solar irradiance is approximately 4.8 kWh/m2 /day. This value may vary depending on the location and time of year [69]. Electrolyser: In the case of the electrolyser, the production rate required to produce 1100 kg of hydrogen per day with an efficiency of 70% can be calculated using the molar mass of hydrogen, the efficiency of the electrolyser, and the desired daily production rate. Using the molar mass of hydrogen of 2.016 g/mol, the production rate required would be 778.7 nm3 /h [70]. Compressor: The type of compressor required to compress hydrogen to 350 bars depends on the inlet pressure, the flow rate, and the type of compressor. According to a study by Zou, J et al. (2020), a single-stage diaphragm compressor with a flow rate of 200 Nm³/h can compress hydrogen from 30 bar to 350 bar [71]. For simplicity, the highest required hydrogen for a return trip is considered for cost analysis. In this case, that is 2,194 kg hydrogen for 15 wagons formation with two locomotives. This results in a 1,100 kg of hydrogen requirement at each refuelling station. Currently, there is only one train per day service active on the route used in this case study. Therefore, two refuelling stations are enough to provide the required amount of hydrogen [72]. Table 18 presents the estimated costs and required quantity of equipment to develop a hydrogen refueling station. Table 18: Estimated costs of equipment required in production of hydrogen Parameters Unit Price (£) Quantity Total (£) Sources Wind Turbine (100 kW) 345,000 1 345,000 [73] Solar Panels (425W) 156 22,864 3,566,784 [74] Electrolyser (Proton Exchange Membrane) 7,000,000 2 14,000,000 [75] [76] [77] Compressor 50,000 1 50,000 [78] Hydrogen Storage 50,000 1 50,000 [79] Infrastruture Cost 1,100,000 1 1,100,000 [80] 37 FINAL REPORT Table 19 presents the estimated operational and maintenance costs of the equipment used in hydrogen refuelling stations, along with their service life. It is important to note that most of the costs could not be obtained through public channels and hence were estimated using the available sources. Table 19: Estimated costs of operation and maintenance wind turbine, solar farm and electrolyser Parameters Unit Price (£) Source Wind turbine O&M cost (£/kWh/yr) 0.02 [81] [82] Solar farm O&M Cost (£/panel/year) 9.5 [83] Electrolyzer O&M cost (£/kW/yr) 14.15 [81] [84] Water cost (£/m3) 0.82 [81] [82] Wind turbine service life (yrs) 20 [81] Electrolyzer service life (yrs) 10 [81] Solar Farm Service life (yrs) 25 [81] Table 20 displays the costs and quantities of the components necessary to convert a single diesel-electric locomotive into a hybrid hydrogen version, resulting in a total cost of around £1.8 million. The conversion costs for the primary components are shown in detail in Table 20 [85]. Table 20: Estimated costs for retrofitting the hydrogen hybrid locomotive Parameters Unit Price (£) Quantity Total (£) Hydrogen Fuel Cell 75,000 14 1,050,000 Battery 200,000 2 400,000 IGBT 20,000 6 120,000 Hydrogen Tanks 2,000 32 64,000 Pipework, Valves and Auxiliaries 5,000 8 40,000 Air Compressor 5,000 14 70,000 Fuel Cell Radiator 2,000 14 28,000 Conversion Cost 60,000 1 60,000 Total Conversion Cost per Locomotive 0 0 1,832,000 Procurement of hydrogen: Tanzania has significant potential for hydrogen production due to its abundant renewable energy sources such as solar, wind, and hydro. However, the procurement of hydrogen in Tanzania is still in its infancy, with limited infrastructure and production facilities in place. Another challenge is the high cost of hydrogen production and storage infrastructure. The procurement of hydrogen requires significant investment in the construction of production facilities, storage tanks, transportation, and refuelling stations. There is a need for public-private partnerships and foreign investment to fund the development of hydrogen infrastructure in Tanzania. 38 FINAL REPORT In conclusion, the procurement of hydrogen in Tanzania is still in the early stages, with several challenges that need to be addressed to promote its development. However, with the country's abundant renewable energy sources and growing interest in hydrogen as a clean energy source, there is significant potential for the growth of a hydrogen economy in Tanzania [86]. 2.4 Added hydrogens wagons In the extended version of hydrogen hybrid and pure hydrogen retrofitted trains, the formation carries an additional tanker which stores approximately 3,023 kg of Hydrogen at 350 bar pressure. Simulation results indicate that each formation of the extended version of the retrofitted train does not require refuelling during the return trip. The additional hydrogen tanker provides a maximum range of 6,181 km. With this range, two consecutive return trips can be made without refuelling. To analyse the trade-off between journey time and weight increase in 11 wagon formations with one locomotive, the extended version of the hydrogen hybrid train weight is increased by 4%; however, only a 0.5% increase is observed in journey time. Similarly, in 15 wagons formation with two locomotives, a 2.8% increase in weight is observed, resulting in only a 0.3% increase in time. The extra weight of the train is so low that it has a neglectable effect on journey time. The estimated cost of the tanker, including a custom-designed compressor and hydrogen delivery system, is approximately £7.5 million. While this represents a significant one-time investment, it could potentially be more cost-effective in the long run. It should be noted that this is a relatively new concept and has not been implemented on a large scale for railway transport, so there may be some inconsistencies in cost analysis and technology adoption. Further exploration of this option could be conducted in future research [87] [88]. 3. Overall Comparative analysis of all CONOPs Detailed information on retrofitting the current fleet, constructing a new refuelling station infrastructure, and the associated costs are presented in section 3. It is observed in section three results that there is a slight reduction in the overall weight of the retrofitted locomotive compared to its diesel counterpart, which significantly reduces fuel consumption. Similarly, the 11 and 15-wagon formation with one locomotive consumes less hydrogen due to low traction power resulting in longer journey time. Compared to one locomotive version, the 11 and 15-wagon formation with two locomotives consumes approximately 22% more hydrogen while reducing the journey time by about 7%. The selection of hydrogen hybrid train or pure hydrogen train formation is exclusively based on the type of operation. On the contrary, the extended version of the retrofitted train that carries an additional hydrogen tanker significantly reduces the need for multiple refuelling stops at any point. The results from section 3 indicate that an extended version of a hydrogen hybrid train in both 11 and 15 wagons formations with one locomotive increases the range of the train by 330%, and two locomotives version increases the range of the train by 162%. In both formations, the train can complete 2 round trips without refuelling. It was estimated that converting a single diesel-electric locomotive to a hybrid hydrogen train would cost approximately £1.8 million. The additional tanker that will be used with an extended version of the retrofitted train could cost up to £7.5 million [87] [88] . The tank carries a hefty price tag because it is made of composite material up to the standard where it withstands 350 bars of pressure. The price also includes a compressor and hydrogen delivery system to the fuel cells installed onboard the locomotive. 4. Pathways for decarbonising an existing railway in low-income countries in SSA The existing railway industry of LICs is very complex; therefore, each component of the railway industry, i-e. Rail networks, train operating companies etc., should develop a delivery plan for decarbonisation. The decarbonisation plan should include the following: • An appropriate mix of zero-carbon traction technologies currently exists in the form of battery, hydrogen and electrification. • Includes a long-term target and outlines how this will be delivered through public or private procurement and specification. 39 FINAL REPORT • Allowing the railway industry to maximise its ability to innovate and deliver against the agreed target most cost-effectively. Currently, electric trains are considered the sole substitute for diesel that can operate freight or high-speed passenger services with zero carbon emissions. However, electrification can be complicated and costly, requiring significant upgrades to networks that were not originally designed for such infrastructure. In some cases, the long-term benefits of electrification may not outweigh the investment cost and disruption caused by engineering work. Therefore, finding a balance between cost, customer benefit, and achieving zero carbon emissions is challenging. This is where other green traction technologies can serve as alternatives to diesel.. Rail electrification can certainly be a significant investment, involving substantial upfront costs for the installation of the necessary infrastructure, such as overhead electrification cables and substations. However, electric battery systems and hydrogen fuel cell systems have the potential to provide effective alternatives for decarbonising rail transport without the same level of upfront costs. Developing a hydrogen supply network and hydrogen train technology is likely to require a significant investment. However, such a supply network is not limited to fuelling trains as hydrogen can be used to decarbonise other sectors of the economy and, therefore, may contribute to the economies of scale to give LICs a competitive advantage in developing a new global industry. To compare the cost of hydrogen fuel cell systems for rail transport with full-scale electrification, a case study was conducted by the International Energy Agency (IEA) in 2020 for the United Kingdom rail network. The study found that the cost of hydrogen fuel cell systems is generally higher than full-scale electrification for both upfront investment and operating costs [89]. For example, the study estimated that the cost of electrification for the UK rail network would be £19-24 billion, while the cost of hydrogen fuel cell systems would be £32-45 billion. In terms of operating costs, the study estimated that hydrogen fuel cell systems would be more expensive than electrification, with a cost of £0.16- £0.21 per passenger-kilometer for hydrogen fuel cell systems compared to £0.12-£0.14 per passengerkilometer for electrification [90] [91]. However, it is worth noting that the cost of hydrogen fuel cell systems for rail transport is highly dependent on various factors such as the cost of hydrogen production and infrastructure development. Moreover, hydrogen fuel cell systems have the advantage of being more flexible and suitable for non-electrified lines or in cases where electrification is not feasible. Table 21 presents a brief comparison of various technologies that can be used in the decarbonisation of the railway industry with its pros and cons. Table 21: Pros and Cons of the different forms of traction systems Technology Pros Cons Electric Train (Electrification) Given that electricity is produced by renewable energy sources, electric trains are the only alternative to diesel traction that can run both fright and passenger services at high speed with zero carbon emissions. Electrification is expensive. Electric trains are quicker, lighter and quieter compared to their diesel counterparts. Because trains rely on overhead line electrification, power outages and mechanical problems can occur. Passengers may be inconvenienced. 40 FINAL REPORT The process of electrifying train lines has the potential to generate a significant carbon footprint, which should be counterbalanced by implementing carbon-saving measures. Battery (Battery Powered Train) Batteries have the flexibility to be charged from a variety of sources, such as overhead wires or hydrogen fuel cells. Longer distance journeys on battery-powered trains are not (yet) feasible. It is possible to retrofit batteries into existing diesel rolling stock, eliminating the need for new rolling stock. The rising demand for batteries due to decarbonization initiatives is a cause for concern, as it could lead to an increase in battery costs. Trains powered by batteries have the flexibility to operate on both electrified and non-electrified rail networks. Hydrogen (Hydrogen-Powered Train) Similar to battery power, hydrogen trains can be used on a combination of electrified and non-electrified lines There are challenges in transporting and storing the fuel. Passengers benefit from hydrogen trains because they are quieter than diesel trains and more resilient to network-wide disruption compared to electric trains. At present, there is an absence of a hydrogen economy as the existing hydrogen production plants do not have sufficient capacity to support the transportation sector. Therefore, the development of production facilities and a midstream supply chain is necessary. Good-quality diesel rolling stock can be retrofitted with hydrogen fuel technology, making the purchase of new rolling stock unnecessary. To make hydrogen-powered trains a viable option, the availability of hydrogen infrastructure will need to be widespread throughout the network, including at depots and stations. Hydrogen-based trains might be a feasible solution for shorter branch lines or railways where electrification may be difficult. 41 FINAL REPORT In summary, electric trains have been widely accepted as a reliable and eco-friendly option for decarbonizing the railway industry. However, electrifying train lines requires a significant upfront investment and may face technical, regulatory, and logistical challenges, which may affect its feasibility. In such cases, battery-powered or hydrogen-powered trains offer a promising alternative for non-electrified railways. These technologies have their own limitations, such as the availability of charging infrastructure, range, and cost. Batterypowered trains, for example, may not be suitable for longer journeys due to their limited range and the need for frequent recharging. On the other hand, hydrogen-powered trains require significant infrastructure development for hydrogen production, storage, and distribution. Therefore, it is essential to consider all the factors involved in each technology, including their benefits and limitations, to determine the most appropriate and cost-effective decarbonization solution for the railway industry. Policymakers, industry leaders, and other stakeholders need to work together to identify and address the challenges associated with these technologies, such as infrastructure development, financing, and regulatory frameworks. By doing so, they can facilitate the adoption of the most appropriate decarbonization solutions and contribute to a more sustainable future for the railway industry. 42 FINAL REPORT SECTION 6: CONCLUSION AND FURTHER STEPS The project was set up to assess the feasibility and viability of introducing alternative traction systems to railways in low-income countries in Sub-Saharan Africa. To do so, a sequence of activities based on modelling and simulation tools progressed from the conceptual analysis of capability requirements to the tangible concepts of operations for retrofitting existing railway assets to hydrogen-based systems. Within the defined scope, we engaged with key stakeholders in the region to identify four main case studies that were representative of the services encountered in Sub-Saharan Africa. Building on their inputs, the four case studies were: 1. Kampala – Namanve – UGANDA – Commuter line 2. Buchanan – Tokadeh – LIBERIA – Heavy haul freight 3. Dar es Salaam – Kigoma – TANZANIA – Mixed use long distance 4. Abuja – Kaduna – NIGERIA – Medium distance passenger Our Single Train Simulator (STS) tool was made available to practitioners and used against those case studies to measure the power and energy requirements of each line. From those, it was observed that alternative traction systems would help reduce overall emissions when compared to existing combustion engines, even if the production of hydrogen was not entirely green. However, the exception was found in the heavy haul case study where alternative traction systems are still behind the performance required to deliver the necessary capabilities. From there, the three remaining case studies were examined through a volumetric lens that analysed the physical properties of the configurations used in each line. Data was found to be lacking, so representative locomotives were assumed to measure whether it would be possible to fit the necessary amount of hydrogen within existing assets. For the medium and long-distance services, results showed that more volume and more weight would be required to deliver the same capabilities under the existing concept of operations. As a result, the retrofitting analysis focused on the most representative case study (Tanzania) to examine ways in which alternative traction systems could replace existing diesel locomotives. For that, two concepts of operations were devised, either including refuelling stops on the line, or adding range extender tankers to the consists. While the latter proved to provide considerable extra range, the costly design and materials would make the solution more prohibitive than a refuelling station when their lifecycles are taken into consideration. Nonetheless, we anticipate both solutions as worthy of further evaluation. The scope of the project was limited to the technical analysis of traction systems and therefore more detailed cost-benefit analyses should be pursued. There are important idiosyncrasies in African railway lines in the form of gauge, standards, and age of asses. Similarly there are distinct levels of renewable power generation that justify dedicated studies, which were compiled in the Capability Analysis report. For instance, over 50% in Uganda and less that 12% in Nigeria. The project was set to deliver a general analysis of potential use and implementation of zero-carbon traction systems in LICs in Sub-Saharan Africa. This was achieved with the use of simulation tools and other methods, taking into account the uncertainty raised by missing and/or fragmented data. It is believed that the project fulfilled its initial aims. Our pre-feasibility study showed that there is potential for conversion of existing locomotives in Sub-Saharan Africa that can support the decarbonisation of the railway network in several instances. Moreover, showing the potential existing lines can add important points to the ongoing discussion between rehabilitation of legacy lines and the construction of Standard Gauge (SGR) lines. Even at this stage, the project has raised substantial interest from industry, meaning that it holds very high research uptake potential. The Short Course on Railway Decarbonisation opened a number of streams for collaborations with railway stakeholders in Sub-Saharan Africa. It has also mobilised conversations with African development organisations. Further research should build on this pre-feasibility study and elaborate more detailed analyses on specific lines, using detailed blueprints of locomotives at feasibility leve. The team is now holding conversations with the Tanzanian Railway Corporations and TransNamib to conduct specific simulation and analysis work on their lines. 43 FINAL REPORT 44 FINAL REPORT SECTION 7: DISSEMINATION ACTIVITIES The project prioritised dissemination activities to ensure appropriate awareness and research uptake were achieved from the activities taken. These activities comprised key stakeholder workshops and steering board meetings, conference presentations, and a dedicated short course. Inevitably, the dissemination plan initially set required forced adjustments due to the disruptions caused by the Covid-19 global pandemic. All efforts were made to maintain the plan unaltered, but some changes were unavoidable, such as conferences that were cancelled and or activities that were prevented due to travel restrictions. Table 22. Review of project dissemination activities Planned date Type Planned activity Resulting activity Commentary Dec/2020 Webpage Official project webpage Completed Dec/2020 Flyer Digital project flyer Flyer sent Jan/2021 Workshop Key stakeholder workshop Workshop delivered Jan/2021 Newsletter Project updates Delivered March/2021 Press release Tool to calculate general traction requirements Delivered October/2021 Press release Traction systems architecture report Delivered October/2021 Conference Presentation at Africa Rail conference Delivered Online due to travel restrictions February/2022 Press release Prototype model dissemination Amended Prototype model changed for virtual model delivery March/2022 Magazine article Sector leading publication Delivered Published on Electric & Hybrid Rail Technology magazine March/2022 Academic paper High impact journal In progress The project team is finalising a draft publication April/2022 Press release Retrofitting reports Not achieved Changes in project timeline meant that this activity would overlay with the delivery of the short course June/2022 Conference Presentation at World Congress of Railway Research Achieved Stuart Hillmansen chaired two sessions on the topic of railway decarbonisation 45 FINAL REPORT July/2022 Conference Presentation at Africa Rail 2022 Not achieved Event postponed to July/2023 September/2022 Conference Presentation at Transport Evolution Africa Achieved Invitation extended to present at 2023 edition Workshops Two workshops were held in 2021. The first workshop was held in January, where key stakeholders helped the team choose appropriate and relevant case studies. A steering board meeting was held in May, where selected experts joined the project as advisors to review our current progress and provided recommendations on the scientific work. Attendance to both was recorded, and listed on Tables 23 and 24. Table 23. Attendance list of key stakeholder workshop in January 2021 Organisation represented Country Gender Nigerian Ministry of Transportation Nigeria M Rwanda Transport Development Agency Rwanda M Managing Director - Uganda Railways Uganda M COWI Uganda Uganda F Rail Working Group Switzerland M Ethiopian Railways Corporation Ethiopia M Ethiopian Railways Corporation Ethiopia M Ethio-Djubouti Railway Corp Ethiopia M Ethio-Djubouti Railway Corp Ethiopia M Uganda Railway Corporation Uganda M Table 24. Attendance list of steering board meeting in May 2021 Organisation represented Country Gender Ethiopian Railways Corporation Ethiopia M Rwanda Transport Development Agency Rwanda M Rwanda Ministry of Infrastructure Rwanda M Rail Working Group Switzerland M Michigan State University USA M Railway Industry Association UK M 46 FINAL REPORT Conferences The team was invited to present outputs at four conferences: Transport Evolution Africa 2021 – Peter Amor presented virtually Transport Evolution Africa 2022 – Dr Marcelo Blumenfeld presented in person InnoTrans 2022 – Prof Stuart Hillmansen presented in person COP27 – Prof Clive Roberts presented in person Short course on railway decarbonisation The most important activity in the dissemination endeavours of the project culminated in the development and delivery of a Short Course on Railway Decarbonisation. Invitations were sent online, reaching uses through social platforms. Flyers were also handed two conferences (InnoTrans and Transport Evolution Africa) to invite applications (Figure 11). Figure 11. Flyer for Short Course on Railway Decarbonisation A total of 82 applications were received, and 40 railway stakeholders from 15 countries were selected to join the course in Dar es Salaam, Tanzania. The course takes place between the 28th November 2022 and 2nd December 2022 and covers the technical aspects of railway dercabonisation. Interim photos on Figure 11 and list of participants on Table 21. 47 FINAL REPORT Figure 12. Photos from the Short Course on Railway Decarbonisation Table 25. List of participants of the Short Course on Railway Decarbonisation Role Gender Country Organisation represented Policy Analysis and Advocacy - Junior Officer Male Cameroon SLOCAT Partnership on Sustainable Low Carbon Transport Rolling Stock Maintenance Engineer Male DRC Addis Ababa Light Rail SHEQ Manager Male Eswatini Eswatini Railways Traction manager Male Eswatini Eswatini Railways Chief Safety Officer Male Ethiopia Ethio-Djibouti Railways Chief of Staff Male Ethiopia Ethio-Djibouti Railways Lead Safety Expert Male Ethiopia Ethio-Djibouti Railways Chief Operations Officer Male Ethiopia Ethio-Djibouti Railways Construction planning dispatcher Female Ethiopia Ethio-Djibouti Railways Engineer Male Ghana Ministry of Railway Development Regional Civil Engineer - Infrastructure Male Kenya Kenya Railways Corporation Technical Officer Male Kenya Ministry of Transport Senior Environment Officer Female Kenya Kenya Railways Corporation MSc student Female Kenya University of Nairobi Head Of Operations Male Malawi Netic Trading Senior Engineer: R&D Male Namibia TransNamib Lecturer in Railway Management Male Nigeria Redeemer's University Lecturer in Railway Management Male Nigeria Redeemer's University Structural Engineer Female Rwanda Rwanda Housing Authority PhD candidate Female Uganda Lund University Corporate Planning Male Uganda Uganda Railways Corporation (URC) Planning officer Female Uganda Uganda Railways Corporation (URC) Civil Engineer Male Uganda State House- Kampala Head of safety management system cell Male Senegal Grands Train of Senegal ( GTS - SA) Technical Director Male Senegal Grands Train of Senegal ( GTS - SA) General Manager Male Sudan Sudan Railways Corporation Deputy General Manager for Infrastructure Male Sudan Sudan Railways Corporation Senior Civil Engineer Female Sudan Sudan Railways Corporation Senior Electrical Engineer Female Sudan Sudan Railways Corporation 48 FINAL REPORT Principal registration and licensing officer Male Tanzania Land Transport Regulatory Authority (LATRA) Safety manager Male Tanzania Tanzania Zambia Railway Authority ( TAZARA ) Senior Mechanical Engineer Male Tanzania Tanzania Zambia Railway Authority ( TAZARA ) Civil Engineer Female Tanzania Tanzania Railways Corporation Electrical engineer Male Tanzania Tanzania Railways Corporation Commercial officer Female Tanzania Tanzania Railways Corporation Senior Transport Officer Male Tanzania Tanzania Railways Corporation Director of Railway Regulation Male Tanzania Land Transport Regulatory Authority ( LATRA ) Senior Railway Safety Inspector Male Tanzania Land Transport Regulatory Authority ( LATRA ) Engineering Superintendent - Signals and Telecommunications Male Zambia Zambia Railways Limited Engineer Signals & Telecommunication Male Zambia Zambia Railways Limited SECTION 8: REFERENCES [1] African Development Bank, “Rail Infrastructure in Africa: Financing Policy Options,” African Development Bank, Abidjan, 2015. [2] M. Blumenfeld, “Exploring the potential synergies between railway electrification and grid expansion,” in Electromobility and Renewable Electricity: Developing Infrastructure for Synergies, Washington, D.C., Sum4ALL, 2022. [3] Economic Times, “Railways to spend Rs 12,134 crore over three years to achieve 100% electrification,” [Online]. Available: https://energy.economictimes.indiatimes.com/news/power/railways-to-spend-rs12134-crore-over-three-years-to-achieve-100-electrification/67299220. [Accessed 2020 12 21]. [4] Railway Industry Association, “RIA Electrification Cost Challenge,” [Online]. Available: https://www.nsar.co.uk/wp-content/uploads/2019/03/RIAECC.pdf. [Accessed 2020 12 22]. [5] World Bank, “Access to electricity (% population),” [Online]. Available: https://data.worldbank.org/indicator/EG.ELC.ACCS.ZS. [Accessed 2020 12 20]. [6] D. Shirres, “Could hydrogen trains be the future of rail?,” [Online]. Available: https://www.imeche.org/news/news-article/could-hydrogen-trains-be-the-future-of-rail. [Accessed 20 12 2020]. [7] United Nations Department Of Economic and Social Affairs Statistics Division, “Standard country or area codes for statistical use,” United Nations, New York, 1999. [8] J. Shvili, “Sub-Saharan Africa,” World Atlas, 28 10 2021. [Online]. Available: https://www.worldatlas.com/regions/sub-saharan-africa.html. [Accessed 05 01 2023]. [9] World Bank, “World Bank country and lending groups,” 01 01 2021. [Online]. Available: https://datahelpdesk.worldbank.org/knowledgebase/articles/906519-world-bank-country-andlending-groups. [Accessed 01 02 2021]. 49 FINAL REPORT [10] United Nations Development Programme, “Latest Human Development Index Ranking,” [Online]. Available: http://hdr.undp.org/en/content/latest-human-development-index-ranking. [Accessed 01 02 2021]. [11] M. Blumenfeld, W. Wemakor, L. Azzouz and C. Roberts, “Developing a New Technical Strategy for Rail Infrastructure in Low-Income Countries in Sub-Saharan Africa and South Asia,” Sustainable High Volume Road and Rail Transport in Low Income Countries); MDPI, vol. 11, no. 16, 2019. [12] R. Bullock, “Off track: SSA railways,” World Bank, Washington, D.C., 2009. [13] V. N. Olievschi, “Railway transport: framework for improving railway sector performance in SSA,” World Bank, Washington, D.C., 2013. [14] M. Blumenfeld, W. Wemakor, L. Azzouz and C. Roberts, “Developing a New Technical Strategy for Rail Infrastructure in Low-Income Countries in Sub-Saharan Africa and South Asia,” Sustainability, vol. 11, no. 16, 2019. [15] African Development Bank, “Rail infrastructure in Africa: financing policy options,” African Development Bank, Abidjan, 2015. [16] World Bank, “Africa Infrastructure: Railways,” 31 12 2009. [Online]. Available: https://databank.worldbank.org/source/africa-infrastructure:-railways. [Accessed 01 02 2020]. [17] Bollore Logistics, “Registration document,” Bollore, Paris, 2018. [18] International Union of Railways, “RAIL-ISA UIC Statistics,” 2020. [Online]. Available: https://uicstats.uic.org/. [Accessed 15 01 2020]. [19] ArcelorMittal, “Sustainability Report 2017,” ArcelorMittal, Buchanan, 2017. [20] MADARAIL, “A propos de Madarail,” [Online]. Available: http://www.madarail.mg/a_propos_activites.php. [Accessed 09 02 2021]. [21] Government of Malawi, “Statistical Yearbook 2021,” National Statistical Office, Lilongwe, 2021. [22] National Bureau of Statistics, “Rail Transportation Data 2021,” National Bureau of Statistics, Abuja, 2022. [23] Ministry of Works and Transport, “Transport and meteorology sector statistics,” Ministry of Works and Transport, Dodoma, 2019. [24] Caminhos de Ferro de Mozambique, “Annual Statistical Information 2021,” Caminhos de Ferro de Mozambique, Maputo, 2021. [25] Uganda Bureau of Statistics, “Statistical Abstract 2021,” Uganda Bureau of Statistics, Kampala, 2021. [26] World Bank, “Railways, goods transported, tonne-km,” [Online]. Available: https://data.worldbank.org/indicator/IS.RRS.GOOD.MT.K6. [Accessed 03 02 2023]. 50 FINAL REPORT [27] World Bank, “The economics of Rail Gauge on the East African Commmunity,” World Bank, Washington, DC, 2013. [28] S. Oirere, “Kenyan court quashes mandatory use of SGR for freight,” 25 November 2020. [Online]. Available: https://www.railjournal.com/africa/kenyan-court-quashes-mandatory-use-of-sgr-forfreight/. [Accessed 12 July 2021]. [29] G. A. Gallopin, A. Hammond, P. Raskin and R. Swart, “Branch points: global scenarios and human choice,” Stockholm Environment Institute, Stockholm, 1997. [30] C. Roberts, S. Hillmansen and M. Blumenfeld, “TRAFFIC VOLUME REPORT - Novel traction systems,” HIgh Volume Transport, Birmingham, 2021. [31] African Union, “Agenda 2063: The Africa We Want,” African Union, Addis Ababa, 2013. [32] CPCS, “Detailed Scoping Study (DSS) for Vision 2063 Africa Integrated High Speed Railway Network and Masterplan,” CPCS, Ottawa, 2019. [33] C. Calvert, N. Zhao and P. Amor, “SIMULATION REPORT - Novel traction systems for sustainable railway futures in LICs,” High Volume Transport, Birmingham, 2021. [34] T. Din and S. Hillmansen, “Energy consumption and carbon dioxide emissions analysis for a concept design of a hydrogen hybrid railway vehicle,” IET Electrical Systems in Transportation, vol. 1`, p. 10, 2017. [35] C. Calvert, “CAPABILITY ANALYSIS REPORT,” High Volume Transport Applied Research, Birmingham, 2022. [36] Rail Insider, “Urban Very Light Rail gets powerful new innovation,” 25 07 2022. [Online]. Available: https://railinsider.co.uk/2022/07/25/urban-very-light-rail-gets-powerful-new-innovation/. [Accessed 03 02 2023]. [37] Uganda Railways Corporation, “Schedules,” [Online]. Available: https://urc.go.ug/schedules. [Accessed 03 02 2023]. [38] Tanzania Railways Corporation, “Long Distance Train,” [Online]. Available: https://www.trc.co.tz/pages/long-distance-train. [Accessed 03 02 2023]. [39] Munzungu, “On the right track : My first Ugandan train ride,” 13 12 2015. [Online]. Available: https://www.muzungubloguganda.com/adventure/rift-valley-railways-kampala-train/. [Accessed 1 08 2022]. [40] RailSistem, “Liberian Railway Could Carry Iron Ore From Guinea,” 06 05 2019. [Online]. Available: https://en.railsistem.com/2019/05/06/liberian-railway-could-carry-iron-ore-from-guinea/. [Accessed 1 08 2022]. [41] Geo Parks, “Tanzania Revives Northbound Train Journeys, Cashing On Christmas Holidays Season,” 06 11 2021. [Online]. Available: https://geoparks.taifatanzania.com/dar-arusha-train-journeys-revivedagain-for-christmas/. [Accessed 01 08 2022]. 51 FINAL REPORT [42] Sinfin, “Railways in Nigeria,” Not Dated. [Online]. Available: https://www.sinfin.net/railways/world/nigeria.html. [Accessed 23 02 2023]. [43] URC, “Passenger Services,” Uganda Railways Corporation, Not Dated. [Online]. Available: http://urc.go.ug/services/passenger-services. [Accessed 07 01 2023]. [44] H. Mbabazi, “Uganda Railways Resumes Commuter Train Services In Kampala,” 09 08 2021. [Online]. Available: https://thecapitaltimes.co.ug/2021/08/09/uganda-railways-resumes-commuter-trainservices-in-kampala/. [Accessed 07 01 2023]. [45] J. Ivy, “Summary of Electrolytic Hydrogen Production: Milestone Completion Report,” National Renewable Energy Lab., Golden, CO (US), vol. 1, p. 27, 2004. [46] Action of Sustainability, “Converting Fuel to kWh and CO2e,” 11 2010. [Online]. Available: https://travelifestaybetter.com/wp-content/uploads/2019/02/17-Fuel-Conversion-Rates-to-kWh-andCO2e.pdf. [Accessed 03 01 2023]. [47] Madenge, “Central Line (Tanganyika Railway) – History, Traffic,” The United Repulic of Tanzania, 17 10 2021. [Online]. Available: https://unitedrepublicoftanzania.com/economy-of-tanzania/infrastructurein-tanzania/railway-in-tanzania/central-line-tanganyika-railway-history-traffic/. [Accessed 07 01 2023]. [48] Robert Coleman, “GT22 Co-Co Narrow Gauge Diesel Electric Locomotives for Sale,” RAIL ENGINEERING SOLUTIONS LLC, Not Dated. [Online]. Available: https://www.locomotives-for-sale.com/RollingStock/Locomotives-Multiple-Units/Co-Co-Diesel-Electric-GT22C-Locomotives-For-Sale/. [Accessed 07 01 2023]. [49] Rail Engineering Solutions LLC, “GT22 Co-Co Narrow Gauge Diesel Electric Locomotives for Sale,” 2022. [Online]. Available: https://www.locomotives-for-sale.com/Rolling-Stock/Locomotives-MultipleUnits/Co-Co-Diesel-Electric-GT22C-Locomotives-For-Sale/. [Accessed 23 2 2023]. [50] Unknown, “Abuja-Kaduna Rail Line,” Railway Technology, 20 01 2020. [Online]. Available: https://www.railway-technology.com/projects/abuja-kaduna-rail-line/. [Accessed 07 01 2023]. [51] J.-D. BACHAND, “General Electric U26C,” 11 11 2007. [Online]. Available: https://www.thedieselshop.us/Data%20U26C.HTML. [Accessed 07 01 2023]. [52] AE, “TANZANIA TESTS ELECTRIC TRAIN ON NEW SGR LINE, HITS 160 KM/H TOP SPEED,” AE Africa Equity Media, 06 06 2022. [Online]. Available: https://africaequity.net/tanzania-electric-train-test-on-newsgr-line-hits-160km-h-top-speed/. [Accessed 14 01 2023]. [53] ATQnews, “Africa: Tanzania new Standard gauge Railway with speed of 160kmh is expected to be the best in Africa when it opens in 2019,” atqnews.com, 13 02 2018. [Online]. Available: https://atqnews.com/tanzania-new-standard-gauge-railway/. [Accessed 14 01 2023]. [54] Tanzania Invest, “SGR Tanzania Standard Gauge Railway,” Tanzaniainvest, 22 12 2022. [Online]. Available: tanzaniainvest.com/sgr. [Accessed 10 01 2023]. [55] T. R. Carporation, “Environmental and Social Management and Monitoring Plan,” August 2019. [Online]. Available: https://yapimerkezi.com.tr/PdfDosyalari/937ee522-ccda-4185-9794- 1543e1551085.pdf. 52 FINAL REPORT [56] H. Nachilongo, “The Citizen,” Epaper, April 2022. [Online]. Available: https://www.thecitizen.co.tz/tanzania/news/national/tanzania-s-sgr-to-start-operations-by-end-ofapril-2022-3779770. [Accessed 02 November 2022]. [57] TAZARA, “Types of Freight and Vehicles,” TANZANIA-ZAMBIA RAILWAY AUTHORITY, N.D. [Online]. Available: https://tazarasite.com/types-freight-and-vehicles. [Accessed 02 November 2022]. [58] R. Technology, “Rail Target,” Hyundai Rotem wins contract to deliver train cars to Tanzania, 07 07 2021. [Online]. Available: https://www.railway-technology.com/news/hyundai-rotem-tanzania/. [Accessed 02 November 2022]. [59] H. Mhagama, “Tanzania: TRC Receives 44 Freight Wagons for Central Line,” Tanzania Daily News (Dar es Salaam), 7 10 2021. [Online]. Available: https://allafrica.com/stories/202110070379.html. [Accessed 02 November 2022]. [60] Knowledge Base, “COMPRESSED GASEOUS HYDROGEN ON 350 BAR,” Fuel Cell Electric Busses Knowledge Base, Not Dated. [Online]. Available: https://www.fuelcellbuses.eu/wiki/fuelling-hydrogenbuses-hydrogen-refueling-station/compressed-gaseous-hydrogen-350-bar. [Accessed 14 01 2023]. [61] J. Sampson, “Hydrogen refuelling stations: explained,” H2 View, 21 12 2020. [Online]. Available: https://www.h2-view.com/story/hydrogen-refuelling-stations-explained/. [Accessed 14 01 2023]. [62] C. S. M. a. J. B. Bierschenk, “Energy Requirements for Hydrogen Gas Production," National Renewable Energy Laboratory,” Technical Report NREL/TP-570-27719, 2000. [63] A. E. L. Adam P. Simpson, “Exergy analysis of hydrogen production via steam methane reforming,” International Journal of Hydrogen Production, vol. 32, no. 18, pp. 4811-4820, 2007. [64] ,. Q. S. Z. J. S. G. A. S. Luning Chen, “Catalytic Hydrogen Production from Methane: A Review on Recent Progress and Prospect,” Nanocatalysts for Hydrogen Production, vol. 10, no. 8, 2020. [65] M. S. M. M. A. M. Mostafa Rezaei, “Investigation of the socio-economic feasibility of installing wind turbines to produce hydrogen: Case study,” International Journal of Hydrogen Energy, vol. 43, no. 52, pp. 23135-23147, 2018. [66] Short-fact, “How much energy does it take to produce 1kg of hydrogen?,” 21 02 2021. [Online]. Available: https://short-fact.com/how-much-energy-does-it-take-to-produce-1kg-of-hydrogen/. [Accessed 24 02 2023]. [67] SmartSolar Tanzania, “Solar Power Potential Tanzania,” 01 08 2018. [Online]. Available: http://www.smartsolar-tanzania.com/solar-sector-information/solar-power-potential-tanzania/. [Accessed 24 02 2023]. [68] Solarsunever, “Original 600W 9BB Half Module Solar Panel Good Price Photovoltaic Single Crystal 600W Solar Panel,” 01 01 2023. [Online]. Available: https://www.solarsunever.com/original-600w-9bbhalf-module-solar-panel-good-price-photovoltaic-single-crystal-600w-solar-panel_p126.html. [Accessed 24 02 2023]. [69] A. C. D. A. Aboginije Ademilade, “The Application of ”Green Technology” In the Modern Day Construction Projects-A Review,” EasyChair preprints, 2020. 53 FINAL REPORT [70] D. L. F. J. M. D. S. Marcelo Carmo, “A comprehensive review on PEM water electrolysis,” International Journal of Hydrogen Energy, vol. 38, no. 12, pp. 4901-4934, 2013. [71] N. H. J. Y. Q. F. Y. W. Z. Z. J. F. L. Z. H. L. &. H. W. Jiexin Zou, “Electrochemical Compression Technologies for High-Pressure Hydrogen: Current Status, Challenges and Perspective,” Electrochemical Energy Reviews, vol. 3, pp. 690-729, 2020. [72] TRC, “Long Distance Train,” TANZANIA RAILWAYS CORPORATION, Not Dated. [Online]. Available: https://www.trc.co.tz/pages/long-distance-train. [Accessed 14 01 2023]. [73] Checkatrade, “Wind turbine cost guide,” 31 03 2022. [Online]. Available: https://www.checkatrade.com/blog/cost-guides/wind-turbine-cost/. [Accessed 24 02 2023]. [74] Midsummer, “Trina Vertex S 425W Black Framed Mono (white backsheet),” Trina, 01 10 2022. [Online]. Available: https://midsummerwholesale.co.uk/buy/trina/trina-425w. [Accessed 24 02 2023]. [75] IEA, “Renewable Energy Policies and Market Overview: Hydrogen,” International Energy Agency (IEA), 2021. [76] E. P. Yamini P, “Electrolyzers Market Outlook 2027,” Allied Market Research, 01 03 2021. [Online]. Available: https://www.alliedmarketresearch.com/electrolyzer-market-A10609. [Accessed 24 02 2023]. [77] NEL, “Containerized PEM Electrolyser,” Nel Hydrogen, 01 11 2022. [Online]. Available: https://nelhydrogen.com/product/m-series-containerized/. [Accessed 24 02 2023]. [78] Haskel, “Hydraulic compression skids for hydrogen filling,” 01 11 2022. [Online]. Available: https://www.haskel.com/en-gb/products/hydrogen-refuelling/hydrogen-compression-andtransfer/hydraulic-hydrogen-compression-skid. [Accessed 24 02 2023]. [79] Hexagon Purus, “Hexagon Purus AS - Type 4 Composite Pressure Vessel,” Hydrogen fuel storage systems, 01 11 2022. [Online]. Available: https://hexagonpurus.com/our-solutions/hydrogensystems/fuel-storage-systems. [Accessed 24 02 2023]. [80] M. M. Mariya Koleva, “Hydrogen Fueling Stations Cost,” 11 02 2020. [Online]. Available: https://www.hydrogen.energy.gov/pdfs/21002-hydrogen-fueling-station-cost.pdf. [Accessed 02 November 2022]. [81] J. M. A. K. Babatunde Olateju, “Large scale hydrogen production from wind energy for the upgrading,” Applied Energy, vol. 118, pp. 48-56, 2014. [82] A. K. Babatunde Olateju, “Hydrogen production from wind energy in Western Canada for upgrading bitumen from oil sands,” Energy, vol. 36, no. 11, pp. 6326-6339, 2011. [83] Check Trade, “https://www.checkatrade.com/blog/cost-guides/solar-panel-maintenance-cost/,” Solar panel maintenance cost guide, 04 10 2022. [Online]. Available: https://www.checkatrade.com/blog/cost-guides/solar-panel-maintenance-cost/. [Accessed 24 02 2023]. [84] B. O, “Renewable Hydrogen from Wind in California,” National Hydrogen Association Proceddings, 2005. 54 FINAL REPORT [85] S. H. Tajud Din, “Energy consumption and carbon dioxide emissions analysis for a concept design of a hydrogen hybrid railway vehicle,” IET, vol. 8, no. 2, pp. 112-121, 2018. [86] IEA, “The Future of Hydrogen: Seizing Today’s Opportunities,” International Energy Agency, 2020. [87] C. Driver, “Truck Net Uk,” Liquid Hydrogen Tanker, 08 November 2013. [Online]. Available: https://www.trucknetuk.com/phpBB/gallery/image_page.php?album_id=996&image_id=4313. [Accessed 02 November 2022]. [88] J. M. Group, “Alibaba,” Energy-saving reliable stable and professional cng gas compressor, 2022. [Online]. Available: https://www.alibaba.com/product-detail/Energy-saving-reliable-stable-andprofessional_1600479449856.html?spm=a2700.shop_plgr.41413.3.208f2b9aUs2kZt. [Accessed 02 November 2022]. [89] IEA, “The Future of Rail 2050,” International Energy Agency, 2020. [90] Railway Technology, “Electrification cheaper than hydrogen for UK rail decarbonisation, says IEA,” 17 11 2020. [Online]. Available: https://www.railway-technology.com/news/electrification-cheaper-thanhydrogen-for-uk-rail-decarbonisation-says-iea/. [Accessed 24 02 2023]. [91] IEA, “Electrification,” IEA, Paris, 2022. [92] BBC, “Next stop, hydrogen-powered trains,” 27 02 2020. [Online]. Available: https://www.bbc.com/future/article/20200227-how-hydrogen-powered-trains-can-tackle-climatechange. [Accessed 16 12 2020]. [93] Railway Technology, “HydroFLEX hydrogen train,” [Online]. Available: https://www.railwaytechnology.com/projects/hydroflex-hydrogen-train/. [Accessed 19 12 2020]. [94] T. Burridge, “All aboard Britain’s first hydrogen train,” 20 06 2019. [Online]. Available: https://www.bbc.co.uk/news/business-48698532. [Accessed 16 12 2020]. [95] D. Briginshaw, “Report confirms Britain can meet 2040 diesel-free-train target,” 22 07 2019. [Online]. Available: https://www.railjournal.com/policy/britain-can-meet-2040-diesel-free-train-%20target/. [Accessed 17 12 2020]. [96] N. Pocard, “Zero Emission Fuel Cells,” Ballard, 11 February 2022. [Online]. Available: https://blog.ballard.com/fuel-cell-price-drop. [Accessed 02 November 2022]. [97] E. G. UK, “Energy Guide,” Solar Panel Costs Calculator UK Guide, November 2022. [Online]. Available: https://energyguide.org.uk/solar-panel-costs-calculator/. [Accessed 05 November 2022]. [98] H. K. Kantola, “Cost of Hydrogen Fueling Infrastructure,” Hydrogen Cars Now, 03 07 2088. [Online]. Available: https://www.hydrogencarsnow.com/index.php/infrastructure/cost-of-hydrogen-fuelinginfrastructure/. [Accessed 02 November 2022]. [99] H. S. Maps, “COSTS AND FINANCING,” Hydrogen Fuel Cell Partnership, N.D.. [Online]. Available: https://h2stationmaps.com/costs-and-financing. [Accessed 02 November 2022]. 55 FINAL REPORT [100] H. Mbabazi, “Uganda Railways Resumes Commuter Train Services In Kampala,” 09 08 2021. [Online]. Available: https://thecapitaltimes.co.ug/2021/08/09/uganda-railways-resumes-commuter-trainservices-in-kampala/. [Accessed 07 01 2023]. Birmingham Centre for Railway Research and Education University of Birmingham Edgbaston, Birmingham B15 2TT, United Kingdom Tel: +44(0) 121 414 2626 Email: m.blumenfeld@bham.ac.uk Web: https://www.birmingham.ac.uk/research/railway/index.aspx