Overview
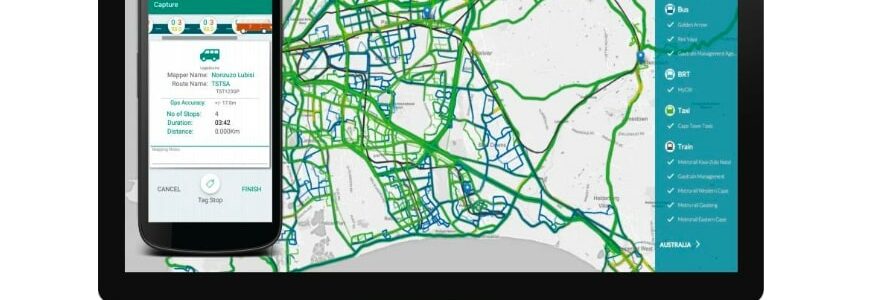
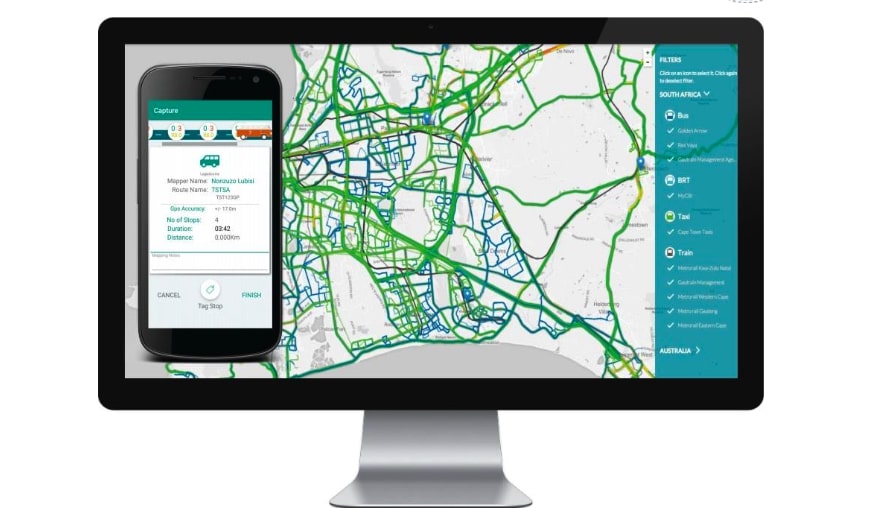
The key objective of the Africa Urban Mobility Observatory (AUMO) research project is to promote inclusive, lowcarbon mobility in African Low-Income Country (LIC) cities, by piloting Big Data applications to generate data, benchmark performance and draw policy insights in six African cities. This report provides an evaluation of the Big Data technologies that had been applied in the AUMO cities, as well as the initial set of indicators that had been included in the AUMO portal.
Publications with the same themes


Publications with the same study countries

Related news & events

Blog

News

Blog
PDF content (text-only)
Big Data to Enable Inclusive, Low Carbon Mobility HVT Africa Urban Mobility Observatory Big Data Technology and Indicators Report Sands September 2022 HVT Africa Urban Mobility Observatory/40001 GoMetro Services Agreement/HVT/042 This research was funded by UKAID through the UK Foreign, Commonwealth and Development Office under the High-Volume Transport Applied Research Programme, managed by IMC Worldwide. The views expressed in this report do not necessarily reflect the UK government's official policies. Reference No. HVT/042 Lead Organisation/ Consultant GoMetro (PTY) LTD Partner Organisation(s)/ Consultant(s) UN-Habitat, Wuppertal Institute, Urban Electric Mobility Initiative (UEMI) Title Big Data Technology and Indicators Report Type of document Project Report Theme Climate change Sub-theme Urban Transport Author(s) Alvin Mejia, Santhosh Kodukula, Oliver Lah (WI); Emilie Martin, Vera-Marie Andrieu (UEMI); Philip Krause (GoMetro) Lead contact Philip Krause Geographical Location(s) Malawi, Botswana, Rwanda, DR Congo, Nigeria, Lesotho Abstract The key objective of the Africa Urban Mobility Observatory (AUMO) research project is to promote inclusive, lowcarbon mobility in African Low-Income Country (LIC) cities, by piloting Big Data applications to generate data, benchmark performance and draw policy insights in six African cities. This report provides an evaluation of the Big Data technologies that had been applied in the AUMO cities, as well as the initial set of indicators that had been included in the AUMO portal. Keywords Informal Paratransit; Low Income Country; Inclusivity; Mobility; Big Data; Transport Policy; Vision 2063; Road Safety; Mobility Pathways; Climate Change; Air Quality; Accessibility Funding UKAid/ FCDO Acknowledgements Gratitude to the stakeholders in Kigali and Blantyre who shared their sector specific insights and provided detailed information on the unique mobility innovations and challenges experienced in their cities. The research team would also like to thank experts who have provided their insights through the survey and interviews, as well as the participants in the city workshops. Special thanks to Mizero Jules who is taking up Master of Science in Highway Engineering and Management at University of Rwanda for supporting the research process for this study. Issue Status Author(s) Reviewed By Approved By Issue Date 1 Draft report Alvin Mejia, Santhosh Kodukula, Oliver Lah (WI); Emilie Martin, Vera-Marie Andrieu, (UEMI); Philip Krause (GoMetro) Gail Jennings 24 August 2022 2 Draft report Alvin Mejia, Santhosh Kodukula, Oliver Lah (WI); Emilie Martin, Vera-Marie Andrieu, (UEMI); Philip Krause (GoMetro) Gail Jennings 29 August 2022 3 Final draft Alvin Mejia, Santhosh Kodukula, Oliver Lah (WI); Emilie Martin, Vera-Marie Andrieu, (UEMI); Philip Krause (GoMetro) Marius Pretorius Justin Coetzee 31 August 2022 4 Final Report Alvin Mejia, Santhosh Kodukula, Oliver Lah (WI); Emilie Martin, Vera-Marie Andrieu, (UEMI); Philip Krause (GoMetro) Marius Pretorius Justin Coetzee 30 September 2022 5 Final Report (Corrected) Alvin Mejia, Santhosh Kodukula, Oliver Lah (WI); Emilie Martin, Vera-Marie Andrieu, (UEMI); Philip Krause (GoMetro) Marius Pretorius Justin Coetzee 14 October 2022 iii AFRICA URBAN MOBILITY OBSERVATORY – BIG DATA TECHNOLOGIES AND INDICATORS REPORT CONTENTS Executive Summary xii Methodology xii Summary of Key Findings xii 1. Introduction 1 1.1 Report objectives 1 1.2 Report structure 1 1.3 Research background and objectives 1 1.4 Project activity streams and deliverables overview 1 2. Understanding the Challenge 3 2.1 Cities and mobility trends in Sub-Saharan Africa 3 2.2 The transport data challenge 8 2.3 The digitalisation challenge 11 2.4 State of responses 14 2.4.1 Responses to the sustainable urban mobility challenge: policy trends 14 2.4.2 Governmental responses to the digitalisation and data gap challenge 15 2.4.3 Initiatives to fill the transport data gap 16 2.5 Summary 19 3. Evaluation of Big Data technologies and indicators used in the AUMO project 20 3.1 Introduction 20 3.2 Methodology 20 3.3 Insights from the literature review 21 3.3.1 Big Data and Big Data technologies 21 3.3.1.1 Concept of Big Data 21 3.3.1.2 Big Data and Urban Transportation 22 3.3.1.3 Big Data in the African Region 26 3.3.1.4 Big Data challenges 29 3.3.2 Sustainable mobility indicators 32 3.3.2.1 Selected indicators 32 3.3.3 Summary of the key findings 33 3.4 Insights from the expert surveys and interviews, and consultations with local stakeholders 34 3.4.1 Big Data and Big Data technologies 34 3.4.1.1 Concept of Big Data 34 3.4.1.2 Use cases 34 3.4.1.3 Challenges related to the utilisation of Big Data in the realm of urban mobility 36 3.4.1.4 Benefits and opportunities 39 3.4.1.5 Roles of city authorities 40 3.4.2 Sustainable mobility indicators 41 3.4.2.1 Initial set of indicators 41 3.4.2.2 Indicators related to the data generated by the UMA app 41 3.4.2.3 Other indicators 42 3.4.3 Summary of the Key Findings 44 iv AFRICA URBAN MOBILITY OBSERVATORY – BIG DATA TECHNOLOGIES AND INDICATORS REPORT 3.5 Insights from the application of Big Data technology: AUMO case studies 45 3.5.1 Data collection approach 45 3.5.2 Sampling plan development 46 3.5.3 Conventional Surveys 47 3.5.3.1 Conventional Surveys Development 48 3.5.3.2 Conventional surveys deployment 48 3.5.3.3 Survey response rates and cost 51 3.5.4 USSD and WhatsApp surveys 51 3.5.4.1 USSD surveys development 52 3.5.4.2 WhatsApp Surveys development 54 3.5.4.3 SMS and participation incentives campaigns preparation 54 3.5.4.4 Survey response rates and cost 55 3.5.5 UMA surveys 57 3.5.5.1 UMA surveys development 57 3.5.5.2 UMA survey deployment 60 3.5.5.3 Survey Response Rates and Cost 60 3.5.6 Key findings 62 3.5.6.1 Socio-demographic profile of respondents per survey technology 62 3.5.6.2 Comparison of Data Collection Methods 63 3.6 Recommendations 64 3.6.1 Big Data for Aiding Sustainable Urban Mobility Transitions 64 3.6.2 Sustainable Mobility Indicators 68 3.6.3 Data Collection Tools and Techniques 69 4. Sustainable Mobility Indicators - Results from the Data Collection in the AUMO Cities 70 4.1 Introduction 70 4.2 Mobility 70 4.2.1 Mode share 70 4.2.2 Distance travelled and travel time 72 4.2.3 Transfers 73 4.2.4 Accessibility 74 4.3 Public Transport Experience 76 4.3.1 Public perception on comfort in public transport 76 4.3.2 Public Transit Reliability 77 4.3.3 Public perception on breakdowns 78 4.3.4 Driver Behaviour 79 4.3.5 Sexual Harassment 80 4.3.6 Crime 81 4.4 Vehicle Efficiency 82 4.4.1 Vehicle Occupancy 82 4.5 Summary 83 5. References 84 Appendix A: Search Strategy Bilbiometric analysis B v AFRICA URBAN MOBILITY OBSERVATORY – BIG DATA TECHNOLOGIES AND INDICATORS REPORT Appendix B: Experts Survey D Appendix C: Comments regarding the current AUMO indicator list – Blantyre and Kigali P Appendix D: Field Surveys – Sample Strata (Targets) R Appendix E: USSD Campaign Stakeholders by city W Annex A. AUMO Policy And Planning Insights Report: Responses to the Sustainable Urban Mobility Challenge (Policy Trends) X Annex B. Case Studies : Applications, Functions, and REquirements Z Annex C. Summary of sustainable mobility indicators from various initiatives BB Annex D. Reviewed Sustainable Mobility Indicators CC Annex E. AUMO Indicators LL Annex F. Experts Interview OO Annex G. Ethics Clearance Letter (Data Collection) QQ Annex H. Questionnaires used in data collection RR Pilot Field Survey Questionnaire RR Main Phase 1 Field Survey Questionnaire UU Main Phase 2 Field Survey Questionnaire XX Phase 1 USSD Survey Questionnaire AAA Phase 2 USSD Survey Questionnaire CCC Phase 2 WhatsApp Survey Questionnaire EEE UMA Disaggregation Survey Questionnaire GGG TABLES Table 1: Project deliverables per activity stream................................................................................................... 2 Table 2: Challenges and related indicators............................................................................................................ 6 Table 3: Scores of AUMO countries in the SUM4All Sustainable Mobility Index .................................................. 7 Table 4: Factors underlying the mobility data gaps............................................................................................... 8 Table 5: Identification of mobility challenges and data gaps............................................................................... 10 Table 6: Key ICT indicators in the world, SSA and the AUMO countries.............................................................. 12 Table 7: Transport-related initiatives to fill the digital divide in Africa ............................................................... 17 Table 8: Big Data Sources for urban transport adapted from Wu et al. 2022 ..................................................... 23 Table 9: Challenges related to the utilisation of Big Data in urban mobility ....................................................... 36 Table 10: Challenges Related to Big Data initiatives: insights from the city workshops ..................................... 39 Table 11: Experts' opinions regarding the importance of other relevant indicators .......................................... 43 Table 12: TAZ and TAZ clusters per city ............................................................................................................... 46 Table 13: Africa Urban Mobility Observatory list of indicators............................................................................ 48 Table 14: Test surveys response tracking............................................................................................................. 49 Table 15: Main phase 1 surveys response tracking.............................................................................................. 50 vi AFRICA URBAN MOBILITY OBSERVATORY – BIG DATA TECHNOLOGIES AND INDICATORS REPORT Table 16: Main phase 2 surveys response tracking.............................................................................................. 51 Table 17: Field surveys campaign cost per city (main phase 2)........................................................................... 51 Table 18: Dedicated USSD channel setup and maintenance costs per city ......................................................... 52 Table 19: USSD survey response rates................................................................................................................. 55 Table 20: WhatsApp survey response rates......................................................................................................... 55 Table 21: USSD data collection campaign cost per city ....................................................................................... 56 Table 22: WhatsApp data collection campaign cost per city ............................................................................... 56 Table 23: USSD campaign cost per city ................................................................................................................ 56 Table 24: WhatsApp campaign cost per city........................................................................................................ 56 Table 25: UMA Prospective Partner App List....................................................................................................... 60 Table 26: UMA participation rates....................................................................................................................... 61 Table 27: UMA campaign cost per city................................................................................................................. 61 Table 28: Equivalent UMA unit cost per city........................................................................................................ 61 Table 29: Survey campaign total costs per type per city ..................................................................................... 63 Table 30: Survey campaign unit cost and response quantity per survey type per city ....................................... 64 Table 31: Identified key actions by the stakeholders in Blantyre ........................................................................ 67 Table 32: Identified key actions by the stakeholders in Kigali ............................................................................. 68 Table 33: Estimated % of Population with Convenient Access to Public Transport ............................................ 74 FIGURES Figure 1: Research activity flow ............................................................................................................................. 2 Figure 2: Urban Passenger Transport Demand, Billion PKM (6) ............................................................................ 3 Figure 3: Urban Freight Transport Demand, Billion TKM (6) ................................................................................. 4 Figure 4: SUM4All Sustainable Mobility Index (27)................................................................................................ 7 Figure 5: Sub-Saharan Africa: Enhanced Digital Access Index—Evolution of Sub-Indices (45) ........................... 11 Figure 6: Number of mobile money services per country, 2020 (48) .................................................................. 11 Figure 7: Digital Connectivity: country groupings under K=3 clusters................................................................. 11 Figure 8: Individuals using the internet in the World and in SSA (% of population, (46)) ................................... 12 Figure 9: Individuals using the internet in Malawi, Lesotho, Rwanda, Botswana, Congo, Dem. Rep., Nigeria (% of population, (46)).............................................................................................................................. 12 Figure 10: Scientific production on Big Data in urban mobility ........................................................................... 22 Figure 11: Keyword co-occurrences for Big Data in urban mobility .................................................................... 23 Figure 12: Scientific production (research on Big Data in Africa) ........................................................................ 27 Figure 13: Country collaboration (research on Big Data in Africa) ...................................................................... 27 Figure 14: Leading research institutions (research on Big Data in Africa) ........................................................... 28 Figure 15: Keyword co-occurrences (research on Big Data in Africa).................................................................. 28 vii AFRICA URBAN MOBILITY OBSERVATORY – BIG DATA TECHNOLOGIES AND INDICATORS REPORT Figure 16: Thematic Map (research on Big Data in Africa) .................................................................................. 29 Figure 17: Sub-steps in the Selection of the Initial Indicators for the AUMO Web Portal .................................. 32 Figure 18. AUMO Initial Set of Indicators............................................................................................................. 32 Figure 19. Risks associated with UMA.................................................................................................................. 38 Figure 20: Benefits of Big Data in the field of urban mobility.............................................................................. 39 Figure 21: Opinions regarding the involvement of cities in aspects relevant to Big Data................................... 40 Figure 22: Importance of actions by cities........................................................................................................... 40 Figure 23: Experts opinions on the level of importance of indicator clusters..................................................... 42 Figure 24: Data collection approach .................................................................................................................... 46 Figure 25: Sampling technique flow chart ........................................................................................................... 47 Figure 26: USSD data flow illustration.................................................................................................................. 53 Figure 27: SASA Solutions web-based USSD simulator (Lagos)............................................................................ 53 Figure 28: UMA Users Static Location Snapshot and Trip Routes ....................................................................... 58 Figure 29: UMA App Initiation Screens................................................................................................................ 58 Figure 30: UMA app disaggregation survey ......................................................................................................... 59 Figure 31: UMA app tracking screens .................................................................................................................. 59 Figure 32: UMA Campaign Flyer (Lagos) .............................................................................................................. 60 Figure 33: UMA Facebook Advert (Lagos)............................................................................................................ 60 Figure 34: Ratio of responses per technology per city by gender ....................................................................... 62 Figure 35: Ratio of responses per technology per city by age group................................................................... 62 Figure 36: Ratio of responses per technology per city by employment status ................................................... 62 Figure 37: Ratio of Responses per Technology per City by Education Level ....................................................... 63 Figure 38: Ratio of Responses per Technology per City by Income Group.......................................................... 63 Figure 39: Mode share of the AUMO cities, excluding Kigali, based on the surveys........................................... 70 Figure 40: Mode share of AUMO project cities depending on the travel period ................................................ 71 Figure 41: Mode share of AUMO cities, excluding Kigali, based on trip purpose................................................ 71 Figure 42: Mode share in AUMO cities, excluding Kigali, based on gender ........................................................ 71 Figure 43: Mode share in AUMO cities, excluding Kigali, based on age .............................................................. 71 Figure 44: Mode share in AUMO cities, excluding Kigali, based on income level ............................................... 72 Figure 45: Average travel distance and travel time in AUMO cities, excluding Kigali ......................................... 72 Figure 46: Average travel distance according to gender in AUMO cities, excluding Kigali ................................. 73 Figure 47: Frequency of transfers in a trip in AUMO cities, excluding Kigali....................................................... 73 Figure 48: Frequency of transfers according to income level in AUMO cities, excluding Kigali.......................... 73 Figure 49: Accessibility to Public Transport: Blantyre.......................................................................................... 75 Figure 50: Accessibility to Public Transport: Gaborone ....................................................................................... 75 Figure 51: Accessibility to Public Transport: Kigali............................................................................................... 75 viii AFRICA URBAN MOBILITY OBSERVATORY – BIG DATA TECHNOLOGIES AND INDICATORS REPORT Figure 52: Accessibility to Public Transport: Kinshasa ......................................................................................... 75 Figure 53: Accessibility to Public Transport: Lagos .............................................................................................. 75 Figure 54: Accessibility to Public Transport: Lesotho .......................................................................................... 75 Figure 55: Perceived level of comfort in public transport in AUMO cities, excluding Kigali ............................... 76 Figure 56: Perceived comfort level in public transport during travel period in AUMO cities, excluding Kigali... 76 Figure 57: Perceived level of comfort depending on trip purpose in AUMO cities, excluding Kigali .................. 77 Figure 58: Perceived level of comfort according to gender in AUMO cities, excluding Kigali............................. 77 Figure 59: Perceived public transport reliability in AUMO cities, excluding Kigali .............................................. 77 Figure 60: Perceived public transport reliability during travel period................................................................. 78 Figure 61: Perceived public transport reliability based on trip purpose ............................................................. 78 Figure 62: Perceived public transport reliability based on gender...................................................................... 78 Figure 63: Public perception on the frequency of public transport breakdown in AUMO cities, excluding Kigali .............................................................................................................................................................. 79 Figure 64: Public perception on the frequency of public transport breakdown during specific travel periods in AUMO cities, excluding Kigali .............................................................................................................. 79 Figure 65: Perceived driver behaviour in AUMO cities, excluding Kigali ............................................................. 79 Figure 66: Perceived driver behaviour during specific travel periods in AUMO cities, excluding Kigali ............. 80 Figure 67: Perceived driver behaviour based on respondents' gender in AUMO cities, excluding Kigali........... 80 Figure 68: Sexual harassment on public transport in AUMO cities, excluding Kigali .......................................... 80 Figure 69: Sexual harassment on public transport based on respondents' gender in AUMO cities, excluding Kigali..................................................................................................................................................... 81 Figure 70: Perceived crime situation on public transport in AUMO cities, excluding Kigali................................ 81 Figure 71: Perceived crime situation on public transport during travel periods in AUMO cities, excluding Kigali .............................................................................................................................................................. 81 Figure 72: Perceived crime situation on public transport based on gender in AUMO cities, excluding Kigali.... 82 Figure 73: Perception on vehicle occupancy of public transport during travel periods in AUMO cities, excluding Kigali..................................................................................................................................................... 82 Figure 74: Perception on vehicle occupancy of public transport based on income level in AUMO cities, excluding Kigali..................................................................................................................................... 82 ix AFRICA URBAN MOBILITY OBSERVATORY – BIG DATA TECHNOLOGIES AND INDICATORS REPORT ACRONYMS AND ABBREVIATIONS AFC Automated fare collection APC Automated passenger counts API Application Programming Interface APK Android Package Kit ASEAN Association of Southeast Asian Nations AUMO Africa Urban Mobility Observatory BRT Bus rapid transit CAF Corporación Andina de Fomento CCTV Closed-circuit television CO2 Carbon Dioxide COM City of Melbourne CTO Chief Technology Officer DRC Democratic Republic of the Congo DTU Technical University of Denmark DT4A DigitalTransport4Africa EEA European Economic Area ERI Electronic registration identification FCDO United Kingdom's Foreign, Commonwealth and Development Office GBP British Pound Sterling GDPR General Data Protection Regulation GHG Greenhouse gas GIS Geographic Information System GNI Gross National Income GPS Global Positioning System GSM Global System for Mobile Communications GTFS General Transit Feed Specifications x AFRICA URBAN MOBILITY OBSERVATORY – BIG DATA TECHNOLOGIES AND INDICATORS REPORT HVT High Volume Transport ICT Information and communication technology ITU International Telecommunication Union LEMP Low-end Mobile Phones LRT Light rail transit LTE Long-Term Evolution MaaS Mobility as a Service MNO Mobile Network Operator NDC Nationally Determined Contributions NDPB Nigerian Data Protection Bureau NDPR Nigerian Data Protection Regulation NGO Non-government organisation NISR National Institute of Statistics Rwanda NMT Non-motorised transport NSS National Statistical System of Botswana OECD Organisation for Economic Co-operation and Development O-D Origin-Destination Pair OSM Open Street Maps OUM Observatory of Urban Mobility PKM Passenger kilometres POI Point of Interest PT Public transport RFID Radio Frequency Identification RURA Rwanda Utilities Regulatory Authority SDG Sustainable Development Goals SDK Software development kit SMP Sustainable Mobility Project xi AFRICA URBAN MOBILITY OBSERVATORY – BIG DATA TECHNOLOGIES AND INDICATORS REPORT SMS Short Message Service SSA Sub-Saharan Africa SUMI Sustainable Urban Mobility Index SUMP Sustainable Urban Mobility Plan SUM4ALL Sustainable Mobility for All TAZ Traffic Analysis Zones TIMS Transport Integrated Management System TIN Tax Identification Number TKM Ton kilometres TNM Telekom Networks Malawi UEMI Urban Electric Mobility Initiative UK United Kingdom UITP Union Internationale des Transports Publics UMA User Movement Analytics UN United Nations UNESCAP United Nations Economic and Social Commission for Asia UNICEF United Nations Children's Fund US United States of America USD United States Dollar USSD Unstructured Supplementary Service Data WBCSD World Business Council for Sustainable Development WI Wuppertal Institute WoS Web of Science WRI World Resources Institute 2G Second Generation GSM 3G Third Generation GSM 4G Fourth Generation GSM xii AFRICA URBAN MOBILITY OBSERVATORY – BIG DATA TECHNOLOGIES AND INDICATORS REPORT Executive Summary This report presents the results of the evaluation of the Big Data technologies and data collection approaches that had been utilised in the pilot cities (Blantyre, Gaborone, Kinshasa, Kigali, Lagos, Maseru) of the HVT Africa Urban Mobility Observatory (AUMO) project, as well as the initial set of indicators that had been included in the current version of the AUMO web portal (https://mobility.observatory.go-africa.org/#/start). The report falls under Activity Stream 3 – Indicators and Technology Evaluation of the HVT Africa Urban Mobility Observatory (AUMO) project. This Activity stream features the following main activities: • Review of the state of practice relating to mobility indicators and Big Data; • Drafting of a set of mobility indicators based on the results of the review of the landscape of mobility indicators currently being used elsewhere. These were used as the basis for the initial set of indicators that had been included in the AUMO web portal; • Consultations with beneficiary cities and technical experts to assess the Big Data technologies, and indicators in the AUMO web portal. Methodology The methodology used in the evaluation process consists of the following: • Review of literature: The team reviewed literature related to the relevant challenges (mobility and digitalisation), state of practice relating to mobility indicators and Big Data, and investigated relevant developments across sub-Saharan Africa. In relation to the indicators, the team mapped out relevant regional and global processes, and the corresponding indicator sets and also considered the general sets of challenges and priorities of the AUMO cities/countries. The team conducted a dedicated exercise to investigate the research literature, focusing on Big Data and mobility, as well as Big Data in the African region; • Drafting an initial set of mobility indicators - The results of the literature review produced an initial set of indicators that were used as a guide in defining the approaches related to the data collection conducted in the AUMO cities; • Validation with beneficiary cities and technical experts - The validation exercises were composed of the following: an online survey that targeted experts who work in the field of sustainable urban mobility, and who have experience/knowledge about Big Data within the urban mobility realm; online interviews with experts; city workshops that in the AUMO action planning cities (Blantyre, Malawi, and Kigali, Rwanda); • Pilot implementation - The lessons and insights from the actual implementation of Big Data collection exercises were documented and form the basis for the evaluation of the Big Data technologies within the context of the AUMO cities. Summary of Key Findings Understanding the Challenge • The trends highlight the importance of pursuing means towards directing the African region towards sustainable mobility pathways. Africa is positioned to exhibit the highest rates of growth in terms of urban transportation activity in the next decades, and the challenge of providing sustainable, highquality, and affordable transportation services, and the associated infrastructure and capacities, is becoming increasingly significant. Issues related to the basic tenets of sustainable mobility can be seen as commonly present across the region, albeit in different states; • The gaps in mobility-relevant data aggravate the hindrances towards pursuing sustainability in the mobility sector in the region. These gaps are driven by various factors related to costs of sustaining data collection efforts, lack of mechanisms or willingness to share data, lack of attention provided to xiii AFRICA URBAN MOBILITY OBSERVATORY – BIG DATA TECHNOLOGIES AND INDICATORS REPORT specific elements of the transport systems (e.g., non-motorised modes), and governance-related issues, among others; • The investigation of the potential for the utilisation of Big Data towards aiding the pursuit of sustainability in the mobility sector also entails the investigation of the major enablers of such technologies, such as digitalisation trends. While significant strides had been achieved in terms of improving overall digital access metrics in the recent past, the digital divide in the region remains more significant as compared to other regions. It is also worthwhile noting that major differences in such metrics can be observed within countries in Africa; • The state of government responses towards addressing mobility issues, as well as those directed at addressing digitalisation and data gaps, indicate that there is progress in the region, but there are significant opportunities to accelerate this. Big Data technologies in urban mobility • Evidence from the literature highlights a variety of beneficial use cases for the application of Big Data in the field of urban mobility. However, these also reflect the diversity and complexity of the requirements that must be considered in operationalising the use of Big Data in the field; • While a rich set of research papers focusing on Big Data in urban mobility has been found at the global level, only a few (although increasing) were found to focus on Africa; • The literature on the concept of Big Data reflects diversity in terms of how the concept is being characterised. Some definitions focus on capturing the essence of the data generated itself, while some go beyond the data characteristics, and encapsulate related processes, the value addition created by the data, and the requirements that are needed to generate and utilise such data. The reliance of Big Data on continuous feeds and updates, and thus, the associated processes (e.g.: maintenance, management, and updating) should be emphasised in the discussions surrounding the concept of Big Data, which would then be helpful in better understanding its nature, and the associated requirements; • Big Data offers opportunities to lower the overall costs of gathering relevant data for planning. It also opens novel opportunities for better identifying links between mobility behaviour, and other factors; • Various challenges are restricting the uptake of Big Data in urban mobility. These typically relate to policies, management, infrastructure, and technology, as well as people and communities. The experts consulted in this study view policy-related challenges as most significant. Ensuring data privacy is critical for Big Data technologies, such as user movement analytics, to be effective; • The lessons from the pilot implementation are as follows: o Data collection permissions and data privacy; ▪ Most territories require formal data collection permission requests to be submitted to local authorities before data collection may commence – these permissions should be sought well in advance of campaign commencement; ▪ Data privacy regulations vary across territories – these must be investigated thoroughly; ▪ Data collection through remotely administered technology-driven surveys tools may require additional clearances from additional legal entities; o Conventional field intercept surveys; ▪ In most cities, except for Blantyre, conventional field intercept surveys proved to be the most cost-effective mobility data collection method; o Unstructured Supplementary Service Data (USSD)/WhatsApp Surveys and Short Message Service (SMS) Marketing Messages; ▪ SMS marketing messages proved to be a cost-effective mechanism through which to recruit USSD and WhatsApp survey participants; ▪ USSD and WhatsApp surveys could only be conducted in Lagos and Blantyre since mobile network operator costs were found to be too high in Gaborone, Kinshasa, and Maseru, while in Kigali, the required data collection approvals could not be obtained; xiv AFRICA URBAN MOBILITY OBSERVATORY – BIG DATA TECHNOLOGIES AND INDICATORS REPORT ▪ The majority of USSD survey participants were unable to complete the survey due to the time limit associated with USSD sessions (a reduced length survey would have helped overcome this challenge); ▪ In Blantyre, despite many USSD respondents not having sufficient time to complete the survey before the session expired, enough participants were able to complete the survey to yield a cost per survey lower than any other survey mode (in comparison with field intercept surveys, WhatsApp surveys, and User Movement Analytics); ▪ WhatsApp has the potential to be a cost-effective technology to administer mobility surveys, although due to marketing campaigns in AUMO cities which favoured USSD, few survey respondents chose to participate via WhatsApp; ▪ For large campaigns exceeding 1,000 respondents, due to the economies of scale with these technologies, USSD and WhatsApp surveys have the potential to become considerably more cost-effective than conventional field intercept surveys; o User Movement Analytics (UMA); ▪ UMA is a smartphone-based survey technology developed by GoMetro which automatically generates travel diaries on participants' devices, using background location tracking; ▪ This technology can be integrated with existing Android apps, and is also available as a standalone app (the iOS version is under development); ▪ The main challenge experienced in trying to integrate with existing Android apps is achieving buy-in from prospective app partners (who are usually reluctant to proceed with integration, due to concerns that this may reduce their app's stability, and impair user experience); ▪ The main challenge experienced with the standalone app was poor conversion rates in terms of converting campaign advert click-throughs into active participants. • The consolidated recommendations for cities are the following: o Integrate Big Data into urban mobility planning – As Big Data technologies and applications evolve and find their way into developing cities in Africa, city authorities should be active in exploring how such can be leveraged and utilised to support the fruition of their vision and objectives relating to urban mobility; o Adopt appropriate local policies and regulations – Elevating the understanding of local authorities regarding the overall governance and policy landscapes related to critical issues related to Big Data (i.e., data privacy, cybersecurity) is crucial for guiding the development of complementary policies and regulations at the local level. This is necessary for crafting supportive local policies and regulations (e.g., bolstering capacities, provision of incentives, and setting up appropriate data sharing mechanisms); o Determine the city's role and build capacities – City authorities should consider defining the specific roles that they want to play within the Big Data process chain, and how such roles can evolve in the future. Considering constraints (i.e., budget, skills gaps), an iterative and context-specific approach towards strategic capacity building should be taken into consideration. In the short term, to bolster city government's capacity, working with technical consultants and academic institutions could be beneficial; o Address infrastructure and technology gaps - The infrastructure challenges have been pointed to as critical challenges for the use of Big Data. Cities should be cognisant of the emerging technological solutions that can serve as alternatives to costly hardware – for example, cloudbased servers. The determination of infrastructure requirements, the earmarking of local funds, and the identification of other funding and financing resources should be explored when considering Big Data collection initiatives; o Establish mechanisms for collaboration - Developing cities are mostly confronted by significant limitations in terms of capacities, skills, and resources. Finding ways to maximise xv AFRICA URBAN MOBILITY OBSERVATORY – BIG DATA TECHNOLOGIES AND INDICATORS REPORT collaboration can help address such issues, and city authorities – such as by setting-up an urban living lab focusing on Big Data and mobility - can explore synergies with other entities such as academic institutions, and the private sector; o Support the promotion of Big Data - It is important that city authorities actively support such initiatives and facilitate dialogue and communication efforts with the relevant stakeholders. Leading by Doing is a further strategy that can spur interest and support for Big Data use in the mobility sector. AUMO sustainable mobility indicators • The review of relevant global and regional processes that relate to sustainable mobility indicators finds that there are a wide set of indicators that are being used and are categorised in various ways. Ultimately, clear definitions for any indicator adopted are of primary importance for aiding decisionmaking. In the case of the initial set of indicators adopted for the project, more detailed definitions/ descriptions had been suggested by the stakeholders; • The relevance of the initial set of indicators adopted in this project had been validated by the local stakeholders, as well as the experts that had been consulted; • Some indicators had originally been included in the list, but have not been populated with data (e.g., affordability, traffic fatalities, Carbon dioxide or CO2 emissions, congestion) as these require data that would need to be collected from other (e.g., secondary) sources; • Additional indicators which capture further dimensions of mobility (e.g., mode shares, road safety, and accessibility) had been proposed by the experts and local stakeholders for inclusion; • The analysis of the data collected in AUMO shows that such can provide key inputs to the local policy makers and the operators feedback on improving and strengthening the transport offerings; • The innovative element that the AUMO project brings is the ease of collecting large swathes of data directly from the users. As technology gradually becomes an integral part of the day-to-day life of citizens, having smart devices can also become a key feedback submission portal. Through noninvasive data collection techniques, the personal data of the user is protected, and only the data that the user wishes to share is shared for processing; • The key recommendations pertaining to the indicators are as follows: o Retain and refine the existing set of indicators - The relevance of the initial set of indicators was validated by the local stakeholders and subject matter experts. However, there is a need to further refine the definitions as reflected in the portal, and refine the titles of some of the indicators; o Explore the inclusion of additional indicators - The validation exercise pointed towards the benefit of having additional indicators in the portal. For one, the current indicators are primarily focusing on urban passenger transport, and the inclusion of urban freight-focused indicators should be explored. The use of Big Data (e.g., UMA) also allows for including additional indicators, for example, indicators for trip chains and multi-modality; o Explore the utilisation of the AUMO data with other sources - Significant information about urban mobility (e.g., in relation to choice-making) can be uncovered when effectively combining existing Big Data (e.g., user movements) with other data reflecting the physical environment, transport services, and socioeconomic factors. 1 AFRICA URBAN MOBILITY OBSERVATORY – BIG DATA TECHNOLOGIES AND INDICATORS REPORT 1. Introduction 1.1 Report objectives This report presents the results of the evaluation of the Big Data technologies and data collection approaches that had been utilised in the pilot cities (Blantyre, Gaborone, Kinshasa, Kigali, Lagos, Maseru) of the High Volume Transport (HVT) Africa Urban Mobility Observatory (AUMO) project, as well as the initial set of indicators that had been included in the current version of the AUMO web portal (https://mobility.observatory.go-africa.org/#/start). The report falls under Activity Stream 3 – Indicators and Technology Evaluation of the HVT AUMO project. This Activity stream features the following main activities: • Review of the state of practice relating to mobility indicators and Big Data; • Drafting of a set of mobility indicators; o Based on the results of the review of the landscape of mobility indicators currently being used elsewhere; o These were then used as the basis for the initial set of indicators that had been included in the AUMO web portal; o Finally, consultations with beneficiary cities and technical experts to assess the Big Data technologies, and indicators in the AUMO web portal. 1.2 Report structure This report is primarily segmented into four main sections: • Section 1 provides the background of the AUMO project and how this report fits into the overall research design; • Section 2 provides insights towards understanding the mobility, and the relevant data gaps and challenges in the AUMO countries and cities, as well as in the African region, in general; • Section 3 presents the results of the evaluation of the Big Data technologies and initial set of indicators that had been included in the AUMO web portal. It presents the results from the literature review, the consultations with the experts and local stakeholders, as well as the insights from the onthe-ground application of the technologies; • Finally, Section 4 presents visualisations of the data that had been collected in the AUMO cities. 1.3 Research background and objectives The AUMO research project is a component of the second phase of the United Kingdom's Foreign, Commonwealth and Development Office (FCDO) HVT Applied Research Programme. More specifically, in the context of the impact that urban transport planning has on climate change and inclusion in LIC (Low Income Countries) in Africa, this research intends to address the following three research questions: 1. Big Data Technology: What are the opportunities and risks of Big Data applications in HVT cities? 2. Informal Paratransit: What is the role of informal transport in the global South and how to enable transition towards a clean, affordable, and efficient solution for HVT? 3. Policy Levers: What are the main levers for mode share and what is the role of data? 1.4 Project activity streams and deliverables overview This project comprises four interlinked Activity Streams (see Figure 1). Activity Streams 1, 2 and 3 are led by GoMetro, UN-Habitat and Wuppertal/Urban Electric Mobility Initiative (UEMI), respectively. Activity Stream 4 is led collaboratively. These Activity Streams run in parallel, and the outputs generated under one Activity Stream are used as inputs to the others. 2 AFRICA URBAN MOBILITY OBSERVATORY – BIG DATA TECHNOLOGIES AND INDICATORS REPORT Figure 1: Research activity flow This report, Deliverable 7, falls under Activity Stream 3. A total of 10 deliverables are associated with the four Activity Streams (see Table 1). Table 1: Project deliverables per activity stream Deliverable Description Activity Stream Submission Date Deliverable 0 Inception Report (submitted) 0 31 August 2020 Deliverable 1 Brief Scoping Report (submitted) 1 30 October 2020 Deliverable 2 Launch of Big Data Application (submitted) 1 18 December 2020 Deliverable 3 Web Data Platform (submitted) 4 26 February 2021 Deliverable 4 Role of Informal Paratransit – Report (submitted) 2 30 September 2021 Deliverable 5 Policy and Planning Insights – Report (submitted) 2 28 January 2022 Deliverable 6a Workshop and Webinars (Introductory) (submitted) 4 29 October 2021 Deliverable 6b Workshop and Webinars (Post Data Collection) 4 29 April 2022 Deliverable 7 Big Data Technology and Indicators Report (this report) 3 31 August 2022 Deliverable 8 Action Plans 4 31 October 2022 Deliverable 9 Peer Reviewed Journal Article 4 25 November 2022 3 AFRICA URBAN MOBILITY OBSERVATORY – BIG DATA TECHNOLOGIES AND INDICATORS REPORT 2. Understanding the Challenge Over the last decades, planning and provision of urban transportation has become one of the most striking challenges in African cities. This issue is exacerbated by the lack of comprehensive and updated transport data that decision-makers need to design adequate evidence-based policy answers. This chapter describes the main mobility drivers and trends, transport data gaps and responses in Sub-Sahara African and AUMO countries to better understand the challenge. It paves the way for the subsequent analysis of the potential of Big Data. This section further presents the state of digitalisation, gaps, and policy answers in these countries. This section further presents the state of digitalisation, gaps, and policy answers in these countries, which are also useful in subsequent analysis of the potential of Big Data in the region. Sub-Saharan countries are understood following the definition of the UN Statistics Division codes for statistical use (1). 2.1 Cities and mobility trends in Sub-Saharan Africa Main characteristics Cities in Africa are rapidly growing. In 2020, Sub-Saharan Africa (SSA) experienced an annual urban population growth of 3.9%, slowing down compared to rates of 4.5 to 5% experienced in the 1970s to 1990s, yet still much higher than the global average in 2020 of 1.8% (2). In fact, the urban population in SSA cities grows at twice the pace of the global average and at this rate, urban population is forecasted to reach 1.33 billion in 2050, compared with the current 470 million (3). This urban growth is even more challenging, as it is often decoupled from economic growth. In addition, much of the growth is happening in capital cities and major urban agglomerations, aggravating not only transport challenges but also demanding financial resources and efforts, leaving little for secondary cities (4). Lastly and critically, the increase in the number of urban dwellers has been accompanied by urban sprawl, reducing densities and the efficiency of infrastructure and service delivery (5). This combination of rapid urbanisation, population growth, and spatial expansion of cities will continue to contribute to the soaring increase of mobility needs. Figure 2 and Figure 3 show the demand increase for urban transport by 2050, continuously increasing in Sub-Saharan Africa for urban passenger transport, to a much lesser extent for urban freight. Sub-Saharan Africa is expected to grow the fastest in terms of urban passenger transport activity (5.7% per annum, as compared to the global average of 3.2%), as well as in terms of urban freight (4.3% per annum, compared to the global average of 2.2%). Figure 2: Urban Passenger Transport Demand, Billion PKM (6) 0 10,000 20,000 30,000 40,000 50,000 60,000 2015 2020 2025 2030 2035 2040 2045 2050 million PKM Transition countries Sub-Saharan Africa OECD Pacific Middle-Eastern and North African countries Latin American and Carribean countries EEA + Turkey Canada + United States Asia 4 AFRICA URBAN MOBILITY OBSERVATORY – BIG DATA TECHNOLOGIES AND INDICATORS REPORT Figure 3: Urban Freight Transport Demand, Billion TKM (6) Despite these increasing mobility needs, governments have mostly been unable to keep pace with the investments in transport services and infrastructure needed to address this demand. The lack of financial resources translates into a lack of financial support for collective transport services, poor road conditions, and a lack of infrastructure. The issues are further aggravated by planning and policy deficiencies due to fragmented governance, multiplicity of institutions, lack of coordination among actors, lack of modal integration, and the absence of holistic and continuously updated planning in the entire mobility system (4,7). A substantial portion of demand is catered for by paratransit services that operate without public financial support and are subject to limited regulation. In this report, we use the notion of "paratransit" (8) or collective transport rather than "informal transport" (9), since services are not systematically operated outside of a formalised or regulated environment. Several bodies of research have documented the challenges faced by formal transport companies in the second half of the 20th century, resulting in the emergence of paratransit services. In the 1990s, the convergence of scarce financial resources due to the absence of public subsidies, low fares and low farebox revenue, mismanagement, and structural adjustment policies that prevented significant public support from national governments, led formal transport operators to bankruptcy in many SSA countries (8,10). Following this collapse, a first wave of privately-operated collective transport (e.g., mini- and microbuses) emerged to fill the mobility gap. Smaller vehicles such as sedans in South Africa or moto-taxis started being used in several SSA countries in the context of new globalised vehicle supply chains and facilitating tax regimes (10,11). A high diversity of vehicles is found across African cities, including two-, three- and four-wheeled vehicles of different sizes and capacities (12). These vehicles show heterogeneous operating patterns depending on the level of business formality, the regulation of competition, the flexibility of routes and frequencies of service (8). Paratransit is key in SSA and often constitutes more than 80% of collective transport services provided in cities. This share significantly varies among SSA countries, from a minimum of 36% in Addis Ababa or 38% in Casablanca, to a high number of cities seeing a range of 81 to 91% (Windhoek, Niamey, Algiers, Accra, Ouagadougou, Nairobi, Lagos, Bamako), reaching up 93% to 100% in other cities (Conakry, Douala, Dakar, Dar es Salaam, Kigali and Kampala) (8). These figures must however be used with caution since mostly based on data collected in the 1990s and 2000s (ibid). Paratransit modes play a crucial role in meeting mobility demand, which would stay unmet in their absence. In addition, these modes display a series of positive features, including their extensive coverage, flexibility, demand-responsiveness, limited vehicle costs and fares, which facilitates a minimum level of accessibility. Similar to formal transport services, they also provide revenues to drivers, owners, as well as workers involved in maintenance, repairs, or adjunct services at interchange points. However, these modes also pose significant challenges for users and SSA cities liveability. Some of these characteristics are endogenous, some exogenous. Firstly, intense competition between paratransit providers, fragmentation of the offer, and lack of coordination between actors are caused or worsened by the lack of 0 2,000 4,000 6,000 8,000 10,000 12,000 2015 2020 2025 2030 2035 2040 2045 2050 million TKM Transition countries Sub-Saharan Africa OECD Pacific Middle-Eastern and North African countries Latin American and Carribean countries EEA + Turkey Canada + United States Asia 5 AFRICA URBAN MOBILITY OBSERVATORY – BIG DATA TECHNOLOGIES AND INDICATORS REPORT public regulation to cap transport supply. This has detrimental impacts on users for whom providers compete, causing speeding, overtaking, or long waiting times to get vehicles filled. On a socio-economic level, the lack of social security nets and contractual labour relationships is tightly bound with exploitative relationships between owners and drivers in the form of high target systems. Combined with frequent bribes to the police (13), these result in meagre driver revenues. On an environmental level, vehicles used in Sub-Saharan cities are often bought as used or second-hand (14), often stretching beyond their lifespan planned by the manufacturer and are often not well maintained, which contributes to a high number of road crashes (15,16). Overall, the combination of old unmaintained vehicles, competition between drivers, target systems imposed by owners incentivising fast driving led to limited reliability, poor service quality, and poor road safety record. While paratransit is a major mode of transport, walking still remains the dominant mobility option in most SSA cities (7,17,18). Walking is a primary choice since many urban dwellers cannot afford a personal transport mode, two- or three-wheeled motorcycle taxis, or even paratransit options. Walking represents up to half of the daily trips in cities such as Nairobi, Dar es Salaam, Kigali, or Maseru, or even up to 80% in a study conducted in Kinshasa (17,19,20). Alongside walking, cycling is present in many African countries but, overall, not dominant in capital cities (17). Cycling suffers from a range of barriers, including the lack of financial resources to buy a bicycle, poor safety of cyclists in traffic, inadequate infrastructure, and challenges of covering long travel distances. Walking and cycling have traditionally been given low recognition and priority in policy, legislation, budget, resources, and space allocation, although this is changing (18). There is a negative perception of nonmotorised transport (NMT) in SSA countries, as passenger cars are associated with high status, wealth, prosperity, and education. At the same time, cycling and walking are considered unsafe, outdated, inconvenient, unattractive, and a mode of transport for the poor, which tend to be abandoned as incomes grow. The lack of attention toward NMT infrastructure translates into a poor road safety record in the African region, with the continent having the highest road traffic fatality rate worldwide (4). About 40% road fatalities are pedestrians, followed by 9% motorised two- and three-wheeler users, and 4% cyclists (21). In the absence of safe and dedicated NMT infrastructure, a high proportion of crashes involve pedestrians who have to cross arterial roads and streets. This situation is worsened by the absence of street lighting, lack of pedestrian crossing facilities, and poorly enforced speed regulations. Poor walking conditions further characterise transport poverty on unpaved roads getting muddy or flooded and the inconvenience of footbridges, compelling pedestrians to make long detours. In recent years, there has been increasing investments in public transport infrastructure projects, such as Bus Rapid Transit (BRT) or Light Rail Transit (LRT) in a few cities, carried by multilateral or bilateral donors. The implementation of these projects is impeded by institutional fragmentation (7), Moreover, these projects are not without contestation having been criticised on the ground of felt limited impact, perceived lack of integration of existing mobility services and workforce (7,17) or the destruction of jobs (13). In addition, the trend of investments prioritising road infrastructure is persisting while mostly benefitting passenger car users, who represent only a wealthy minority of the population (22,23). An illustration of this persisting trend is the recently built elevated expressway in Nairobi, which is available only to the population who can afford the toll fee. Although SSA countries have lower rates of car ownership, cars retain their desirable status symbol and attraction amongst high-income groups, and ownership is expected to rise as incomes do (17,24,25). In addition to private usage, passenger cars are increasingly used for ride-hailing services provided by digital platforms. This growth of private motorisation contributes to congestion and the deterioration of air quality, the latter being a particularly striking challenge in in Africa, as the region receiving the highest number of used light duty vehicles (26). This also raises issues for the end-of-life management of these vehicles Table 2 provides an overview of the challenges resulting from these drivers and trends and corresponding indicators used to deploy the AUMO project. 6 AFRICA URBAN MOBILITY OBSERVATORY – BIG DATA TECHNOLOGIES AND INDICATORS REPORT Table 2: Challenges and related indicators Category Challenges AUMO indicators Economic • Macro: traffic congestion impeding economic development, city competitiveness and attractiveness; • Macro: inefficient allocation or consumption of public financial resources; • Micro: high share of household income spent on travel expenses; • Micro: opportunities limited by insufficient accessibility. • Affordability; • Mode share; • Travel time; • Congestion; • Vehicle occupancy; • Distance travelled. Environmental • Air pollution issues impact the health of drivers, transport users and urban dwellers in general, especially those residing next to roads; • Carbon emissions; • Noise; • Public space & urban sprawl. • Transport-related emissions; • Mode share; • Vehicle occupancy. Social • General lack of accessibility; • Lack of inclusion for persons with disabilities or elderly persons; • Poor road safety; • Lack of personal security; • Situations of sexual harassment, especially faced by women; • Poor quality of life; • Congestion. • Accessibility; • Public transit reliability; • Public transport comfort; • Transfers; • Traffic Fatalities; • Perception of Driver Behaviour; • Perceived Condition of Public/Paratransit Vehicles; • Perception of crime on public transport; • Sexual Harassment. In addition to these economic, environmental, and social challenges, issues related to poor governance renders more complexities into the mobility landscape. Governance challenges include the dearth of financial resources, institutional fragmentation, and inadequate capacities relating to sustainable urban mobility. These trends result in misalignment of policies, a lack of regulation of transport supply, combined with insufficient policies, or insufficient implementation of existing policies. Lastly, all challenges are likely to worsen as the underlying factors are entrenched, e.g., urban sprawl pushed by investments in car-centric road infrastructure, congestion linked to the increase of low-occupancy passenger cars, environmental and health impacts owing to the increase of motorised second-hand vehicles, or disruptions linked to climate change effects such as floodings, a situation qualified as "increasingly dysfunctional" (4). Critical action is needed to move towards sustainable urban mobility in SSA cities. The Sustainable Mobility for All (Sum4all) Index for Sustainable Mobility shows that a significant number of SSA countries score poorly in this regard (27). A large share of SSA countries in Western Africa, Southern Africa and East Africa belong to the tier 3 countries of Group C, while some countries (Central African Republic, South Sudan, Chad, Niger) belong to tier 4 of Group D, namely the group of countries performing the lowest, worldwide (see Figure 4 below). Furthermore, the picture is worse when looking at sub-indicators for accessibility and efficiency. Most of the SSA countries are found in Group D for the universal access sub-indicator (parameters: rural access, urban access, gender). For the efficiency sub-indicator, a large share of them belongs to Group D. 7 AFRICA URBAN MOBILITY OBSERVATORY – BIG DATA TECHNOLOGIES AND INDICATORS REPORT Figure 4: SUM4All Sustainable Mobility Index (27) Table 3 provides an overview of the situation for the six countries scrutinised in the AUMO project. A substantial variation is found in their Mobility Rank, for instance, the Democratic Republic of the Congo (DRC) ranking 175 out of a total of 183 countries and Botswana ranking 109. However, some interesting similarities can be identified. All of them belong to category D, i.e., the lowest category when it comes to urban access. All countries are in group C or D for the sub-indicators of efficiency and safety. Noteworthy, all countries score more poorly in terms of air quality than greenhouse gas (GHG) emissions, owing to the still high shares of walking and cycling. This denotes an immense potential of SSA cities to shift priorities towards NMT and accelerate the decarbonising efforts in transport. Table 3: Scores of AUMO countries in the SUM4All Sustainable Mobility Index Malawi Botswana Rwanda DR Congo Nigeria Lesotho Income Group Low income Upper middle income Low income Low income Lower middle income Lower middle income Sustainable Mobility Index Score 36.0 41.1 39.5 25.8 33.1 32.8 Mobility Rank 137/183 109/183 116/183 175/183 150/183 151/183 Universal Access Group D n/a Group D Group D Group D n/a Efficiency Group C Group C Group C Group D Group C Group D Safety Group D Group C Group D Group D Group C Group D Green Mobility Group B air pollution, A GHG emissions Group B air pollution, B GHG emissions Group C air pollution, A GHG emissions Group C air pollution, A GHG emissions Group D air pollution, A GHG emissions Group B air pollution, A GHG emissions Most of the mobility challenges described are found in SSA cities, wide disparities exist within the vast geographical scope of Sub-Saharan Africa depending on economic growth and income levels (e.g., strong contrasts between South Africa or Nigeria on the one hand and Burundi or South Sudan on the other hand) and urbanisation rates (e.g., higher rates in West African countries compared to East African countries) (4). The vehicle types operated, and their modal shares do vary. These differences thus call for a differentiated analysis and the need for data. 8 AFRICA URBAN MOBILITY OBSERVATORY – BIG DATA TECHNOLOGIES AND INDICATORS REPORT 2.2 The transport data challenge The data gap(s) Researchers consistently identify a daunting problem posed by the lack of data on SSA cities (28). Similarly, researchers and practitioners consistently identify a dearth of transport-related data for African cities (7,11,14,20,29–33). This scarcity of data covers a myriad of transport-related factors, such as trip characteristics including origin and destination, modal shares, and service characteristics including travel times, alongside socio-demographic characteristics of users and trip purpose (11,14). Critical data on accessibility in African cities is lacking (7,33). Gender-inclusive data is absent or deficient since data collected on commuter trips may not reflect the typical trip-chaining that characterises the mobility of women; further, insufficient data is collected on public transport travel time and waiting times, which play an essential role in the personal security of women as users (32). In this context, transport authorities lack data to formulate evidence-based policies. Table 4 dives deeper into the factors explaining the lack of transport data, to refine the understanding of the nature and extent of data gaps. Table 4: Factors underlying the mobility data gaps Factor Explanation Cost intensity of traditional urban mobility data collection techniques Conventional data collection techniques take the form of travel surveys (onboard, at stops, or at the household level) and are conducted manually or via phone interviews require staff, time and a large amount of data (14). Most SSA cities do not conduct large-scale, regular surveys such as traffic counting, household travel surveys (18,34), or user satisfaction surveys (14). Some data are particularly costly to collect via conventional methods. Air quality data traditionally use reference stations, which are expensive and require calibration and maintenance (35). Innovative low-cost methods are emerging, such as mobile air quality sensors, but are not yet mainstream. Outdated information in the absence of frequent data update Some of the data on transport patterns are outdated, which casts doubts on their reliability in the light of particularly rapidly evolving mobility and urban patterns. For instance, the information on the modal split in Nairobi dates to 2013, when JICA collected the data in the context of the Project on Integrated Urban Development Master Plan (36). Imprecise information When data exist, there may be quality issues regarding indicators. For instance, details on the time where indicators were measured may be lacking, or a sufficient level of details on these indicators to enable meaningful comparisons (issue found in (8)). In one example, in Nairobi in 2013, motorcycle-taxis, whose growth has been significant over the last few years, were scrutinised within the aggregated category of two-wheelers, not allowing for a dissociation between bicycles and motorcycles. Lack of data on transport services owing to the characteristics of paratransit While not all paratransit services are unregulated or non-formalised, a number of such services do not have licenses or tax registrations. This may particularly be the case for for-hire modes, such as motorcycle-taxis. For instance, neither decision makers nor transport representation associations know the exact number of motorcycle taxi operators in cities such as Nairobi, Dar es Salaam, or Kampala, as some operators provide services without a public transport license, driving license, or use a motorcycle registered as a vehicle for private use only (37–40). The lack of transport representative associations, or the competition between several existing associations, may also hinder getting an overall picture. Cash payment practices do not enable data collection via digital payment means. In addition, the heterogeneity of services complicates the way in which these modes are understood. Jia et al. (14) highlight that the behaviour of paratransit providers differs from the scheduled public transport services frequently encountered in the Global North which means that modelling based on Global North practices is inadequate. Lack of data on nonmotorised transport (NMT) Data on walking and cycling is scarce and most of the current policies lack quantification or measurable goals. In a survey published in 2016 by UN Environment, 46% of officials in African countries surveyed responded that they do not report NMT successes or challenges, contributing to a deficit in NMT data (41). In addition, when reported, reporting was done through media releases or internal reports or reviews, but not via publicly available annual 9 AFRICA URBAN MOBILITY OBSERVATORY – BIG DATA TECHNOLOGIES AND INDICATORS REPORT Factor Explanation reports. In addition, reporting on NMT was often by means of media releases or internal reports or reviews, but not via publicly available annual reports. Existing data but not communicated to public authorities Stakeholders other than public institutions have data on mobility patterns but may not provide them to the government in the absence of data-sharing requirements, or the government may not be aware of the existence of this data. Such stakeholders are, for instance, digital ride-hail platforms – scarcely sharing data (42)-, asset financing companies providing access to vehicles and monitoring them, insurance companies, or electric mobility companies collecting data on patterns of fossil-fuel vehicles before starting pilots with electric vehicles, yet not sharing for reasons of privacy or business protection (43). The exact issue may differ from country to country, depending on the regulatory framework. To address this issue, the importance of data-sharing in African countries, for instance by digital minibus operators to the government, has been stressed (44). Stakeholder identification of challenges and data gaps This report reflects on challenges and data gaps that were identified through a series of activities. A participatory online workshop with all the AUMO cities took place on the 16th of November 2021, gathering 24 participants collectively discussing existing challenges in their cities and missing data, which are summarised in Table 5. Among challenges, a strong focus on accessibility, conditions of collective transport (public transport vehicle conditions, drivers' behaviour, poor experiences including sexual harassment), frequency, congestion, environmental challenges, lack of consideration of sustainable modes such as walking and cycling in decision-making, with lastly governance challenges, was identified. A further assessment of the specific data gaps in the six countries was conducted via an extensive literature review, summarised in the Policy and Planning Insights Report (Deliverable 5). Further workshops with the two Action Planning Cities, Blantyre, and Kigali, were conducted on the 14th and 15th of December 2021. 10 AFRICA URBAN MOBILITY OBSERVATORY – BIG DATA TECHNOLOGIES AND INDICATORS REPORT Table 5: Identification of mobility challenges and data gaps Current situation, challenges, and data gaps Today Where are you today? What characterises your city's mobility circumstances? - Air pollution - Long travel times - Bad driver behaviour - Irregular and unpredictable public transport - Congestion - Public transport vehicle condition - Weak institutional structure Challenges What challenges do your city need to overcome? - Reduction of ICE PT vehicles - Duplication of institutional responsibility - Lack of data - Vehicle priority - Polluting vehicles - No infrastructure for walking and cycling - No access to actionable data for policymakers - Highest influence from car users given in relation to overall decision making in urban mobility - Personal security in public transport for all users with specific attention to women and children; common situations of sexual harassment, not sufficiently addressed Data Gaps What data do you need for your desired mobility future? What transport data is missing? All Cities Participatory workshop 16.11.21 - Need for data on modal split to inform decision-making and investments - Air quality data: access to affordable air quality monitors - Data on public transport vehicle reliability - Data collection on experiences of sexual harassment Blantyre Participatory workshop 15.12.21, literature review - Constraints to conducting large-scale surveys and data analysis at both national and local levels - Only summarised data provided by external organisations or consultants - Underreporting of road crashes in the National Road Safety Council database, e.g., fatalities en-route or at arrival at hospitals, or in the absence of involvement of the police. In general, challenge to find reliable information on road fatalities and injuries Kigali Participatory workshop 16.11.21, literature review - A gap in the mobility data collection - Lack of update of most data collected via feasibility studies such as the BRT feasibility study or traffic survey, with challenges to conduct them at regular intervals - No consolidated database collating the data and displaying it temporally - Lack of coordination: no connection between ministries and organisations collecting data - Lack of quality: issues of reliability of the data, limited disaggregated data, scattered data, absence of historical data - Unclear use: challenges of using the data for planning purposes - Reluctance of app developers to share data - On the positive side, opportunities for innovative data collection via cashless payment in buses Following the assessment of transportation trends, characteristics, and data gaps, understanding the potential for Big Data in Sub-Saharan African cities requires analysing the region's state of digitalisation. Digitalisation is here understood as "the spread and use of digital technologies – the internet, mobile phones and other tools and processes- to collect, store, analyse and exchange information digitally" (45). 11 AFRICA URBAN MOBILITY OBSERVATORY – BIG DATA TECHNOLOGIES AND INDICATORS REPORT 2.3 The digitalisation challenge Digitalisation has been progressing rapidly in Sub-Saharan Africa over the last decade: significant improvements have been achieved in terms of infrastructure coverage, quality of networks, internet usage and knowledge (see Figure 5). For instance, the percentage of individuals using the internet has progressed by 20.7 percentage points between 2012 and 2020, according to the International Telecommunication Union (ITU) (46). The ITU indicates that mobile cellular coverage – the population living within reach of a mobile cellular signal – is reaching 88.4% (47). In some areas, the Sub-Saharan African region is a digital frontrunner driven by the penetration of mobile phones, the use of mobile rather than fixed broadband and the need to improve access to financial services, many SSA countries are leading in terms of mobile money transactions. A market with a higher number of providers has flourished, as shown by Figure 6. Figure 5: Sub-Saharan Africa: Enhanced Digital Access Index—Evolution of Sub-Indices (45) Figure 6: Number of mobile money services per country, 2020 (48) However, the digital divide remains very large. Compared with the global average, digital readiness in the SubSaharan African region is relatively lagging, as illustrated in Figure 7 which compiles a critical number of Information and Communication Technology (ICT) data. According to the ITU, the percentage of individuals using the Internet amount was 30% in 2020, against 59.94% worldwide (46). The divide is less for mobilecellular subscriptions – 83 subscriptions per 100 inhabitants in SSA versus 106 worldwide – but is particularly strong for ICT access at home, with a meagre share of 0.60% fixed broadband subscriptions per 100 inhabitants against a global average of 15.89% (46,49). Reasons for this digital divide include a lack of affordability, quality (low speeds) and digital skills (45). Figure 7: Digital Connectivity: country groupings under K=3 clusters Note: Authors' calculations based on various references (42, 43, 44, 45) 12 AFRICA URBAN MOBILITY OBSERVATORY – BIG DATA TECHNOLOGIES AND INDICATORS REPORT Not only is there a divide between the SSA region and the rest of the world, but there is also a considerable heterogeneity within the SSA region; this aspect receives insufficient attention (50). In one example, Figure 8 shows the percentage of individuals using the internet in the world and SSA, revealing an improvement in both geographic scopes over the last decade but a persistent and significant gap. Figure 9 refines the analysis, adding the evolutions in the six (6) AUMO countries (Malawi, Lesotho, Rwanda, Botswana, DRC, Nigeria). One country, Botswana, is above the world average. Lesotho and Nigeria are above the SSA average, while Rwanda is close to the SSA average. In contrast, the number of individuals using the internet in the DRC and Malawi is considerably lower than the SSA average. Figure 8: Individuals using the internet in the World and in SSA (% of population, (46)) Figure 9: Individuals using the internet in Malawi, Lesotho, Rwanda, Botswana, Congo, Dem. Rep., Nigeria (% of population, (46)) To understand the challenge, it is crucial to assess the situation in each of the six countries under study. Table 6 indicates the scores in these countries for key ICT indicators. Countries are presented from the lowest Gross National Income (GNI) per capita to the highest since the status of digitalisation is closely linked to the level of economic development (45). Table 6: Key ICT indicators in the world, SSA and the AUMO countries Global SSA DRC Malawi Rwanda Lesotho Nigeria Botswana Income levels GNI per capita, current USD, 2020 11077 1507 550 580 780 1100 2000 6640 Network coverage Population covered by a mobile-cellular network (%), 2020 88.4 (2019) 70.00 86.00 99.94 98.00 90.80 98.00 Population covered by at least a 3G mobile network (%), 2020 77% (2019) 54.00 86.00 98.07 98.00 74.49 97.00 Population covered by at least a 4G mobile network (%), 2020 40.00 64.57 98.07 67.00 40.53 77.00 Mobile phone access Mobile-cellular subscriptions per 100 inhabitants, 2020 106.00 83.00 45.55 52.30 81.95 72.94 99.07 162.84 Mobile broadband basket as a % of GNI p.c., 2020 32.31 20.02 6.88 6.29 1.71 1.05 30.0 59.9 0 10 20 30 40 50 60 70 1990 1995 2000 2005 2010 2015 2020 Sub-Saharan Africa (excluding high income) World 64.0 13.6 43.0 9.9 35.5 26.5 0 10 20 30 40 50 60 70 1990 1995 2000 2005 2010 2015 2020 Botswana Congo, Dem. Rep. Lesotho Malawi Nigeria Rwanda 13 AFRICA URBAN MOBILITY OBSERVATORY – BIG DATA TECHNOLOGIES AND INDICATORS REPORT Global SSA DRC Malawi Rwanda Lesotho Nigeria Botswana Mobile cellular basket as a % of GNI p.c., 2020 17.19 22.11 4.30 6.74 2.40 1.05 Mobile data and voice basket (high consumption) as a % of GNI p.c., 2020 69.46 64.58 17.71 14.89 3.53 3.17 Mobile data and voice basket (low consumption) as a % of GNI p.c., 2020 33.35 30.99 8.85 10.58 3.42 1.86 Internet use Active mobile broadband subscriptions per 100 inhabitants, 2020 23.31 35.66 42.84 64.67 41.69 95.26 Individuals using the Internet, total (100%), 2020 59.94 30.04 13.60 null 26.50 43.00 35.50 64.00 Mobile social media penetration, 2019 3.52 2.67 19.58 13.34 41.97 International bandwidth per Internet user (kbit/s), 2020 9509 null 15501 9356 8648 47553 ICT access at home Fixed broadband subscriptions per 100 inhabitants, 2020 15.89 0.60 0.03 0.06 0.14 0.24 0.03 11.04 Fixed broadband subscriptions: >10 Mbit/s null 436 12575 null 11141 2168 Fixed broadband subscriptions: 2 to 10 Mbit/s, 2020 null 7420 3337 null 9034 5409 Fixed broadband subscriptions: 256kbit/s - <2Mbit/s, 2020 null 4399 1773 null 45138 14132 Fixed broadband basket as % GNI, 2020 null 108.10 125.06 6.20 22.10 4.40 Fixed-telephone subscriptions per 100 inhabitants, 2020 12.00 1.00 0.00 0.07 0.09 0.54 0.05 5.95 Households with a computer at home (%), 2019 null null null 5.12 null 27.80 Source: Own compilation based on (46,47,49,54). The following are findings from this comparative analysis: • Connectivity levels significantly vary across these six countries. The variation is particularly strong for the number of mobile-cellular subscriptions in 2020, reaching a maximum of 162.84 per 100 inhabitants in Botswana to 45,55 in the DRC and 52.30 in Malawi. This is also the case for the use of internet, with active mobile broadband subscriptions reaching circa 95% of inhabitants in Botswana, 65% in Lesotho, 42-43% in Rwanda and Nigeria, versus 36% in Malawi and 23% in DRC. This is further reflected in the number of individuals using the internet, wildly varying between 94% in Botswana, 43% in Lesotho, 35% in Nigeria, 26% in Rwanda and 14% in DRC; • Countries with a higher GNI per capita tend to have better connectivity, with higher scores found for Lesotho, Nigeria and Botswana and lower scores for the DRC or Malawi. Rwanda, in an intermediary situation in this group of countries, achieves some of the best ICT performance, for instance, regarding the population covered by a mobile-cellular network and the population covered by at least a 4G mobile network (highest coverage), or a higher number of mobile-cellular subscriptions per 100 inhabitants than in Lesotho. Lesotho partially scores higher than Nigeria, for instance, for the number of active mobile broadband subscriptions per 100 inhabitants and internet use; 14 AFRICA URBAN MOBILITY OBSERVATORY – BIG DATA TECHNOLOGIES AND INDICATORS REPORT • As is also generally found in SSA, mobile broadband is more widespread than fixed broadband in the six countries under study. The number of fixed broadband subscriptions per 100 inhabitants is particularly low; even the highest figure for Botswana (11%) is not close to the world average (16%). This reflects the stronger focus on wireless broadband infrastructure, which is comparatively cheaper and in the absence of pre-existing telecommunication infrastructure; • Affordability remains a key challenge. In DRC and Malawi, all broadband baskets (mobile broadband, mobile cellular, mobile data, and voice) reach prohibitive levels compared to the GNI per capita, reaching even 65-59% in the case of high consumption of mobile data and voice basket. In Rwanda and Lesotho, the costs of mobile broadband basket and mobile cellular basket against the GNI per capita remain below a 7% threshold but reach 8 to 18% for low or high mobile data and voice basket consumption. In Botswana, with a much higher GNI per capita, all costs remain below a 3% threshold. As indicated by the ITU (47), this creates situations where individuals are covered by a mobile network, but do not use the Internet because of the costs, which are prohibitive compared to their revenues; • Two major data gaps are: rural versus urban connectivity and gender-focused data. Data is available at the country level but are not disaggregated to show differences between cities and rural areas. A higher connectivity rate is likely in cities, especially the capital cities, but not easy to quantify. Secondly, at SSA level, the ITU identified a considerable gender gap, particularly strong in the region. For instance, 48.3% of women and 55.2% of men used internet in the world in 2019, against 20% of women and 37% of men in the SSA region. However, no analysis could be conducted for the six AUMO countries since the gender indicators were not available: the proportion of male and female mobile phone ownership to the total male and female population, nor as the proportion of male and female Internet users to the total male and female population. This data is unavailable except for Lesotho in 2019 and Botswana in 2014. Finally, data disaggregating internet use by user age was also not available in the six countries, apart from sporadic information as in Botswana in 2014. This section shows that the use of data, particularly Big Data, in Sub-Saharan African countries, may vary from country to country, and there is high heterogeneity in mobile penetration and internet use. Impacts on data collection and appropriate answers will be explored in Chapter 3. 2.4 State of responses As mentioned in the sections above, several challenges can be identified in SSA and the six AUMO cities, but initiatives and responses from various stakeholders are emerging to address these challenges. The following section provides an overview of policy trends to promote sustainable urban mobility, government responses to address the challenges of digitisation, the data gaps, and initiatives focusing on closing these data gaps in the transportation sector. 2.4.1 Responses to the sustainable urban mobility challenge: policy trends The six countries scrutinised within the AUMO project are confronted with similar characteristics and challenges listed in Section 2.1, including a high share of paratransit and walking, lack of reliability and quality of paratransit, lack of NMT infrastructure, a high number of road traffic fatalities, congestion, air pollution and rising carbon emissions, accompanied by limited financial and organisational resources within public agencies and lack of institutional coordination. The "Role of Informal Paratransit Report" and the "Policy and Planning Insights Report," developed as part of the AUMO project (Deliverables 4 and 5), detail these challenges, as well as the policy answers and remaining gaps. In particular, the "Policy and Planning Insights Report" (20) shows that most of these six countries have recognised the challenges and developed national or local policies supporting sustainable mobility. These responses translate into short and medium-term measures addressing climate change mitigation and adaptation, road safety, air quality, urban development, and transport planning. However, the report also 15 AFRICA URBAN MOBILITY OBSERVATORY – BIG DATA TECHNOLOGIES AND INDICATORS REPORT indicates that implementation is lagging and identifies further needs to improve urban mobility (please refer to 0). 2.4.2 Governmental responses to the digitalisation and data gap challenge Section 0 has shown that connectivity issues persist, especially in countries with lower GNI per capita and that affordable access remains a problem. However, steps have already been taken in African countries to bridge the digital divide. The six countries scrutinised here have established measures towards improved digitalisation in general and in particular access to transport data (20). As a first step, governments across the AUMO countries are developing and implementing nationwide visions and plans. These range from Botswana's Vision 2036, which aims to improve digital access and develop a corresponding legal framework, to Nigeria's Agenda 2050, which focuses on digital connectivity (20). Other initiatives include the digitisation of government agencies, as Malawi is aiming for under its Digital Government Strategy 2019, or the e-Government infrastructure project in Lesotho (55,56). Rwanda, which is part of the SMART Africa initiative, targets the digitalisation of the transport sector in its 2050 Transport Master Plan for Kigali and developed a Smart City Master Plan. The Smart City Master Plan describes a concept that enables and promotes the use of ICT across Rwandan cities by providing for inclusive data-driven management and planning, efficient community-based infrastructure and services together with localised and collaborative innovation (57). In addition, countries under study have set ambitious accessibility targets and adopted universal access and service delivery strategies (47). These visions and plans also include investment in ICT infrastructure. Rwanda is leading in terms of connectivity, having 99% of the population being covered by mobile networks and 98% having at least a 3G or 4G mobile network (see Table 6). Measures from an institutional perspective include the expansion of transport institutions for data collection or the introduction of digital administrative services. Malawi's National Transport Master Plan suggests that the Ministry of Transport should play a greater role in collecting, storing, and analysing transport data for monitoring and research and is recommended to lead the development of a strategic framework and repository for transport-related data. In Lesotho the government and development partners worked together to address data demand and supply issues, related to data sharing, with projects such as the UNDP Lesotho Data for Sustainable Development project. The project focused at technical and skills capacity development, as well as methods and means to facilitate data collection, digitisation, and dissemination (58). In Rwanda, the introduction of digital administrative services, such as an integrated e-services portal by the Rwanda National Police (Department of Transport and Road Safety), are under development. This portal makes it possible to complete services such as applying and registering for a provisional driver's license test or paying fines online. A similar example from SSA, is the Transport Integrated Management System (TIMS) established by the National Transport and Safety Authority in Nairobi in 2016. TIMS is a digital online platform that stores motor vehicle registration and transfers, licensing, and inspection data, which is linked with other governmental institutions and brings together all transport sector stakeholders. Including, for instance, financial institutions, vehicle dealers and transport service operators (59). In addition, policy implementation and regulatory frameworks have been advancing in all AUMO cities. For example, Malawi has enacted the Electronic Transactions and Cyber Security Act to create a responsive legal framework for information and communications to enable competition, ICT development and Malawi's participation in the information age and economy (60). Another example include the Regulation on Governing Licensing in Electronic Communication issued by the Rwanda Utilities Regulatory Authority (RURA), which creates a legal framework to increase efficiency of licensing, processes and procedures in the ICT sector (61). To protect telecommunications users, Botswana, Rwanda, the Democratic Republic of Congo, Nigeria, and Lesotho have enacted legislation or regulations (47). The data dissemination policy issued by Statistics Botswana provides a framework for making statistical data and information available to users, including when, to whom and in what format the data should be disseminated. It also describes mechanisms for accessing statistical results and principles for distribution and publication (62). Prior to the enactment of the Data Protection Act, Botswana had no official regulations to protect personal data and privacy in relation to their individual data. This law came into effect on October 15, 2021 (63). It describes what constitutes personal data and sets out the rights and obligations of all parties involved in the processing of personal data, 16 AFRICA URBAN MOBILITY OBSERVATORY – BIG DATA TECHNOLOGIES AND INDICATORS REPORT i.e., data processors, data controllers and data subjects (64). On November 25, 2020, a law on technology and telecommunications was enacted in the DRC. As the legal toolkit lacked provisions that could ensure the protection of individuals' privacy and personal data, various measures were taken, including the establishment of mechanisms to protect personal data (65). In Nigeria, data protection is firstly anchored in the Constitution of the Federal Republic of Nigeria of 1999 and secondly, the Nigerian Data Protection Regulation (NDPR) of 2019. Furthermore, Nigeria has enacted a Data Protection Bill and published an implementing framework for the NDPR in 2020 (66–68). These aim to provide a legal framework for the protection of personal data, regulate the processing of information to identify data subjects and protect their fundamental rights and freedoms as guaranteed by the Constitution of the Federal Republic of Nigeria. The Data Protection Bill specifically applies to the collection, processing, storage and use of personal data of persons residing in Nigeria or of Nigerian nationality by automated or non-automated means; personal data processed by entities; a data controller and a data processor (69). In addition, in 2022 the Republic of Nigeria announced the establishment of a dedicated data protection authority for Nigeria, the Nigerian Data Protection Bureau (NDPB), which will be responsible for enforcing data protection regulations and managing all related data protection matters in Nigeria (68). In Lesotho the Data Protection Act sets out the principles for regulating the processing of personal data to protect and reconcile the fundamental and competing values of personal data protection. It applies to a data controller who resides in Lesotho, uses automated or non-automated means in Lesotho, or where automated or nonautomated means are used only for the onward transmission of personal data. The Data Protection Act does not apply to personal data collected during a purely personal or domestic activity, anonymised data, data collected by or on behalf of the state and relating to national security and defence or public safety, or data collected solely for journalistic purposes or for the purpose of artistic or literary expression. The law intends to reconcile the right to privacy with the rules of freedom of expression (70). In the area of data protection, Rwanda has a law on the protection of personal data and privacy and on the regulation of processing it. This law applies both to the electronic or other processing of personal data through an automated or nonautomated means and to the data controller, data processor or third parties handling the data (71). RURA requires that any licensed company wishing to outsource its systems, operations, or services to a third party must obtain prior approval from RURA (72). Moreover, there is a law that allows the public to access information from public and private organisations. This law contains the modalities to promote the publication and dissemination of information (73). In the case of Malawi, a study found that the understanding of data protection concept is limited in the country, as translation into local languages often does not fully reflect the meaning (74). Data protection is currently addressed under the Malawi Constitution and the Electronic Transactions and Cybersecurity Act of 2016. To date, Malawi does not have a comprehensive data protection law, but a draft data protection bill was published in early 2021, which experts anticipate will be introduced in parliament in 2022 or early 2023 (68). The Transport and Policy Planning Insights Report (Deliverable 5 (20)) presents a series of recommendations to foster digitalisation and improve the access to transport data. These include the creation of a multi-agency strategy for the administration of the National Statistical System (NSS) and a data platform in Botswana, the development of a consolidated database integrating information collected by different ministries and organisations with cross-sectoral relevance in Rwanda, or the establishment of an observatory for the collection and analysis of urban mobility data in Lesotho. The purpose of the preceding sub-section was to provide a general overview of the governmental response landscape in the six cities. How the measures outlined are implemented and enforced is not analysed and falls outside the scope of this project. 2.4.3 Initiatives to fill the transport data gap Over the past decade, several digital projects have been initiated across Africa to address mobility data gaps and their potential for cost-effective and convenient data collection is now widely recognised (4). Geospatial data such as roads or points of interest are one of the fundamental elements when it comes to transport data. In this respect, the Open Street Map community is significantly contributing to the improvement of data availability. Initiatives like the Humanitarian Open Street Map Team map roads, bus stops, or transport infrastructure with the help of local and remote volunteers. To validate these web-based 17 AFRICA URBAN MOBILITY OBSERVATORY – BIG DATA TECHNOLOGIES AND INDICATORS REPORT maps derived from satellite imagery, local members help to concretise and evaluate the accuracy of these maps (75). According to the World Resources Institute (WRI), at least 105 million people in African cities do not have reliable information about their transportation systems (76). The importance of mapping these systems also becomes apparent when looking at the focus areas of data initiatives across Africa. Information from academic articles and websites of organisations involved in digital and open data projects in the transport sector, such as DigitalTransport4Africa (DT4A), shows that the predominant use cases focus on the public and paratransit transport in Africa. Currently, 15 African cities have mapped their public transit and minibus taxi systems (76). Paratransit data collection includes four key dimensions: Network, infrastructure, vehicle fleet and passenger experience (14). Jia et al. describe various methods of data collection using mobile app-based approaches. These methods include network discovery surveys, roadway and facility surveys for infrastructure analysis, ridership surveys, vehicle age surveys and operating cost surveys to evaluate paratransit operations and vehicle fleets, as well as the conduct passenger experience surveys using a customised mobile application (77). In addition, cashless fare collection systems, Global Positioning System (GPS) tracking devices in vehicles and onboard cameras can enhance data availability in public transport systems (14). Many initiatives in this field aim to develop and openly share General Transit Feed Specification (GTFS) feeds. GTFS data is a standardised data specification for public transit data. The data consists of a timetable layer and a real-time layer. The schedule layer contains timetable, fare, and geographic traffic information, while the real-time layer contains arrival forecasts, vehicle locations and operational information. The format is used internationally by several transit agencies and can be processed by various software applications (78) DT4A currently provides GTFS datasets for several African cities (79). Complementing traditional household mobility surveys, mobile phone logs, or Unstructured Supplementary Service Data (USSD) surveys offer an additional way to collect data on travel demand. While initiatives that leverage Big Data are still rare, applications such as GoMetro Pro or the analysis of onboard video recordings support progress in this area. In addition, current research explores the potential of using social media feeds and machine learning to assess road safety and provide real-time information about traffic accidents in Nairobi, Kenya (80). Table 7 below shows a collection of use cases drawn from academic articles and websites of organisations involved in digital and open data projects. Table 7: Transport-related initiatives to fill the digital divide in Africa City, Country Description Result/ Potential impact GPS tracking devices Sub-Sahara Africa Across sub-Saharan Africa, several companies started to deploy GPS tracking devices in paratransit vehicle fleets. Examples include Netstar, CarTrack and MixTelematic (14). • Real-time GPS tracking and monitoring. Mobile applications & mobile phone signalling Abidjan, Côte d'Ivoire eWarren is an application designed to capture informal traffic in parts of Abidjan. DT4A will support the company in this project until 2023 (76). •Generation and publication of the informal transport network (in GTFS); •Offers passengers the possibility to get an overview of the available informal means of transport and to book seats. Gaborone, Botswana The project tests different types of data collection approaches using mobile technologies. These provide insights into the network, infrastructure, operations, vehicle fleet and rider experience of paratransit services. Data collection methods consist of Network Discovery surveys, Road & Facility Surveys, Onboard & Rank Count surveys, • Enables analysis of status quo and gaps in the system; • Provides insight into opportunities for the different public transit system elements. 18 AFRICA URBAN MOBILITY OBSERVATORY – BIG DATA TECHNOLOGIES AND INDICATORS REPORT City, Country Description Result/ Potential impact Vehicle Age & Operational cost surveys and Rider Experience surveys (14). Dakar, Senegal The study used longitudinal mobile phone data made available by SONATEL (without GPS) and Orange (with GPS). The bus data stems from the public transport operator in Dakar (81). • Estimation of passenger demand; • Enables public transport operators to analyse their public transport offerings; •Aids the efficient planning of new transit routes or extend existing routes. Nairobi, Kenya DigitalMatatus was a joint initiative between the University of Nairobi, Columbia University, Civic Design Data Lab, Group Shot, and the Massachusetts Institute of Technology. Financial support from the Kenyan government. Operational support mainly from the Kenya Institute for Public Policy Research and the Kenya Open Data Initiative (82). •Mapping of paratransit; • Creation of a public transport map; •GTFS dataset of the paratransit network. Nouakchott, Mauritania; Tetouan, Morocco; Addis Ababa, Ethiopia; Nairobi, Kenya; Accra, Ghana; Dar es Salaam, Tanzania; Tana, Madagascar Development of an Open-Source Multi-Modal Journey Planner for Semi-Formal Public Transport by the Trufi Association. • Collection and digitisation of public transport routes and timetables; • Creation of standard GTFS; • Provision of server for door-to-door route planning; •Development of an app and enabling routing. Cashless Fare Collection (CFC) Kigali, Rwanda Together with AC Group Ltd., Kigali Bus Services Ltd. introduced the Tap&Go Far Collection system on public buses in Kigali and Yaounde. In 2017, the system was used by about 670,000 users per day. The data collected has not been published and there are no known plans to do so (83). •Validation of payments; •Vehicle location, speed monitoring; • Fraud control; • optimising operations. South Africa Passengers scan their closed-loop or FairPay card when boarding taxis (14). •No cash needed; • Integration of the population into the banking system; •Generation of data. Onboard cameras & video feeds South Africa iSaha in South Africa collects camera data and interviews passengers while they are traveling (14). • Passenger counts and GPS locations; •Helps to determine the business value of the taxi operations through financial modelling. Kampala, Uganda MapUganda and Transport for Cairo jointly conducted a mapping exercise to map the paratransit system and explore street usage in Kampala. The project was conducted from 2019 to 2020 (84). Next to a mobile application called "Route Observer," the project used video feeds for traffic counts and classified vehicles with the help of Machine Learning techniques (85). • Creation of a map (mapping of the paratransit network); • Creating a GTFS with estimated travel times; •Modernisation of the minibus industry; • Integration of commercial and transport activities in the public space (86). Digital data platforms Bamako, Mali Data Transport is an Non-government organisation (NGO) operating in Western Africa. The initiative develops data collection approaches suitable for the African context • Provides collections of transit data in GTFS format & maps; •Development of an open-source editor for GTFS feeds; •Web application to visualise data. 19 AFRICA URBAN MOBILITY OBSERVATORY – BIG DATA TECHNOLOGIES AND INDICATORS REPORT City, Country Description Result/ Potential impact and provides transit data on their open data platform (87). Social media mining Nairobi, Kenya Research funded by the UK Foreign, Commonwealth & Development Office and the World Bank's Knowledge for Change Program. Social media data between 2012 and 2020 was scraped from the premium Search Tweets Full Archive API. Combination of different datasets and machine learning techniques (80). • The goal is to increase road safety; • Combination of social media data, landmarks, and roads to determine approximate crash location; •Development of a real-time road traffic crash map for Nairobi to support urban planning. 2.5 Summary The trends presented in this section highlight the importance of pursuing means towards directing the African region towards sustainable mobility pathways. Africa is positioned to exhibit the highest rates of growth in terms of urban transportation activity in the next decades, and the challenge of providing sustainable, highquality, and affordable transportation services, and the associated infrastructure and capacities, is becoming more significant. Issues related to the basic tenets of sustainable mobility (economic, environmental, social) can be seen as commonly present across the region, albeit at different states. Existing indexes (e.g., the SUM4all index) have scored the AUMO countries into the lowest categories in terms of sustainable mobility, for example. The gaps in mobility-relevant data aggravates the hindrances towards pursuing sustainability in the mobility sector in the region. These gaps are driven by various factors related to costs of sustaining data collection efforts, lack of mechanisms or willingness to share data, lack of attention provided to specific elements of the transport systems (e.g., non-motorised modes), governance-related issues, among others. The investigation of the potential for the utilisation of Big Data towards aiding the pursuit of sustainability in the mobility sector also entails the investigation of the major enablers for such technologies, such as digitalisation trends. While significant strides had been achieved in terms of improving overall digital access metrics in the recent past, the digital divide in the region remains to be significant. It is also worthwhile noting that major differences in such metrics can be observed within the region. Other dimensions that are crucial to consider are the gaps between urban and rural connectivity, and gaps relating to gender-focused data. The state of responses towards addressing mobility issues, as well as those directed at addressing digitalisation and data gaps shows that a lot of movements are happening in the region, but there are significant opportunities for accelerating such. These insights are taken towards investigating the potential, as well as the associated challenges and risks for the utilisation of Big Data in aiding the pursuit of sustainability in urban mobility in the region as discussed in Section 3. 20 AFRICA URBAN MOBILITY OBSERVATORY – BIG DATA TECHNOLOGIES AND INDICATORS REPORT 3. Evaluation of Big Data technologies and indicators used in the AUMO project 3.1 Introduction This section provides the results of the evaluation of the Big Data technologies and data collection approaches used in the AUMO project, as well as the initial set of indicators included in the AUMO portal. This section has four main parts, Section 3.3 discusses the findings from the literature review and is sub-divided to reflect the insights relating to a) Big Data; and b) sustainable mobility indicators. Section 3.4 presents the results of the interactions with experts and local stakeholders to gather additional insights relating to Big Data technologies, and sustainable mobility indicator prioritisation. Section 3.5 presents the findings from the on-the-ground implementation of the Big Data technologies and data collection approaches. Finally, Section 3.6 summarises the main recommendations based on the overall findings. 3.2 Methodology The study team conducted the following activities in relation to the evaluation of the sustainable mobility indicators and the Big Data technologies (and its applicability and potential in the AUMO cities). Review of literature The team reviewed the state of practice relating to sustainable mobility indicators (Section 3.3.2), and Big Data and urban mobility (Section 3.3.1). Drafting of an initial set of mobility indicators The results of the literature review produced an initial set of indicators to reflect the sustainable mobility indicators and the review of the challenges and priorities in the region. The indicators were used as a basis for initialising the content of the AUMO portal and were used as a guide in defining the approaches related to the data collection (e.g., survey forms; linking specific approaches to input data for specific indicators) conducted in the AUMO cities. Section 3.3.2.1 presents the selected indicators based on the literature review. Validation of the indicators with beneficiary cities and technical experts The validation exercises are composed of the activities described below which are further discussed in Section 3.4: Expert Survey An online survey that aimed at gathering insights from experts – as well as other stakeholders who work in the field of sustainable mobility - was conducted between March 18 and April 10, 2022. The study team disseminated the form through a combination of a) direct emails to a list of individuals and partner institutions whom the study partners had direct contacts with, and who were identified to have been working on the topic of Big Data and sustainable mobility (including those that had been identified who had worked on such topics in the African Region); b) a wider dissemination of the form through relevant communication channels such as LinkedIn and twitter. This survey focussed on Big Data in general, user movement analytics (or UMA, which was tested in the pilots), and sustainable urban mobility indicators. The respondents were asked questions based on their level of familiarity with these topics (i.e., those who answered that they are either "extremely familiar," "very familiar," and "somewhat familiar" with the specific topics were shown questions relevant to the topics). A total of 27 sets of valid responses were filled out. The survey form is available under Appendix E: Expert Interviews In addition to the online survey, the team conducted interviews with experts who either work in the field of sustainable urban mobility in Africa, Big Data in the context of developing cities/countries, or both. These interviews were semi-structured and were based on the main themes of the online survey, particularly on the topic of Big Data in developing cities (whenever possible, the discussions focussed on insights relating to the African region). The team pursued a practical approach for identifying experts for the interview. The primary 21 AFRICA URBAN MOBILITY OBSERVATORY – BIG DATA TECHNOLOGIES AND INDICATORS REPORT basis was the list of respondents to the survey, from which there were those who indicated that they were willing to be interviewed. In addition, a couple of other experts outside the respondents' list were interviewed as they had directly been working on the topic of mobility and digitalisation in the African region. The team interviewed twelve experts. Refer to Annex F. City Workshops The city workshops held in Blantyre (August 3-4, 2022) and Kigali (August 17-18, 2022) were also used to gather insights relating to the indicators and the application of Big Data methods from the local stakeholders in the respective cities. One session was dedicated towards the validation of and gathering additional inputs to the list of indicators that are featured in the Africa Urban Mobility Observatory portal. Another session was dedicated towards the crafting of a roadmap towards sustaining the data collection efforts that had been initiated through the project. Pilot Implementation The lessons and insights from the actual implementation of Big Data collection exercises were documented and form the basis for the evaluation of the Big Data technologies within the context of the AUMO cities. The details of the data collection conducted as part of the pilots are presented in Section 3.5. The resulting data from the pilot implementation are presented in Section 4. 3.3 Insights from the literature review 3.3.1 Big Data and Big Data technologies 3.3.1.1 Concept of Big Data Big Data is often cited as a tool to transform and revolutionise a wide range of sectors and an area of research that can accelerate progress across a broad spectrum of priorities (88). An essential first step to exploring the potential of Big Data in urban transportation is to clarify what Big Data means. When describing Big Data, literature frequently mentions the rapid increase in available data that is, on the one hand, complex and heterogeneous and, on the other hand, continuously generated and stored "from any-where, any-time and any-device" (89). A standard definition used in literature characterises Big Data by using the 3 V's: "Volume," "Velocity," and "Variety" (90–92). Chen et al. take these further by adding the term "Value" to the commonly used 3 V's, which intends to reflect the potential of Big Data to explore the immense hidden value of these complex and heterogeneous data sets (93). Wamba et al. define Big Data as "a holistic approach to manage, process and analyse 5, as opposed to the previous 3, V's (i.e., volume, variety, velocity, veracity and value) in order to create actionable insights for sustained value delivery, measuring performance and establishing competitive advantages" (94). A comprehensive description presented by Boyd and Crawford, describe Big Data as a triad of technology, analytics and mythology. According to them, Big Data is about "1) maximising computation power and algorithmic accuracy to gather, analyse, link and compare large data sets, 2) drawing on large data sets to identify patterns in order to make economic, social, technical and legal claims and 3) the widespread belief that large data sets offer a higher form of intelligence and knowledge that can generate insights that were previously impossible, with the aura of truth, objectivity and accuracy (95)." Given the characteristics of Big Data, the phenomenon both holds tremendous potential for all walks of life and industries, and it brings several challenges, ranging from data privacy to the need for technological advancement. Due to the vast and complex amounts of data from various sources, it is necessary to provide appropriate technologies and methods which are sufficient for storing, managing, analysing and visualising Big Data (96). 22 AFRICA URBAN MOBILITY OBSERVATORY – BIG DATA TECHNOLOGIES AND INDICATORS REPORT 3.3.1.2 Big Data and Urban Transportation This subsection looks at possible and potential applications of using Big Data in urban transportation. It outlines applications, some of which are already feasible and in use today and others that reflect trends in the advancement of Big Data in urban transportation. When examining two decades of literature on using Big Data applications for sustainable urban management, researchers identified smart mobility and smart traffic as two of the key dimensions for sustainable urban development. This systematic literature review shows that the terms "traffic management," "urban transport," and "transportation planning" are among the most frequently used phrases in the peer-reviewed literature on data-driven and sustainable urban management (97). To further explore the scientific landscape of Big Data in urban transport and mobility, we conducted a bibliometric analysis, including scientific literature available on the Web of Science (WoS) platform. WoS provides a multidisciplinary database with more than 150 million entries, which allows for a comprehensive search (98). The bibliometric analysis was performed using the "Bibliometrix" software package in R (99). With a defined search strategy, the number of articles analysed on Big Data and urban mobility amounts to about 2000. Scientific production of Big Data literature related to urban transport first appeared on WoS with one publication in 2011 and recently reached an all-time high with 454 publications per year in 2021 Figure 10: Scientific production on Big Data in urban mobility Figure 10, left). The most prolific countries are China, with around 38% of total publications since 2011, followed by the United States of America (US) with 12% of total publications (Figure 10, right). Productivity per country is measured based on the main author of each publication. Using China as an example, 525 publications are single country publications, which means that all authors are associated with an institution in China. In comparison, 147 publications are multi-country publications, which means that in addition to the lead author from a Chinese institution, authors from institutions in other countries were contributing to the publication. Figure 10: Scientific production on Big Data in urban mobility The analysis of the most frequent keywords and keyword combinations (based on keywords defined by authors) shows that Smart Cities, the Internet of Things, Deep Learning, Cloud Computing, and Big Data Analytics are among the key topics in the research field. Keywords such as "human mobility," "social media," and "mobile phone data" are among the emerging topics. Figure 11 provides an overview of some of the most used keywords visualised in a network based on the frequency of co-occurrence. The illustration shows that while Big Data is used frequently in the context of management, the Internet, Big Data analytics, or prediction, terms such as mobility, travel, transportation, city, or urbanity often appear in combination with time, quality, demand, behaviour, or patterns. 23 AFRICA URBAN MOBILITY OBSERVATORY – BIG DATA TECHNOLOGIES AND INDICATORS REPORT Figure 11: Keyword co-occurrences for Big Data in urban mobility The following section takes a closer look at the transport dimension by providing an overview of Big Data applications for urban transport. (Big) Data sources for urban transport While Big Data is an emerging topic in urban transport, data-based modelling and analysis have supported passenger and freight transportation planning for decades. One example is the four-step model, which provides a framework to model transport based on individual decisions and travel behaviour divided into trip generation, trip distribution, mode choice and trip assignment. Since data collection is often time-consuming and costly, Big Data can add immense value for modelling, simulation and predicting transport. Literature exploring Big Data for public transportation applications looked closely at relevant data sources for the fourstep model. While traditional data sources such as household surveys, censuses, on-board surveys, and travel diaries are still relevant, combining them with social media data or real-time sensor data is a game-changer. This combination with social media data or automatically collected sensor data such as fare collection, passenger counts, or vehicle locations offers the opportunity to gain deeper insights and can be used as historical data sources and as real-time information for traffic management and planning (100). Research has shown that combining Big Data sources with traditional data is common in most use cases as the two types complement each other (101). Public sources, individual sources, and sensor devices are identified as the three primary data sources for Big Data in urban areas (97). Table 8 below adapts this categorisation with a particular focus on transportationrelated data sources. Table 8: Big Data Sources for urban transport adapted from Wu et al. 2022 Category Transport related examples Requirements Sources Public sources - Geo-referenced urban structure data, e.g., Land-use and zones - Census, Household Travel surveys, employment, economic activity - City Statistics and forecasts, e.g., environmental - GIS data and maps, e.g., road networks - Information on points of interest and traffic generating poles - Traffic surveys, historical traffic data - Transit system details, e.g., GTFS data - Web data, e.g., ticketing websites - Open data portals - Governmental statistics - Data provision of transport operators - Surveillance systems - Web data mining skills to access public administration repositories or other websites (e.g., cultural calendars) (101–106) 24 AFRICA URBAN MOBILITY OBSERVATORY – BIG DATA TECHNOLOGIES AND INDICATORS REPORT Selected Big Data applications for urban transport across the globe Advanced data-driven applications in urban transport serve various purposes, ranging from initiating shortterm actions by providing real-time information about traffic irregularities or spontaneous gatherings via social media data to mid-term and long-term strategic use cases (116). In the mid-term, Big Data applications can support optimised frequency planning in public transport, timetable development, or provide input for vehicle and staff capacity planning. In the long term, Big Data can inform urban transport planning for developing demand-responsive infrastructure. Most Big Data applications combine different types of data, including traditional and Big Data, with advanced techniques to generate insights for urban transportation planning, coordination, or monitoring. This subsection provides an overview of Big Data applications in urban transport from different regions worldwide. Building upon the results from the bibliometric analysis, it includes use cases from China and the US, as the two most productive countries in terms of scientific production on the topic, as well as examples Category Transport related examples Requirements Sources - Information on large-scale events, e.g., public/calendric events, road traffic intersections, current/planned infrastructure developments, emergencies Individual sources - Geocoded social media data - Digital footprints of mobile phone users - Collaborative applications & Crowdsourcing (e.g., Waze) - Payment tracking data - 3G, 4G, 5G infrastructure - Data mining skills and infrastructure - Provision of data by private actors such as banks or mobile phone companies (92,101,1 03,106– 108) Sensor devices Road traffic system: - Navigation system data - Traffic signal control - GPS data, Vehicle sensing data, Automated Vehicle locations (AVL) and trajectories - Self-driving data - Advanced driver-assistance data - Connected cars data - Transport logistics data - Parking data - Traffic counts and intensity - Accidents - Travel time consumption data - Video/ Image data - Weights sensors - Pedestrian traffic - Trip data and other details from private transport operators, e.g., bike-sharing systems, scooter traffic data Public transport system: - Integrated automatic fare collection (AFC) - Automated passenger counts (APC) - Individual trip record data from using smart cards in vehicles or stations - Tracking of departure times/trip length by using WIFI log-in information Further sources: - Meteorological data - Carbon Emission data - Smart cards - Radio frequency identification (RFID) - Electronic Registration Identification (ERI) - Closed-circuit television (CCTV) cameras, e.g., on major roads - Platform infrastructure - Analysis and storage tools - Sensors on roadways - Wi-Fi - Bluetooth trackers - Mobile and stationary GPS tracking devices - Collaboration with private operators/ full disclosure of trip records - Inductive loop detectors at major road junctions (92,100– 103,106,10 7,109– 115) 25 AFRICA URBAN MOBILITY OBSERVATORY – BIG DATA TECHNOLOGIES AND INDICATORS REPORT from Australia and Europe. Collectively, these examples from cities around the world provide an overview of Big Data applications currently deployed or planned across urban transportation systems. Please refer to 0 Case 1 – Lisbon, Portugal The combination of various multimodal transport and context-specific datasets offers the potential to make mobility planning decisions more transparent and inclusive, strengthen coordination between public transport operators and dynamically adapt transport supply to the evolving dynamics of urban transport (106). To advance knowledge in this area, several stakeholders in Lisbon have joined forces, including the Lisbon City Council, local transport operators and national research institutes. The integrated multimodal fare-collection system of Lisbon, which includes bus, tram, metro, rail, and inland waterway, allows for cross-modal and multimodal trip tracking across the public transport network. Data used in the analysis include traffic data from sensors, public transit data from smart cards carried by passengers and GPS tracking of public transport vehicles. Furthermore, it involves information on the city's bike-share system and alternative new modes of transport, such as scooters, provided by private operators. In addition, the City of Lisbon's open access data platform allows for collecting various contextual data sources that provide additional insights into the dynamics of urban transport. When available, the temporal and spatial dimensions and the user and operator dimensions are relevant for further analysis. Combining the above-mentioned data, the project conducted several multimodal traffic and spatiotemporal data analyses. These include the dynamic inference of origin-destination traffic flows, identifying bottlenecks in the overall transportation network, or providing descriptive statistics on commuter demand, walking distances and trip durations. Identifying mobility bottlenecks can, amongst others, offer insights to tactical and strategic mobility planning. Further applications include identifying bus stops in case of missing and existing multimodal views and extracting mobility patterns. In addition, an online visualisation tool provides an analytical instrument that can support urban mobility planning in prioritising public transport and integrating active modes in a multimodal system. Case 2 – Melbourne, Australia Case 2 analyses pedestrian travel behaviour in the City of Melbourne (CoM) (102). For the study, the researchers use sensor data collected per minute in the central business district and published by the CoM. Both historical and real-time generated data from the pedestrian counting system and information about the location of pedestrian sensors were used in the analysis. The pedestrian sensors in the city count the number of pedestrians passing by scanning the areas below them and transmitting the collected data to a central server every 10 to 15 minutes. These data sets comprise more than 50,000 million observations, of which the researchers analysed 5 million using Excel and Power BI. Due to the limitations of the sensor system, implementing advanced techniques such as machine learning was not possible in this use case. The results of the analysis offer insights into daily patterns of pedestrian traffic, the correlation of traffic with population growth and the identification of pedestrian hotspots (points with high pedestrian concentrations) historically and in real-time. Combined with other datasets from public transport or bicycle sensors, the analysis can also allow insights into the multimodal travel behaviour of citizens. The insights and trends gained on how people move around the city can support future infrastructure development and planning. In addition, the analysis provides incentives for CoM to advance the digitisation of the city further. While the analysis performed in the CoM only considers a fraction of the available data, the study shows the potential of more advanced Big Data analysis of pedestrian movements through the further development of sensor technology and more advanced software tools. In addition, integrating data from cell phones, social media, or other wearable devices offers further potential in Big Data applications. Case 3 – Shenzhen, China With an average scientific output of 66 publications per year since 2011, China is by far the leading country in the research field of Big Data in urban mobility (see Figure 10). This output includes a wide range of thematic focus areas and methodologies. Examples include the development of a low-emission intelligent transportation system comprising a vehicle emission model, a traffic flow prediction method, a low-emission 26 AFRICA URBAN MOBILITY OBSERVATORY – BIG DATA TECHNOLOGIES AND INDICATORS REPORT navigation algorithm based on Big Data, and machine learning techniques (104). The use of Big Data to improve traffic flow prediction and identify critical road segments by implementing prediction algorithms using real-time and historical data (104). The analysis of private vehicle movements provides insights into mobility patterns using "Electronic Registration Identification" technology, which provides data collection for all vehicles active in an urban transportation system. Results include trajectories segmented into trips or identifying attractive areas with high travel demand and traffic volumes (109). Such findings can be used to support the optimal design of urban transportation planning to address the challenges of traffic congestion and promote the development of sustainable cities (117). Geospatial Information Systems (GIS) analysis, complex network analysis, or structural equation modelling can be used for modelling spatial interactions. Possible applications include analysing public transport passenger flows between cities to examine cross-city interactions and strengthen functional linkages or analysing the interaction between land use and urban transport, e.g., to explore the impact of land use on mode choice (118–120). An example of modelling spatial interactions can be seen in the study by Zhao et al. (119), which examines the impact of land use on bicycle use based on a combination of spatial and crawled trip data from a major freefloating bike-sharing provider in Shenzhen. Specifically, this includes land use data such as land use types, land use mix, and land use connections (such as bicycle lanes or road intersections), along with bicycle use data such as trip duration and distance. The trip data includes more than 7.8 million observations over 191 days. Amongst others, findings include that land use, particularly the amount of green space, significantly impacts the frequency of bicycle use in Shenzhen. Factors such as intersection density contributed to longer trip duration, and the number of stations was positively related to trip frequency and distance. Case 4 – Atlanta, USA As Big Data research in urban transportation has grown over the past decade, the topics studied have evolved. These range from feasibility studies such as using GPS data from 460 cabs to guide decision-making on the deployment of electric cabs in the city of San Francisco (121), to assessing how walking behaviour is influenced by walkability factors, using computer vision to quantify street-level factors from street imagery in Atlanta (122). The study focuses, among others, on the extent to which the inclusion of street-level factors improves the ability to explain pedestrian mode choice. Street-level urban design factors consist of information about the structure of the streetscape, such as the ratio of buildings to streets, greenness, or sidewalk-to-street ratio. To determine the walkability of an area, typically, neighbourhood-level urban form factors, such as population density, land use diversity, and street connectivity, are used. While these factors are well suited for assessing accessibility, they do not adequately address the assessment of walking needs such as safety or comfort. For this reason, neighbourhood- and street-level factors obtained through semantic segmentation of Google Street View imagery are combined to improve the prediction of overall walkability and resulting walking behaviour. 3.3.1.3 Big Data in the African Region As this report aims to investigate the use of Big Data in urban mobility to create a more inclusive and sustainable urban transport in the selected African cities, a cornerstone is the exploration of Big Data applications in Africa to date. As described above, for Big Data in urban mobility, a bibliometric analysis was conducted using a structured search strategy on the WoS platform, as contained in Appendix A: . However, when narrowing down the research field to Big Data in urban mobility in Africa, only nine articles were found to meet the defined search criteria. Given this small number of results, the focus of the bibliometric analysis centred on Big Data in Africa in general to provide an overview of the relevance and development of the topic. The following subsection provides an overview of the development of Big Data research in Africa. Research on Big Data in Africa commenced in 2013 with one article published by a multinational research team from South Africa and the United States. While publication activity began in 2013 and 2014 with one publication per year, this number increased to an all-time high of 64 articles by 2020 (Figure 12). The main research areas covered by the scientific literature include environmental science and ecology, technology, enterprise, and economics, followed by computer science and remote sensing. In contrast to the above 27 AFRICA URBAN MOBILITY OBSERVATORY – BIG DATA TECHNOLOGIES AND INDICATORS REPORT analysis on Big Data in urban mobility, China ranks fourth among the most productive countries, while South Africa, the US, and the United Kingdom (UK) are leading in this area (Figure 12). Figure 12: Scientific production (research on Big Data in Africa) Figure 13 provides an overview of the countries' cooperation in the field of research (Top 30 countries). It can be seen from the figure that in addition to South Africa, among others, authors from Cameroon, Ethiopia, Kenya, Tanzania, Morocco, and Nigeria are active in this field. The figure illustrates that there are currently two groups of countries; the colours indicate which countries belong to a group and consequently work more closely together. Figure 13: Country collaboration (research on Big Data in Africa) As shown in Figure 14, seven universities in South Africa are among the top 10 publishing institutions (affiliation of lead author). The University of Cape Town and the University of Johannesburg are leading the way, with 41 and 36 publications, respectively. 28 AFRICA URBAN MOBILITY OBSERVATORY – BIG DATA TECHNOLOGIES AND INDICATORS REPORT Figure 14: Leading research institutions (research on Big Data in Africa) The most frequently used keywords in the research area are divided into four groups (indicated by the different colours in Figure 15. The most used keywords range from general topics related to Big Data such as "analytics," "models," or "technologies," to themes such as "preservation", "patterns", and "health", to topics such as "Big Data analytics" and "business performance", to name a few. Analysis revealed that the terms "transportation," "travel," and "mobility" were hardly used, indicating that Big Data research in the transportation domain is still underrepresented. Overall, the terms "transportation," "travel," or "mobility" appear only ten times among author-based keywords and four times among WoS keywords. Figure 15: Keyword co-occurrences (research on Big Data in Africa) Aria et al. describe the four quadrants – niche, engine, emerging or declining, and basic themes – as follows. Niche themes are generally well developed but still insignificant to the area studied. Motor themes or hot topics are well developed and relevant to structuring the conceptual framework of the domain (123). On the other hand, peripheral themes, i.e., emerging, or declining themes, are not fully developed or are only moderately relevant to the domain; and fundamental themes are significant to the domain and crosscut the different domains. The underlying methodology involves a word network analysis of keywords combined with clustering (123). The analysis of the thematic landscape shows that keywords such as patterns, growth, productivity, and conservation are among the hot topics for Big Data in Africa. In contrast, topics such as "health," "risk," and "artificial intelligence" are right on the border between emerging and foundational topics. Figure 16 illustrates the thematic landscape created using the "Bibliometrix" package in R (99). 29 AFRICA URBAN MOBILITY OBSERVATORY – BIG DATA TECHNOLOGIES AND INDICATORS REPORT Figure 16: Thematic Map (research on Big Data in Africa) 3.3.1.4 Big Data challenges The study team identified several Big Data related challenges through the literature review. The identified challenges supported structuring the surveys and interviews conducted with subject matter experts. Taking off from the insights in Section 3.3.1.1, specific challenges relating to the Big Data concept itself has been documented in various papers. Cosgrove et al. point to a broad definition of Big Data as data sets that are significantly large and cannot be stored nor analysed through traditional processing and storage methods (124). Manyika et al. define the Big Data concept as pools of unstructured and structured data that can be analysed, aggregated and communicated (125). Structure and unstructured data can be computer- or machine-generated or human-generated and can encompass data from sensors, weblogs, human-inputted data, satellite images, photographs and video data, radar or sonar data, social media data, and mobile data, among others. Structured data sets are referred to those data sets that had been produced with the relation between the data and the population these refer to had been specified, while unstructured data sets do not necessarily follow an obvious sampling framework or experimental design (126). De Mauro et al. gave a framework as to how different Big Data definitions and descriptions can be grouped by their characteristics (e.g., based on the "V's"); by the technological and processing requirements (e.g., concepts such as "scalable architecture"; "serious computing power"); and based on the impacts of the data on societal advancements (127). Mayer-Schonberger and Cukier, for example, focus on how Big Data can shift the ways we analyse information and transform how we understand and organise society (128). Based on these classifications, De Mauro et al. proposed that Big Data represents "information assets characterised by such high volume, velocity and variety to require specific technology and analytical methods for its transformation into value"(127). Sivarajah et al. emphasise that the main challenges relate to analysing Big Data in a way that brings "Big Value" (129). Sivarajah et al. refer to process challenges as those encountered while processing and analysing the data, which emanate from the usually unstructured (129). Carbone et al. discuss the following requirements that are related to the needs of Big Data pilots that are happening in the European region(130): Iliashenko et al. further propose two classes of Big Data that is relevant to the transportation field based on the form of data collection: static and dynamic (131). They refer to static Big Data as data that is recorded, processed, and transmitted for further processing and ultimately for interpretation through static/immovable sensors (e.g., cameras), which capture data that falls into their specific directional focus. In essence, the data is highly local. Dynamic Big Data refers to data obtained from various sensors and devices that are not tied to specific locations and are constantly in motion (e.g., mobile phone sensors used in the UMA). This offers advantages in terms of the self-sufficiency of the data – as one stream of information can provide more information about the object under study - and offers more extensive possibilities. 30 AFRICA URBAN MOBILITY OBSERVATORY – BIG DATA TECHNOLOGIES AND INDICATORS REPORT Escudero et al. emphasise that volume is not the only defining feature of Big Data, but the spontaneity of the data generation enabled by interconnected devices (126). The evidence of the multiple definitions of what Big Data is, combined with the layers of complexities that arise when such a concept is applied in specific thematic areas or sectors (e.g., urban mobility), poses a significant hindrance in terms of initiating activities in relation to Big Data. Hadi et al. discuss semantic-related challenges related to extracting meaningful information from large volumes of data (132). Management-related As one of the key features of Big Data is its large volume, enabling and managing the processes related to handling such high volumes of data can result in challenges and need to consider proper resources (e.g., staff, time, infrastructure, and technologies) required to enable the effective use of such data. In cases where different data sources are to be combined, practical issues related to data formats and coding languages related to data generation, storage, handling, and analysis must be considered. The multi-layered nature of Big Data essentially entails that data sets can grow exponentially and brings up the necessity for Big Data storage management (133). From the perspective of the application of Big Data technologies for improving urban mobility in developing cities, the complexities brought about by the scale of the data, the variety of data and the velocity of the data can result in significant challenges related to data integration, analysis and ultimately in ensuring the usefulness of the data for addressing specific goals. In the case of applying Big Data technologies to aid policies and decision making, operating in bureaucratic environments, and considering hierarchies can pose significant challenges as well (126). Effective interaction between decision-makers and technical stakeholders needs to be established. Governance approaches and structures that take into consideration both the public and private realms are required to drive the adoption of such Big Data technologies and applications. Challenges towards ensuring that the appropriate skills and capacities necessary for governing Big Data are also critical to be addressed. Accompanying the Big Data revolution is its algorithmic counterpart consisting of machine learning and artificial intelligence, which are essential for utilising Big Data. Such techniques are quite valuable in terms of conducting predictive analytics toward discovering patterns and making predictions (126). Skills relating to Big Data and analytics are at the top of the list of critical skill shortages. For example, in the European Union, over 496 thousand job vacancies were unfilled in 2017 (134). There are also data literacy gaps (e.g., in the relevant workforces), as well as participation gaps that might exist across the population. This is particularly important to consider within the contexts of developing regions, including Africa. Analysing the volume of data made possible through Big Data technologies requires processing methods beyond traditional statistical analysis techniques (127). Carbone et al. corroborate this, as they identify "the lack of Big Data" skills as one of the key challenges towards adopting Big Data technologies(130). Chourabi et al. also identify the lack of relevant (information technology-related) skills as a key challenge (135). Aside from the challenges related to personnel capacities and skills, there are also challenges that relate to institutional roles and set-up. The emergence of such technologies and embedding them into policymaking processes raises additional challenges related to salient aspects such as data ownership, control and management of the processes (136). Höchtl et al. posits that to the positive effects of Big Data, organisational set-ups need to be prepared for considering the volume and velocity of Big Data – which is generally an issue for public authorities (137). Therefore, exploring partnerships that involve other parties is crucial in transitioning to an evidence-based, data-driven decision-making process. Chourabi et al. identified management and organisational challenges relating to "smart city initiatives" which might be significantly relevant when to the application of Big Data technologies - due to the emphasis of instrumentation and interconnectedness in smart city concepts - within the context of aiding urban mobility planning and decision making such as turfing and conflicts, resistance to change, competing, or the lack of alignment of goals, lack of cross-sectoral cooperation, lack of inter-departmental cooperation (135). 31 AFRICA URBAN MOBILITY OBSERVATORY – BIG DATA TECHNOLOGIES AND INDICATORS REPORT Infrastructure-related The utilisation of Big Data for purposive applications towards addressing specific issues relies on technological and infrastructure-related issues. The distributed nature requires specific technical requirements for transmitting big quantities of data (138).This includes aspects related to the technology stacks such as software and hardware for storage, as well as servers with adequate computing and network capacities (130). Established data storage and processing technologies, such as databases and data warehouses, are becoming inadequate in handling the amount of data that is being generated (129). For example, Hadi et al. stress the importance of open application programming interfaces (APIs) at the core of Big Data architecture, as well as the availability of integration services (132). They also stress the importance of redundant physical infrastructure to support unanticipated volumes of data. The physical infrastructure differs as it can be based on a distributed computing model wherein the data can be physically stored in different locations. Such can also result in additional complexities in relation to existing data-related regulations. The importance of such infrastructure is increasingly becoming prominent globally. The European Commission estimates that 80% of the processing and analysis of data is now taking place in data centres and centralised computing facilities (134). It also deems that a new paradigm that brings data closer to the users (e.g., through Internet-of-things) will also bring a new set of challenges, such as those related to cybersecurity. Carbone et al. propose supporting the adoption of free and open-source software to avoid licensing costs and to recognise the need (and anticipate the costs associated with) software maintenance (130). Policy-related The discussions by Chourabi et al. regarding the policy-related challenges that confront smart city initiatives are also valuable for investigating the challenges related to Big Data in aiding urban decision-making (135). They refer to political components and external pressures (e.g., policy agendas) that may affect the outcome of information-technology-related initiatives. The removal of legal and regulatory barriers toward the smooth implementation of such initiatives and maximising the utility of the outputs are much needed. Höchtl et al. discuss how applying Big Data within existing regulatory landscapes can be challenging, as the balance between the societal benefits of using Big Data and the potential harm to privacy (and other values) is difficult to achieve (137). Carbone et al. identify that there is a necessity for common data formats and the creation of shared repositories to be able to fully understand the real value of Big Data (130). They also discuss the necessity to enable a functional environment for securely accessing and storing sensitive and confidential data at the raw level to unlock the analytics that can be done on fine-grained data. At the regional level, they propose a normalisation of the legislation on the use of data of public authorities. People and Communities-related Challenges related to people, being either the sources of the data, or the beneficiaries of the outputs that emanate from the use of Big Data have also been included in the literature. In this case, concerns regarding data privacy protection are a critical challenge identified by various researchers (95, 96, 98, 105, 106). Sensorbased data, which can potentially be significantly relevant to the mobility sector, essentially can contain microscopic data which can be useful in analysing and implementing targeted schemes and interventions, but the presence of such can also raise concerns about data privacy which then relate to the risks of misusing the data (126). Chourabi et al. (2012) emphasise that addressing the topic of people and communities in such technology applications is critical and traditionally has been neglected. They argue that it is crucial to ensure that "members" of the city should be referred to not only as individuals but also as communities, so that the communal aspirations and needs are appropriately recognised and relevant challenges such as the digital divide, information and community gatekeeping and participation and partnerships, are addressed. 32 AFRICA URBAN MOBILITY OBSERVATORY – BIG DATA TECHNOLOGIES AND INDICATORS REPORT 3.3.2 Sustainable mobility indicators As part of the literature review exercise towards the identification of the initial set of indicators for the AUMO portal, relevant global and regional development-related processes, as well as other initiatives that focus on measuring urban mobility indicators (e.g., including those that aim at benchmarking) were initially scoped (see Annex D The initial set was also intended to guide the development of the data collection instruments (e.g., survey forms used in the AUMO cities). The study team collated a list of more than 650 indicators from different sources, as contained in Annex D. To produce a shorter list, a screening process was carried out to identify potential links between the indicators and the primary data collection methods used in the AUMO project (UMA, USSD/SMS survey, light field studies). Essentially, relevant indicators primarily based on existing datasets (e.g., through desk research) were eliminated from this exercise. A summary of the selection process is depicted in Figure 17 below. Figure 17: Sub-steps in the Selection of the Initial Indicators for the AUMO Web Portal The screening process resulted in a shorter list of 150 indicators. Duplicates were grouped, and further screening was done based on the possibility of calculating the indicators using other methods and datasets outside the project's scope. The most relevant and related indicators (to the data collection methods of the project) were then selected as the main recommendations to be included in the demo phase of the project. Other potentially important and/or highly feasible indicators have been noted for further assessment and included in the disseminated expert survey. It is interesting to note that the different initiatives tend to group the indicators into different categories. These include indicators grouped according to the following criteria: 1) relevant impacts and/or externalities (e.g., environment, energy, road safety, health, climate change, etc.), 2) transport system characteristics and service levels (e.g., availability, convenience, efficiency, comfort, and safety), 3) status of measures implemented (e.g., clean fuels and technologies, standards, mixed development, etc.; avoid, shift, improve). For the AUMO project, it was decided by the team that a simplified approach for categorising the indicators be used in the initial phase to minimise complexity and confusion, as discussed in Section 3.3.2.1. 3.3.2.1 Selected indicators The following list of final indicators are derived from the exercise that was described in the previous section. These were used in developing the data collection instruments that were ultimately used in the tests in the AUMO cities. Section 3.5.3.1 summarises how the questions adopted in the conventional survey, for example, relate to relevant indicators. Figure 18 shows the initial set of indicators included in the AUMO portal. The definitions and other details pertaining to these indicators are found in Annex E. Figure 18. AUMO Initial Set of Indicators 33 AFRICA URBAN MOBILITY OBSERVATORY – BIG DATA TECHNOLOGIES AND INDICATORS REPORT 3.3.3 Summary of the key findings The literature review has investigated various aspects relating to Big Data, its applications in the field of urban mobility, and how relevant research has been evolving, particularly in the African region. Big Data combines collecting, processing, and visualising large amounts of data. The availability of data can fuel new trends in understanding and providing solutions that match the needs of the end-users (140). Big Data in urban mobility • Evidence is present in the literature about the multitude of beneficial use cases for applying Big Data in urban mobility. It also reflects the diversity and complexity of the different types of requirements that are needed to operationalise the use of Big Data in the field; • While a rich set of research papers focusing on Big Data in urban mobility has been found at the global level, only a handful of such papers focusing on Africa were found. However, the general trends in the research work on Big Data (in general) in Africa point toward a rising interest in the subject; • The literature on Big Data reflects diversity as to how the concept is being characterised. Some definitions focus on capturing the essence of the data generated itself, while some go beyond the data characteristics and encapsulate related processes, the value addition created by the data, and the requirements that are needed to generate and utilise such data; • The variations in the descriptions can also prove to be problematic in communicating what Big Data is. The other types of challenges in the literature can broadly be categorised into the following: management, infrastructure, policy, people, and communities. Sustainable mobility indicators • The review of relevant global and regional processes related to sustainable mobility indicators shows a wide range of indicators and indicator categories. These insights, coupled with insights emanating from a mapping exercise of how the different data collection methods used in AUMO would feed into such indicators (Annex D, and the guidance set by the identified priority mobility issues as discussed in Section 2, were used as a basis for selecting a preliminary set of indicators; • From a mobility context, identifying the right indicators can support decision makers to complement traditional data collection techniques with Big Data techniques. Using Big Data techniques, the possibility to generate granular data (e.g., UMA) can feed into such indicators and open up significant opportunities to support decision makers to develop plans, policies and projects that support the pursuit of sustainable mobility more efficiently and effectively. 34 AFRICA URBAN MOBILITY OBSERVATORY – BIG DATA TECHNOLOGIES AND INDICATORS REPORT 3.4 Insights from the expert surveys and interviews, and consultations with local stakeholders This section provides a summary of the salient points that were gathered from the interactions with the subject matter experts (based on the survey and interviews), as well as the insights from the local stakeholders, primarily collected through the city workshops held in Blantyre and Kigali (see Appendix C: ). 3.4.1 Big Data and Big Data technologies The expert survey and interviews, as well as the local consultations, were also used to gather deeper insights, context-specific views about Big Data, and relevant aspects that relate to Big Data use cases in the urban mobility realm, the associated challenges, risks, and benefits. 3.4.1.1 Concept of Big Data The following summarises the key insights from the subject matter experts related to the concept of Big Data: • The experts' insights reflected the importance of having a common definition for Big Data. One insight was provided about the misconception about Big Data being referred to as any data set that cannot be opened through traditional spreadsheet programs and that the importance of recognising the nature of the data (i.e., volume, heterogeneity) and the need for advanced storage, evaluation, and analysis techniques, should instead be stressed; • Big Data requires it to have significant volume (which can be relative), its nature of continuously being generated and its reliance on constant feeds and updates (e.g., through sensors, radar, satellites, and apps), and thus continuous maintenance is critical; • Due to the unstructured, dynamic, unfiltered nature of Big Data, the derivation of value from it requires specialised skills, technologies, and infrastructure; • The prioritisation exercise for pursuing Big Data initiatives for deriving useful information for responsive decision-making needs to consider the local context. For example, public transport stop data in developing cities may only contain a few static data points, but the same may not be the case in a Metropolitan area in a highly developed city. • The concept of Open Data needs to be adopted to capitalise on the potential benefits of Big Data fully. The usability of the data for doing analysis is more important than the quantity. Accessibility and affordability should be aspects that need to be attached to Big Data and should be opened with appropriate limits that protect privacy. Open data standards and networks enable the broader utilisation of data sets, including Big Data, towards aiding sustainable mobility. 3.4.1.2 Use cases The experts were asked for their insights regarding impactful use cases wherein Big Data can effectively be used for urban mobility decision-making in developing cities, particularly in the African region. Urban and transport planning • Big Data opens the significant potential for improving the overall urban and transport planning. Big Data costs can be significantly lower than traditional travel surveys used in planning processes. Big Data techniques in rapidly growing cities can result in the most impactful insights toward infrastructure and transport services planning; • Big Data can also aid the analysis of the interlinkages between urban mobility and different societal, infrastructural, and economic factors, which can help shape policies and plan for infrastructure towards more sustainable pathways for mobility; • Big data sets containing origin-destination data can be used to better understand people's movement and thus aid the planning of transportation services and infrastructure; • The availability of mobility data observatories opens the possibility for consolidating, analysing, and sharing data that can be useful for various applications, including those that pertain to urban and mobility planning that can improve the overall state of urban transport, particularly in developing cities. 35 AFRICA URBAN MOBILITY OBSERVATORY – BIG DATA TECHNOLOGIES AND INDICATORS REPORT Monitoring and improving mobility services and infrastructure • In Nairobi, a recent study was carried out using sensors that detected movements using the Wi-Fi signals of smartphones in the central business district. Such data enabled the analysis of passenger movements on a 24/7 basis, including origin-destination movements, passenger counting at the zonal level, time of stay in certain zones, and travel speed variation at the zonal level. Such data can also be used in informing the management of public transport services, and planning for public transport infrastructure (e.g., stops). One of the experts shared that in Kampala (Uganda), BRT feasibility studies used traffic video feeds and machine learning techniques to count vehicles; • Today, only a few African cities have made their public transport system and minibus networks in a standardised and open format like GTFS. Promoting the digital commons approach, and using this, for example, in paratransit mapping can be impactful. In such a case, mapping these services can be a critical input for analysing accessibility to such services and the overall improvement of mobility services. The DT4A initiative, for example, is doing such deep dive mapping exercises and is opening their data (e.g., in GitLab) to spur collaboration from interested entities; • There are current initiatives to explore Mobility as a Service (MaaS) schemes – which rely on Big Data (e.g., in Kigali and Dar es Salaam). Ultimately, these Big Data sets can be used to improve public transport performance and integration and build the case for reducing motorised transport demand. There is also a significant potential for Big Data to contribute to establishing shared mobility systems; • Big Data can contribute toward the more efficient provision of informal/shared transport services true to the local mobility culture. Data sources, such as the UMA app, GPS and mobile signals can potentially be used for such initiatives. In formal bus systems, using smart card data, for example, can be impactful as movement data can also be deduced from this source; • Big data sets can be used for analysing the usage of public transport. Tweet data, for example, can be used for real-time or historical analysis. Aside from the real-time data from the vehicles and users, behavioural insights can be culled from such data, which can then feed into improving such systems and better complement public transport; • Integrating vehicle movement sensors can help better understand the vehicle performance (e.g., for drive cycle analysis) against local conditions. Such data can give information about the supply of transport services and the status of the transport network. These can also be used for better understanding behaviours (e.g., driving, parking, etc.), which might be helpful for micro-level analysis and interventions; • Aside from feeding into the improvement and creation of mobility services, asset management (e.g., public reporting of issues related to road infrastructure) and maintenance of transport infrastructure and networks (e.g., predictive maintenance) can benefit from the use of Big Data; • Big Data-enabled travel planning and service schedule will help formalise the paratransit system operation in most developing cities of Africa. Development of Relevant Policies and Interventions • Big Data opens the possibility for determining appropriate policies that can target issues and beneficiaries at a more detailed level; • The potential for combining Big data sets (e.g., movement data) with other types of data (e.g., population, transport networks, employment and residential points, movement data) can also be useful for improving the assessment of the progress towards broader goals such as SDG 11.2, which focuses on accessibility; • In the case of road safety, there have been initiatives toward developing tools for generating and analysing Big Data to improve the state of data on road safety incidences, particularly in developing countries. There is vast potential for using Big Data to complement road safety initiatives in Africa. In Botswana, for example, data may be available for road crash incidents, but these may not necessarily be readily accessible - as accessing the detailed data needs to be coordinated with the local police offices - and have inherent limitations – i.e., no details that prevent more detailed analyses of the state of road safety; 36 AFRICA URBAN MOBILITY OBSERVATORY – BIG DATA TECHNOLOGIES AND INDICATORS REPORT • The biggest challenges relate to the collection, analysis, and data utilisation for planning and action. In the case of Mongolia, for example, a mapping tool called Mapillary (open source) was used to map out the roads in Ulaanbaatar, which were then matched with road crash data, including social media sources such as Twitter. The matching of these datasets enables the analysis of areas based on their road safety features (e.g., the presence of proper pedestrian crossings) to see if there are patterns. The mapping of the entire city using the app was done only by a couple of people in three days; • Big Data about mobility can also be used in other relevant sectors. In the case of Costa Rica, satellite and remote sensing data is being used to feed into climate action planning. In the case of transport, remote sensing data is used to derive essential transportation metrics such as travel distances, origins, and destinations. 3.4.1.3 Challenges related to the utilisation of Big Data in the realm of urban mobility Table 9 presents a summary of the experts' responses in relation to their opinions on the significance of the stated challenges in hindering the uptake of Big Data in urban mobility applications. On average, the challenges related to policies (6.77 on average) were rated as the most significant ones. Table 9: Challenges related to the utilisation of Big Data in urban mobility Note: 0 = insignificant; 10 = highly significant The specific insights from the subject matter experts on the challenges are presented below. These are categorised based on the main pillars as identified in the literature review. Management The comments from the experts based on the survey and the interviews point to the following main management-related challenges. Primarily highlighting the importance of addressing gaps in skills and capacities, gaps in roles and entities, as well as the need to understand the benefits of such Big Data so that resources can be allocated. • The lack of clear entities overseeing the governance of Big Data is a challenge; • Trained personnel who are knowledgeable in terms of facilitating the generation of the data, being involved in the handling, analysis, and interpretation of the data is a key issue in African cities; Category Average Challenges Average Resistance to change 5.05 Competing motivations and turfing 4.10 Lack of cross-sectoral/inter-departmental coordination 7.24 Lack of integration of needed roles to deal with big data into existing organisational structures 7.62 Lack of appropriate skills towards governing big data 7.52 Lack of skills for utilizing Big Data 7.52 Lack of financial resources toaccommodate Big Data 7.10 Availability and compatibility of software systems 6.52 Costs associated with necessary software 6.67 Availability of redundant/supportive built infrastructure 5.86 Costs associated with supportive built infrastructure 6.19 Lack of integration of big data in wider vision 7.05 Lack of integration of ICT with political and institutional systems 6.52 Lack of appropriate relevant competition policies 6.43 Lack of appropriate regulations/policies to govern Big Data generation 6.90 Lack of appropriate regulations/policies to govern big data interoperability 7.00 Lack of appropriate regulations/policies on data sharing 7.00 Lack of appropriate regulations/policies towards ensuring data quality 6.86 Lack of appropriate regulations/policies to ensure cyber security and personal data protection 6.38 Access to technology 5.81 Perceptions regarding the use of their data 5.10 Perceptions regarding the security of their data 4.90 Lack of cooperation/involvement from other relevant stakeholders 5.90 Data generation/acquisition 6.52 Data mining and cleansing 6.14 Data aggregation and integration 6.86 Analysis and modeling 6.29 Data interpretation 6.29 Translating into actions and policies 7.71 Management 6.59 Infrastructure 6.31 Policy 6.77 People and communities 5.43 Processes 6.63 37 AFRICA URBAN MOBILITY OBSERVATORY – BIG DATA TECHNOLOGIES AND INDICATORS REPORT • In the case of ad hoc studies funded by international organisations, there is a lack of sustainability as technical capacities are not necessarily transferred to local entities; • Funding for such projects and initiatives is an issue since it is not being prioritised due to the lack of understanding of Big Data and the potential benefits. Infrastructure The comments from the experts show a common thread about the need to address infrastructure-related challenges. • Internet connectivity and affordability are also issues mentioned during the interviews. For example, in the case of Kigali, most young people use smartphones but are confronted by mobile data affordability issues. Poor internet connectivity inhibits the continuous stream of live data; • In the African context, there are significant gaps in terms of data sources. Open data repositories, which are now common in developed regions such as Europe, and the United States, are still not standard in the region; • Access to available data is also an issue. For example, in Rwanda, the National Institute of Statistics Rwanda (NISR) has a data portal, but access is partially restricted and is dependent on owning an account with a proprietary GIS software; • Storage capacity can become an issue (e.g., the perceived need to have Big Data centres). On the other hand, cloud-based solutions are becoming more feasible alternatives. Secondly, cleaning of the data also needs to be done, to weed out erroneous entries and data that do not match specific criteria. Infrastructure and equipment that are necessary for uptake of Big Data (e.g., sensors; capable computers) can be expensive, and resource constraints, coupled with other priorities, may hinder largescale deployment; • Most African cities do not have a budget for such Big Data initiatives and the perceived infrastructure requirements, coupled with other priorities that need urgent attention. Political • Decisions regarding Big Data technologies also need to be put in context with the wider state of transport data, in many developing African (and in other regions) cities, even basic transport data is not being collected; • Ensuring that governance structures are put in place for organising the collection, analysis, and utilisation of the data is essential. These roles need to be embedded into the governance structure (i.e., in a city), and specific and clear mandates need to be provided. The decisions that need data are heavily interlinked with various factors, including political ones; • Discussions are usually done in silos and can hinder progress in terms of pursuing the application of Big Data technologies towards policymaking. There is a lack of coordination between technical and political stakeholders; • The combination of datasets and ensuring quality towards extracting valuable insights for decisionmaking is seen as a significant challenge; • A key issue that the experts also emphasised is the need to prioritise policies towards ensuring data privacy and data protection. These are particularly an issue when personal identifiers are involved, as there is a risk of misusing the data. Ensuring anonymity in the data is also a key concern. One suggestion was to embed a certain level of error, such as in the case of GPS data, wherein it is only accurate to a certain degree, can be a way to ensure anonymity is kept, but still making the data useful; • The lack of policies and guidelines on data ownership and sharing has also been critical challenges that were mentioned by the experts. In the case of specialised Big Data use cases such as Mobility-asa-Service, other factors such as the distribution of revenues between the different parties is a challenge. People and communities 38 AFRICA URBAN MOBILITY OBSERVATORY – BIG DATA TECHNOLOGIES AND INDICATORS REPORT • Considering societal structure is also important in determining the potential usability of certain Big Data sets. For example, social media datasets many not necessarily be useful in contexts wherein the use of social media is not prevalent, or if majority of the people do not have access to such. Digital payments for transport services maybe hard to realise in a society that is dependent on cash-based transactions, even if we assume that the technological enablers are in place; • Potential bias in the data can be due to preferences of people. For example, in the case of a situation that Big Data that is dependent on mobile phone data connection, lower income groups can have lower representation; • There is a general lack of awareness regarding Big Data and its benefits, which can lead to resistance. • Potential exclusion can be a challenge, whether in terms of the data generation processes (e.g., in mobile phone-based technologies for collecting data) or in terms of the use of technologies that are dependent on Big Data (MaaS apps); • In the case of technologies that rely on the ownership and usage of connected devices, there can be a significant portion of the population that become invisible. This is a significant issue in the African region as highlighted in Section 2.3. This issue becomes more significant in the case the data will also be used in planning policies and interventions. Such can be mitigated by combining traditional methods of data collection (e.g., traditional surveys) are utilized in combination with Big Data collection techniques; • The high degree of informality, fragmentation, and dynamic nature of transport systems poses significant challenges in terms of ensuring accuracy. Box 1. Opinions regarding the risks associated with UMA The experts were asked about their opinions regarding risks related to UMA technologies. Risks relating to cybersecurity were rated to be highest in terms of likelihood and severity. Data privacy risks was suggested as critical risks to be accounted for. Figure 19. Risks associated with UMA The results of the local consultations held during the city workshops in Blantyre and Kigali (Table 10) essentially reflects the challenges as discussed in the literature as contained in Section 3.3.1.4, and the insights from the experts. 0% 10% 20% 30% 40% 50% 60% 70% 80% 90% 100% Likelihood Severity Likelihood Severity Likelihood Severity Likelihood Severity Likelihood Severity Cybersec urity Risks Negative Impacts to Employm ent Negative Impacts on Equality Negative Political Consequ ences Negative Environ mental Impacts Risks Associated with User Movement Analytics Low Medium High 39 AFRICA URBAN MOBILITY OBSERVATORY – BIG DATA TECHNOLOGIES AND INDICATORS REPORT Table 10: Challenges Related to Big Data initiatives: insights from the city workshops Blantyre Kigali Management • Lack of accessibility to external data - there are entities that are collecting data, like local cell phone network operators, technology corporations like Facebook, Huawei, Apple, and several entities that have cell phonebased apps for their businesses, but to access this data is difficult unless established partnerships/agreements are formed; • Lack of coordination among road agents that may collect transport related data (working in silos); • Lack of research and development sections/ department at the city level. • Lack of data analysis skill; • Gap in Research & Development; • Bureaucracy can add burdens in the process; • There is no centralised agency that is taking the lead in Big Data-relevant matters; • Lack of professional/specialisation in data science; • Lack of collaboration between various institutions, Academia, policy makers, industries. Infrastructure • Lack of appropriate infrastructure and computer packages to aid data processing; • Poor cell phone network coverage. • Technology required still developing/ penetrating; • Advanced technology adaptation (e.g., satellite tech); • Financial capability; • Capital intensive infrastructure; • Modern standard requirement; • Telecommunication coverage is low especially in Rural area; • Limited information on data. Political • There is absence of general policies related to mobilisation of Big Data. • Policies supporting the dedication of resources is lacking. People and Communities • Low penetration of smart phones; • High cost of internet cell phone data for connectivity; • low literacy levels for an average city citizen; • technology is not affordable i.e., high cost of data. • Lack of data science education / awareness. Processes • Low Internet speeds; • Limited interest in collection and using data. • Complexity in the process. 3.4.1.4 Benefits and opportunities Big Data is perceived to benefit the planning for policy measures. It is also notable that it is perceived be less beneficial for aiding the selection, implementation/monitoring, and evaluation of specific transport projects and measures Figure 20. Figure 20: Benefits of Big Data in the field of urban mobility 40 AFRICA URBAN MOBILITY OBSERVATORY – BIG DATA TECHNOLOGIES AND INDICATORS REPORT The other benefits that were provided by the experts were primarily in line with the insights on the impactful uses cases as discussed in Section 3.4.1.2. Big Data is seen to be a good complement to traditional data gathering. Data can be cheaper to collect, and data can be collected on an ongoing basis. Big Data and social analytical can be key solutions replacing traditional methods of data collection for transport which were very expensive and time-consuming. Big Data can also be more accurate due to the volume. It can be used for aiding planning, improving targeted investments as it provides an opportunity to better understand current mobility states, and the potential future scenarios. Such will also aid robust policy formulation, and the effective improvement of services. The experts also stress the opportunity towards crafting measures and policies that would benefit the vulnerable, lower-income groups, and addressing gender-related mobility issues. 3.4.1.5 Roles of city authorities The survey also asked about the opinions of the experts about what they thought should be the ideal level of involvement of city authorities in relation to aspects relating to Big Data. The ratings given by the experts depict that they deem that city authorities should be most concerned with how the data is being consumed, particularly in relation to how these would be used in relation to address the mobility-issues in their cities (Figure 21). Figure 21: Opinions regarding the involvement of cities in aspects relevant to Big Data The expert opinions also recommend that cities should act upon the provision of training opportunities for its existing staff. The experts' ratings also recommend that cities should play an active role in setting up appropriate standards. Bolstering its own capacity by hiring new staff is also an action that was rated highly by the experts (Figure 22). It must be noted, though, that such a strategy would be difficult for developing cities, considering the resources required. Figure 22: Importance of actions by cities 8.3 8.3 8.3 8.6 8.7 9.1 3.6 3.5 3.3 - 2 4 6 8 10 Overall capital and/or operational cost savings Overall urban resiliency Overall safety and security Positive economic impacts Enhanced services for residents Aiding the planning for relevant policy measures Aiding the implementation of relevant policy measures Aiding the evaluation of relevant policy measures Aiding the selection of transport projects Benefits of Big Data in Urban Mobility (0 = insignificant ; 10 = highly signfiicant) 8.5 8.4 8.3 8.8 9.0 2.8 0 1 2 3 4 5 6 7 8 9 10 Big data generation Big data consolidation Big data storage Big data analysis and elaboration Big data consumption Invest in supportive hardware (0 = no involvement; 10 = full involvement) 41 AFRICA URBAN MOBILITY OBSERVATORY – BIG DATA TECHNOLOGIES AND INDICATORS REPORT 3.4.2 Sustainable mobility indicators The initial set of indicators that had been included in the AUMO portal were chosen based on the analysis of indicators that are included in various initiatives as explained in the previous section. This section contains a summary of the insights from the expert survey and interviews, as well as the comments given by the stakeholders in the beneficiary cities. 3.4.2.1 Initial set of indicators The insights and suggestions from the local stakeholders in Blantyre and Kigali are found in . In most cases, the comments focus on the need to provide further explanations on what the indicators mean and exploring the potential for using other sources of data to derive more powerful information through such combinations. There were also no specific objections towards retaining the general set of indicators. 3.4.2.2 Indicators related to the data generated by the UMA app The main comments of the experts on indicators related to the UMA app data are: • The UMA data can significantly benefit the efforts to better understand important indicators (e.g., travel time, mode shares, and number of transfers) which are crucial in transport planning and management; • A similar movements-based approach can be used for goods movement, not just on passenger transport; • The UMA data can be used to feed into other indicators that can then be useful for relevant stakeholders such as transport operators (e.g., can be used to derive vehicle operations-relevant indicators such as speeds, sudden stops, accelerations, and even perhaps drive cycles); • Such data can be valuable as it can provide insights on origins and destinations, mode choices, and routes taken. To maximise the utility of the data, exploring most valuable data combines such data with land use, mode availability, mode choice among options, and, if possible, with socio-economic data to enable the exploration of potential choice-related factors. That requires combining at least 3 kinds of data: land use/infrastructure/transit data (like from open street maps), scheduling data (e.g., from google maps), trip O-D/Route data (e.g., from GPS tracking) and information about the traveller (e.g., from survey work); • Combining trip purpose data to match trip data can lead to valuable insights that can feed into service and infrastructure planning. It is important to better understand multi-purpose trips; • The utility of such UMA data can be maximised if these can be analysed against mode-specific variables (e.g., travel costs; availability of transport supply; security; comfort, among others) and traveller-specific variables (e.g., age, income, trip purpose, gender). Travel time 8.5 9.2 8.2 8.6 9.3 9.0 2.3 3.0 3.0 0 2 4 6 8 10 Set up direction by integrating how big data can fit into wider policies Set up appropriate data standards Set up personal information/privacy regulations Set up appropriate competition policies/regulations that govern the big data marketplace Provide for training opportunities on big data for existing relevant staff Hire new staff with required skills relevant to big data Hire firms with big data expertise Invest in supportive hardware Invest in software and supportive services (0= insignificant; 10 = highly significant) 42 AFRICA URBAN MOBILITY OBSERVATORY – BIG DATA TECHNOLOGIES AND INDICATORS REPORT • The comments from the experts validate that UMA-based travel time indicators are highly important; • The UMA data for travel time is useful, particularly if attributable to specific modes, and particular trip purposes. Mode share • The comments pointed towards validating the high importance of mode share indicators, as expected from the literature; • Modal choice is a critical indicator that can benefit from UMA; • Taking special consideration towards accounting for modes such as walking, cycling, and paratransit is important, particularly in cities where such play significant roles in the urban transport system; • Careful consideration of Big Data on mode shares is essential, as these can be fuzzy particularly in the case of informal, and non-route-based public transportation services. Distance travelled per person • Trip distances per individual can be quite useful, particularly if these can be disaggregated by income groups, age, and gender; • This is an important indicator as it influences modal choice; • Disaggregation of the distances travelled by trip segments can be useful; • Distance travelled can potentially be the easiest indicator to benefit from UMA. Period of travel • Gathering insights regarding the morning peak is the most significant aspect to consider; • UMA data would be useful for analysing travel periods considering the locations, as well as feed into interzonal analysis. Number of transfers • There was a consensus that this indicator is highly important, particularly as it is a factor that influences mode choice; • UMA data can be combined with other sources such as mobile phone signal data for the derivation of better estimates for this indicator. 3.4.2.3 Other indicators As part of the expert survey that was conducted, the study team gathered insights regarding other potential indicators – which were also based on the analysis of the existing relevant initiatives – that might be useful to integrate in such a data portal later. The respondents were asked to rate the indicators based on their importance towards feeding into urban mobility decision making in the African Context (a score of 10 represents high priority, while 0 means not a priority). Exploring the averages for each of the indicator sub-category provides an indication of the priority that needs to be given to related indicators. Data and indicators related to mode shares, and road safety were deemed to be highly important. Figure 23: Experts opinions on the level of importance of indicator clusters 43 AFRICA URBAN MOBILITY OBSERVATORY – BIG DATA TECHNOLOGIES AND INDICATORS REPORT The survey reveals that, additional indicators for accessibility (i.e., % of inhabitants within 500 meters of frequently - served by high capacity public transport services with an average of five times an hour; 12-minute headway) and mode shares (i.e., shares of modes in relation to vehicle-kilometres travelled) would be useful (Table 11). Table 11: Experts' opinions regarding the importance of other relevant indicators The city workshops have identified the following as other suggestions for additional indicators to be considered for inclusion in the Observatory. • Road condition; • Space for people with disability; • Demand / supply (heat map indicating demand and supply of transport services); • Environmental noise. 5.7 6.1 6.3 6.3 6.4 6.7 6.9 7.3 7.3 7.7 7.8 - 2 4 6 8 10 Farebox recovery Quality of public transport Affordability Safety and security Emissions-related Transfers Travel time Accessibility Accessibility Road safety Mode share (0= insignificant; 10 = highly significant) Sub-Group Indicator Average Accessibility % of inhabitants living within 500 meters of frequent public transport stops 8.50 Mode share Mode share - share of vehicle-kilometers by mode (%) 7.81 Road safety Number of traffic injuries per 1,000 inhabitants 7.74 Safety and security Perception of safety for women 7.67 Affordability % household income spent on transport 7.44 Travel time Average time (minutes) spent on travel /person/day 7.37 Emissions-related Average emission factors by vehicle type 7.26 Accessibility % of jobs near public transport stops 7.11 Accessibility Number of jobs and urban services accessible within 60 minutes by public transport 7.07 Accessibility % of jobs and services people have access to in 60 or 90 minutes 7.00 Accessibility % of low income households near rapid transit 6.93 Travel time Average speed (km/h) of public transport modes 6.81 Transfers Total time spent on transfers/person/trip 6.74 Transfers Average transfer time between public transport modes 6.74 Travel time Average network speed during peak hours 6.56 Quality of public transport Level of crowdedness in public transport modes 6.56 Emissions-related % distribution of vehicle fleet by technology type 6.56 Safety and security Number of reported incidents per thousand passenger journeys 6.30 Emissions-related % distrubution of fleet by fuel type 6.11 Farebox recovery % transit operational costs recovered with fares 6.00 Safety and security Number of crime incidents in public transport per 1,000 users 5.93 Affordability Cost of 10 km bus ride as a percentabe of income 5.81 Emissions-related % distribution of vehicle fleet by age 5.81 Quality of public transport Off-peak frequency of public transport systems 5.67 Affordability % of minimum wage that can cover the average costs of 50 puiblic transport trips 5.63 Farebox recovery % subsidy/ fares collected 5.44 Safety and security Number of crime incidents per thousand passenger journeys 5.41 44 AFRICA URBAN MOBILITY OBSERVATORY – BIG DATA TECHNOLOGIES AND INDICATORS REPORT 3.4.3 Summary of the Key Findings The summary of the key findings based on the insights of the experts and stakeholders who had been consulted is provided below. Big Data in urban mobility • The reliance of Big Data on continuous feeds and updates, and thus, the associated processes (e.g., maintenance, updating) should be stressed in the discussions surrounding the concept of Big Data which then would be helpful in better understanding its nature, and the associated requirements; • While Big Data poses significant opportunities arising from the generation of up-to-date, granular data, the attention, and resources to be put into Big Data initiatives in urban mobility should also be considered in relation to the other gaps in basic mobility data, particularly in the context of developing cities. The utility of Big Data can be maximized if combined with other types of data sets; • Open Data mechanisms are important to establish to maximise the benefits of Big Data initiatives; • Big Data offers opportunities for lowering the overall costs for gathering relevant data for planning. It also opens novel opportunities for better understanding interlinkages between mobility behaviour and other factors (e.g., socio-economic factors, availability of infrastructure and services); • There had been recent initiatives in the African region that showcase the potential for the utilisation of Big Data for improving urban mobility services; • There are various challenges related to the uptake of Big Data in urban mobility which can be related to policies, management, infrastructure, and technology, as well as people and communities. The experts consulted in this study view policy-related challenges as the most significant ones. • The experts view that ensuring data privacy is upheld is critical towards the utilisation of UMA for aiding urban mobility planning, as such breaches to such can lead to mistrust and low participation rates; • The experts suggests that city authorities which are at the beginning of interacting with Big Data initiatives can first focus on utilization of the information and how such can help achieve wider processes and goals. Sustainable mobility indicators • The relevance of the initial set of indicators was validated by the local stakeholders, as well as the experts that were consulted. There were no specific comments towards dropping any of the indicators that were included in the initial list; • There are some indicators that had originally been included in the list, but have not been populated with data (e.g., affordability, traffic fatalities, CO2 emissions) as these require data that would need to be collected from secondary sources; • More detailed definitions/ descriptions of the initial list of indicators included in the AUMO portal had been proposed (e.g., condition of public transport vehicles; public transport reliability; sexual harassment, congestion, vehicle occupancy); • In some cases, choosing a different name for the indicators may perhaps be beneficial for the intended audience (e.g., period of travel, occupancy); • There were also suggestions to explore the utilisation of other sources of data in combination with the data feeding into the indicators can lead to additional useful information for policymaking/planning. In particular, the data that can be generated using the UMA app can be a powerful tool towards understanding choice making if combined with other data reflecting physical environments, services availability, and socioeconomic factors; • As per the suggestions in relation to additional indicators, those that are related to capturing further dimensions of mode shares, road safety, and accessibility had been proposed for further exploration towards inclusion. 45 AFRICA URBAN MOBILITY OBSERVATORY – BIG DATA TECHNOLOGIES AND INDICATORS REPORT 3.5 Insights from the application of Big Data technology: AUMO case studies Data collection through conventional approaches, such as intercept field surveys, is costly, time consuming, and complex to manage. The AUMO project aimed to identify opportunities to administer surveys remotely using technology, to reduce the cost and complexity associated with mobility data collection. Several novel data collection technologies allowing remote administration of surveys were developed during the project, and these were deployed in the six research cities (Blantyre, Gaborone, Kinshasa, Kigali, Lagos, and Maseru) through several data collection campaigns. These technology-based survey tools leveraged existing telecommunications hardware and platforms as far as possible and included USSD (unstructured supplementary data services) and WhatsApp surveys (both of which were used to administer multiple-choice questionnaires), and UMA – an in-house smartphone-based survey tool, capable of automating the generation of travel diaries on participants' devices. To benchmark the novel technology-based survey tools, and to ensure that population groups out of reach of these tools, conventional intercept field surveys were also conducted by teams of enumerators administering multiple choice questionnaires using a digital survey tool. In the subsections that follow, first the data collection approach is presented, followed by the sampling strategy, and then in-depth discussions on the various survey types and their associated campaigns. Finally, this section concludes with a comparison of the survey types and their respective campaigns, and the degree to which they succeeded in achieving the goal of reducing the cost of mobility data collection. 3.5.1 Data collection approach The data collection approach used in the AUMO cities is illustrated visually in Figure 24. Typically, survey development involves the selection of survey methods, followed by instrument design, which runs in parallel with sample design. On the AUMO project, since many of the survey tools required more extensive research and development, an additional step was added, namely instrument development. The survey instrument was then submitted for ethics clearance to a panel comprising individuals from DLR Institute of Transport Research, DTU, and University of Rwanda (see approval letter in Annex G). For all chosen survey methods, upon completion of the instrument design phase, test survey campaigns were held. The collected test data was then cleaned and analysed and uploaded to the web data platform for testing (discussed in more detail in the Web Data Platform Report – Deliverable 3). Based on the quality of data and campaign feedback, survey instruments were refined/developed further. Once the survey technologies and systems were fully developed, and the survey instrument designs updated, main phase surveys commenced. Since the AUMO project has run over multiple years, multiple main phase survey phases took place. 46 AFRICA URBAN MOBILITY OBSERVATORY – BIG DATA TECHNOLOGIES AND INDICATORS REPORT Figure 24: Data collection approach 3.5.2 Sampling plan development For ease of comparison with existing datasets, as well as with those to be collected in future, all data collected throughout the AUMO project was linked spatially with traffic analysis zones (TAZs) aligned with official administrative boundaries in each city. These boundaries are familiar to local authorities and planners and simplify the sampling tasks in relation to available information, such as demographic and population data. These boundaries can be viewed in the web visualisation platform, developed specifically for the AUMO project: https://mobility.observatory.go-africa.org/#/start. Since there is seldom correlation between the number of TAZs in a city and the population size of that city, a process of TAZ agglomeration was performed, to form TAZ clusters. The number of TAZs, and TAZ clusters per city are summarised in Table 12. Table 12: TAZ and TAZ clusters per city Country City Number of TAZs Number of TAZ Clusters City Population Size (141) 90/10 Samples a 95/5 Samples a Rwanda Kigali 35 7 1,132,686 473 2678 Nigeria Lagos 20 20 21,324,000 1353 7669 Botswana Gaborone 35 5 231,592 338 1918 Lesotho Maseru 18 6 330,760 406 2293 DRC Kinshasa 24 12 7,273,947 812 4606 Malawi Blantyre 23 7 800,264 473 2672 Note: a = confidence interval and margin of error Quota sampling was discarded as a sampling strategy, as it would have resulted in vastly different sample size requirements across cities. Instead, the modified Cochran Formula (Equation 1) at TAZ Cluster level was applied, yielding greater consistency in relation to sampling requirements across cities. It is important to note that although the modified Cochran Formula is typically associated with probabilistic sampling, the survey methodology is non-probabilistic in nature (since not every member of each cities' population has an equal 47 AFRICA URBAN MOBILITY OBSERVATORY – BIG DATA TECHNOLOGIES AND INDICATORS REPORT chance of being surveyed). However, since there is a large degree of randomness in the recruitment of survey respondents, and the survey tools used are able to reach the majority of population groups, probabilistic sampling principles can still be applied (142). It is critical to note that when probabilistic sampling principles are applied under non-probabilistic conditions, the corresponding confidence interval and margin of error should not be interpreted as statistically accurate, but rather, simply an approximation (142). Given the highly exploratory nature of this research, especially regarding the untested technology-based survey instruments, two sample targets were assigned to each city. The minimum target applied an approximate confidence interval of 90% and margin of error of 10%, while the upper target applied an approximate confidence interval of 95% and margin of error of 5%. Equation 1: Modified Cochran formula(143) 𝑛 = 𝑧 2 × 𝑝(1 − 𝑝) 𝑒 2 1 + ( 𝑍2 × 𝑝(1 − 𝑝) 𝑒 2𝑁 ) Where: 𝑒90% = 0.1 𝑒95% = 0.05 𝑝 = 0.5 The stratification factors applied to the population were gender and age. Alternative stratification factors were investigated, such as income and highest level of education, however there was little consistency across cities, and where this information was available, it was provided at a country, rather than city level. See Figure 25 for an illustration of the application of the chosen sampling technique. See Appendix D: for the number of respondents to be surveyed per stratum per city. The number of respondents per stratum were distributed in proportion to the size of the corresponding stratum in each zone where possible. Kigali's age distribution was only found to be available at district, rather than zone level, while Maseru's, Gaborone's, and Kinshasa's age distribution was only found to be available at city level. In addition, Gaborone's gender distribution was only found to be available at city level. Figure 25: Sampling technique flow chart 3.5.3 Conventional Surveys The focus of the AUMO project was to identify and develop technology-enabled remotely administrable data collection methods (presented in Sections 3.5.4 and 3.5.5), as an alternative to conventional intercept field surveys. However, to benchmark these technology-enabled methods in terms of unit cost per survey response, and to ensure data could be collected for demographic sub-profiles potentially out of reach of technology-enabled survey techniques, conventional field intercept surveys were administered. Multiple-choice questionnaires were administered by teams of enumerators in the research cities, using survey questionnaires aligned with the final selection of indicators (as discussed in more detail in Section 3.3.2.1). The questionnaires were localised for each city, and where required, translated into local languages, before being loaded to a digital survey platform (SurveyCTO). Three survey campaigns were conducted in each of the research cities: first a test, followed by a two main phases. Note that on the web platform, only the latest survey phase data is displayed. 48 AFRICA URBAN MOBILITY OBSERVATORY – BIG DATA TECHNOLOGIES AND INDICATORS REPORT 3.5.3.1 Conventional Surveys Development With the initial list of indicators (as discussed in more detail in Section 3.3.2), a questionnaire was designed to support collection of data to inform these indicators as comprehensively as was practical. The indicators for which data could be collected through the field surveys are listed in Table 13. The localised and translated intercept survey questionnaires for the test and main phase surveys in all cities are provided in Annex H Table 13: Africa Urban Mobility Observatory list of indicators Indicator Category Indicator Questionnaire Reference Mobility Mode share Q1.13; Q1.16; Public Transport Access Affordability Q1.4; Q1.7; Q3.5 Accessibility Q1.2; Q1.4; Efficiency Travel time Q1.5; Q1.8; Congestion Q1.5; Q1.8; Vehicle occupancy Q1.14 Quality Public transit reliability Q2.6 Public transport comfort Q2.4; Q2.5 Transfers Q1.15 Perception of driver behaviour Q2.5 Perceived condition of public/paratransit vehicles Q2.4 Perception of crime on public transport Q2.1; Q2.2 Gender Sexual harassment Q2.1; Q2.3 Distance travelled Q1.1; Q1.3; Before each survey phase, the questionnaires were uploaded to a digital survey platform (SurveyCTO), allowing enumerators to administer the surveys using Android smartphones. SurveyCTO was chosen primarily due to its ability to support offline data collection (only requiring internet connectivity to synchronise and upload survey responses to the server at the end of each day), which is especially important in environments where mobile data signal is poor. Being a digital survey tool, the risk of data transfer errors was also substantially reduced. 3.5.3.2 Conventional surveys deployment Enumerator recruitment, training, equipment, and consumables In March 2021, in all research cities, teams were assembled to support with field survey campaigns. Field managers were appointed who were responsible for recruiting and training enumerators, arranging training venues, purchasing equipment and consumables, and for managing test and main phase survey campaigns. The survey teams typically comprised six enumerators and one supervisor, who participated in half-day training sessions in which the following topics were covered: • Distribution of responsibilities; o Enumerators; o Supervisors; • Communication requirements; o Internal team fieldwork communication protocols; o GDPR Compliance (understanding informed consent principal); o Reporting of incidents; • COVID protocols; o Wearing of masks; o Use of sanitiser; o Social distancing; o Avoiding of crowded spaces; • Technical skills; o Device configuration; 49 AFRICA URBAN MOBILITY OBSERVATORY – BIG DATA TECHNOLOGIES AND INDICATORS REPORT o Survey CTO installation; o Survey CTO Training; • Survey administration; o Internal (practice among team members). The following equipment and consumables were purchased: • Power banks (1 per enumerator); • Backup Android devices (two per city – enumerators and supervisors were required to bring their own Android devices); • Mobile data vouchers; • PPE (facemasks and sanitiser). Test phase surveys and questionnaire updates Test surveys were conducted during the second half of the training day, and on the day which immediately followed. Enumerators were assigned a minimum target of 10 surveys for the half-day, and 20 for the full day (equating to a target of 180 completed surveys per city in total). The actual number of completed surveys per city are presented in Table 14. The targets were exceeded in all cities. Note that all test phase data was excluded from all analyses. Table 14: Test surveys response tracking City Target Total respondents Cleaned surveys Blantyre 180 181 143 Gaborone 180 485 456 Kigali 180 270 269 Kinshasa 180 262 230 Lagos 180 273 272 Maseru 180 462 220 The following updates were made to the survey questionnaires prior to commencement of the first main phase (primarily to reduce the length of the questionnaire, to allow for greater compatibility with USSD and WhatsApp surveys): • Age question changed from multiple choice to open question (for higher resolution data moving forward). • Gender option "prefer not to say" was removed (to increase the number of respondents per gender). • Questions on walking time to public transport removed (to reduce length of questionnaire). • Mode of travel question combined into single question, and second most used mode of travel question removed (to reduce length of questionnaire). • Disability status questions combined into single question (to reduce length of questionnaire). First main phase surveys and questionnaire updates In August 2021, once the survey questionnaire had been revised, the first main phase field surveys took place. These surveys were conducted over three days per city, with an assigned target of 20 surveys per day per enumerator (equating to 360 completed surveys in total). The actual number of completed surveys per city are presented in Table 15. Again, the targets were exceeded substantially. 50 AFRICA URBAN MOBILITY OBSERVATORY – BIG DATA TECHNOLOGIES AND INDICATORS REPORT Table 15: Main phase 1 surveys response tracking City Target Total Respondents Cleaned Surveys Blantyre 360 617 605 Gaborone 360 702 657 Kigali 360 564 559 Kinshasa 360 770 762 Lagos 360 574 562 Maseru 360 567 567 Based on further feedback from enumerators during the first main phase surveys across the cities, further revisions were made to the questionnaire: • Gender was now reduced to only "Male" and "Female" response options (local support partners indicated that some respondents may be reluctant to participate due to the "non-Binary" option); • Rephrasing of questions for clarity, for example: "What is the most common reason for you to travel in this city?" was changed to "What is the most frequent activity you perform that requires travelling in this city?". These changes were made in response to issues identified during data cleaning. Second main phase surveys The second main phase survey campaigns were scheduled to take place during February 2022. Due to a change in UMA deployment strategy, whereby respondents would be surveyed through a standalone dedicated app, rather than through partner apps (for more details, refer to Section 3.5.5), a decision was taken to use the field survey campaign as an opportunity to market the new UMA app. Flyers were therefore printed for enumerators to hand out to passers-by, and rechargeable Long-Term Evolution (LTE) Wi-Fi modems were supplied to each team, to allow prospective UMA participants to download the UMA app from the Google Play Store. Due to development and approval delays associated with the UMA app, the project team chose to postpone the second main phase field survey campaigns by several weeks. Since approval of the UMA app by Google took longer than anticipated (due to stringent background location tracking permission criteria needing to be satisfactorily met), a decision was taken to allow the field surveys to proceed without UMA recruitment, and instead, the teams were asked to conduct field surveys for one day less than planned, so that once the UMA app had been approved, the team could be re-deployed and spend a day assisting participants with installing the app. The second main field phase took place in May 2022. Due to challenges with obtaining data collection permission in Kigali for technology-based survey tools, and since it was planned that the second main phase field campaign would incorporate UMA recruitment, the entire second main phase survey campaign was cancelled in Kigali. After extensive engagements with government officials from various departments spanning over 12 months, it was concluded that the following steps should have been followed in order to obtain the necessary authorisation to proceed: • Step 1) Obtain a letter of support from City of Kigali for the data collection campaign; • Step 2) Obtain a non-objection letter from RURA for the data collection campaign; • Step 3) Obtain a research visa from the National Institute of Statistics of Rwanda, by submitting the following supporting documentation: o Description of survey objectives; o Description of sampling frame (target population, geographical coverage); o Description of indicators; o Survey questionnaire(s) translated into Kinyarwanda; o Survey team training plan and team structure; o Data analysis plan; o Survey campaign schedule; o Curriculum vitae of researchers; • Step 4) Obtain a Data Controller Certificate from the National Cyber Security Authority's Data Protection Office, by submitting the following supporting documentation: 51 AFRICA URBAN MOBILITY OBSERVATORY – BIG DATA TECHNOLOGIES AND INDICATORS REPORT o Research visa; o Non-objection letter from RURA and letter of support from City of Kigali; o Service level agreements with sub-contractors and cloud-based technology service providers. Since these steps were not clear at the outset, by the time they were fully understood, the window for the second data collection campaign had unfortunately already closed. The number of completed surveys per city are presented in Table 16. As found during previous campaigns, the targets were exceeded in all cities but Gaborone. Table 16: Main phase 2 surveys response tracking City Target Total Respondents Cleaned Surveys Blantyre 360 451 442 Gaborone 360 361 251 Kinshasa 360 411 406 Lagos 360 450 434 Maseru 360 481 468 3.5.3.3 Survey response rates and cost In this sub-section, the effective unit cost per completed survey has been calculated by first calculating the total cost per campaign per city, and then dividing these values by the number of survey respondents per city (see Table 17). This assessment was performed using Main Phase 2 findings. Note that unlike with the technology-based survey approaches, there is little opportunity for economy of scale (i.e.: each survey campaign incurs roughly the same setup and campaign cycle costs, resulting in a relatively consistent effective unit cost per survey response, regardless of frequency or scale of survey campaign). See Section 3.5.4.4 for comparison with USSD and WhatsApp survey setup and campaign cycle costs, where additional cycles achieve better economies of scale, due to fixed non-repeat setup costs. Table 17: Field surveys campaign cost per city (main phase 2) City Survey Team and Consumables (4 days) Number of Cleaned Surveys Effective Unit Cost Blantyre GBP 1,813.10 442 GBP 4.10 Gaborone GBP 1,776.17 251 GBP 7.08 Kinshasa GBP 1,695.30 406 GBP 4.18 Lagos GBP 1,868.42 434 GBP 4.31 Maseru GBP 1,791.31 468 GBP 3.83 Both the campaign costs, and equivalent unit costs of surveys across the cities was similar, with Gaborone survey unit cost being the only outlier (due to fewer cleaned surveys being realised in this city – the cause of which is unclear). 3.5.4 USSD and WhatsApp surveys While levels of smartphone penetration across sub-Saharan African cities is rising steadily, a substantial proportion of residents continue to use low-end mobile phones (LEMPs) and feature phones (144). Therefore, the project team explored ways to collect mobility data via these less powerful, more affordable devices, identifying USSD (Unstructured Supplementary Service Data) and WhatsApp as the most compatible options. Since both platforms require the end-user to initiate sessions, SMS (Short Message Service) was identified as an appropriate mechanism through which to recruit respondents. To incentivise participation, prizes in the form of mobile airtime vouchers were offered. USSD is a Global System for Mobile Communications (GSM) text channel commonly used by African Mobile Network Operators (MNOs), and is a session-based, real-time, two-way communication service that enables access to services hosted on a server (145). Therefore, USSD can support the administration of interactive multiple-choice surveys. USSD is compatible with all GSM devices, including LEMPs, feature phones and smartphones (regardless of operating system). 52 AFRICA URBAN MOBILITY OBSERVATORY – BIG DATA TECHNOLOGIES AND INDICATORS REPORT A test USSD survey campaign, supported by SMS marketing messages, was held in Blantyre in November 2021. This was followed by a main phase USSD and a WhatsApp survey, also supported by SMS marketing messages, in Blantyre and Lagos in March 2022. 3.5.4.1 USSD surveys development The AUMO project started mid-2020, during which time many countries had imposed Covid-19 related travel and movement restrictions. Innovative contactless data collection methods were one outcome of these restrictions, among which were USSD surveys (146). It was in this context that the project team investigated the possibility of conducting mobility surveys via USSD. USSD functionality and limitations USSD sessions support two-way communication between a USSD server and an end-user device, allowing survey questionnaires to be presented to the end-user, and allowing the end-user to then submit a response. There are several inherent limitations to USSD technology: • The maximum duration of a USSD session is typically between 120 to 180 seconds, depending on Mobile Network Operator (MNO), therefore the questionnaire should take no longer than this time to complete. While it is possible to resume a survey, returning to the last question reached before timeout, by dialling the USSD code again, the likelihood of respondents dialling in again is low; • A maximum of 160 characters per screen can be accommodated, depending on MNO, therefore each question and their corresponding response options should not exceed 160 characters combined; • Shared USSD channels are often configured to charge the user per session, rather than the account holder. When setting up dedicated USSD channels, this can usually be configured as desired. With these limitations in mind, USSD is best suited to multiple choice-style questionnaires, which ensure that participants' response messages are brief (in terms of the number of characters to type, as well as the time it takes to respond). Due to these limitations, while the conventional surveys' questionnaires were predominantly multiple choice, the time required to answer all 24 questions was too long. For USSD surveys, the questionnaires were reduced to 15 questions. Travel experience questions were therefore removed (for more information on indicators, see Section 3.3.2.1), while demographic and travel pattern related questions were retained (since these were identified as being critical for the co-development of Action Plans, to be presented in forthcoming Deliverable 8). Due to the character limit, it was also not possible to list all the zones of the city on a single page. Therefore, the zone selection question had to be adapted into a 2-stage sequence, in which the first letter of the respondent's selected zone was identified during the first stage, followed by a second stage in which a list of zones beginning with the corresponding first letter was presented to the respondent to select from. As a result of this relatively convoluted (and likely confusing) sequence, much time was lost to zone selection. As a result, many respondents were unable to complete the USSD surveys before the sessions timed out. See Annex H for the test and main phase USSD questionnaires. Stakeholder engagement and USSD channel and server setup USSD channels are usually costly and time-consuming to set up (although this does vary across regions and MNOs). So, unless a USSD channel is required for a long-term continuous campaign, it is usually more cost effective to deploy a campaign on an existing shared USSD channel, set up by a telecom's aggregator service. See quoted costs obtained for the setting up and maintenance of dedicated USSD channels in each of the six AUMO cities in Table 18. Table 18: Dedicated USSD channel setup and maintenance costs per city City Setup Cost Monthly Management Fee Blantyre GBP 3,725 GBP 414 Gaborone GBP 4,840 GBP 620 Kinshasa GBP 12,415 GBP 660 Kigali GBP 5,380 GBP 660 53 AFRICA URBAN MOBILITY OBSERVATORY – BIG DATA TECHNOLOGIES AND INDICATORS REPORT Lagos GBP 5,795 GBP 995 Maseru GBP 3,725 GBP 495 Setting up dedicated channels exceeded the available budget; therefore, the project team investigated such shared USSD channels. Africa's Talking, a telecoms aggregator that operates across much of sub-Saharan Africa, had shared USSD channels in Blantyre, Kigali, and Lagos, and was contracted to support with the provision of USSD channels in these cities. To obtain the necessary approvals and support for USSD survey campaigns, extensive stakeholder engagement with MNOs and regulatory/governing authorities across the six research cities took place (see Appendix E: for a list of these stakeholders and key outcomes of engagement). In Kigali, although USSD and SMS campaigns were found to be relatively affordable and technically feasible, due to various regulatory and compliance requirements, in addition to those discussed in Section 3.5.3, it was not possible to proceed with the USSD campaign in this city. Sharing of USSD channels with third parties is not permitted according to RURA regulation No. 003 on short code allocation (2014). Further, to set up a dedicated USSD channel in Rwanda, a Tax Identification Number (TIN) is required. TINs are issued by the Rwanda Development Board (RDB), but because none of the consortium members are Rwandan entities, it was not possible to apply for a TIN. Once USSD channels have been set up, a USSD server must be set up to allow communication with survey respondents' mobile devices (to administer the survey, and to store the response data). See Figure 26 for an illustration of the data flow between the USSD server, the aggregator server, the MNO USSD channel, and end-user devices. Figure 26: USSD data flow illustration Rather than developing an in-house USSD server, SASA Solutions (a South African telecoms technology company with an existing USSD server platform) was contracted to support on the project. USSD survey functionality was tested using SASA Solutions' USSD web-based simulator (see Figure 27). Figure 27: SASA Solutions web-based USSD simulator (Lagos) 54 AFRICA URBAN MOBILITY OBSERVATORY – BIG DATA TECHNOLOGIES AND INDICATORS REPORT 3.5.4.2 WhatsApp Surveys development With the rapid adoption of Meta's WhatsApp messenger service across Africa (147), and increasing number of feature phones supporting WhatsApp, the project team investigated the possibility of conducting mobility surveys via this channel. As with USSD, WhatsApp surveys require the user to initiate sessions by sending a message to a WhatsApp number. Therefore, a combined USSD and WhatsApp marketing campaign via SMS was planned. WhatsApp functionality and limitations WhatsApp, like USSD, supports two-way communication between servers and end-user devices. This allows survey questionnaires to be presented to end-users, who can then submit responses. The 4,096-character limit of WhatsApp messages far exceeds that of USSD, and there is no session duration limit. As a result, the full 24-question survey could be retained, and there was no need for the 2-stage zone selection sequence, as was required for the USSD questionnaire. See Annex H for the WhatsApp survey questionnaires. WhatsApp server setup To support WhatsApp surveys, a Meta Business Suite account is required, as well as a Facebook business page. A virtual WhatsApp number must then be assigned, which was contracted to Turn.io (a communications integration company). As with USSD, to support an interactive survey, a WhatsApp server linked to the WhatsApp account must be set up. This was contracted to SASA Solutions since they were already running the USSD server for the project. A web-based WhatsApp Simulator, similar to the simulator set up for USSD (see Figure 27), was set up for testing the WhatsApp surveys. 3.5.4.3 SMS and participation incentives campaigns preparation USSD sessions must be initiated by users by dialling a USSD code, and WhatsApp sessions must be initiated by users sending a message to a WhatsApp Business number. To remotely recruit survey respondents, a marketing campaign was therefore required in which the corresponding USSD codes and WhatsApp numbers could be shared. To achieve sampling objectives (as discussed in Section 3.5.2), various campaign methodologies were considered. This included the possibility of distributing flyers and putting up posters in and around activity centres, as well as digital forms of marketing, such as Facebook and SMS campaigns. Since MNOs can send targeted SMSs to their subscribers based on their location relative to cellular towers, and since all GSM devices (including LEMPs, feature phones, and smartphones) are able to receive SMSs, it was concluded that SMS campaigns would likely be most effective at recruiting participants to these remotely administered digital survey campaigns (especially as the message would then be received on the device through which the survey could be initiated). After lengthy stakeholder engagements with various MNOs in the six research cities, it was determined that with the relevant authorisation, it would be possible to send targeted marketing messages in Blantyre, Kigali, and Lagos. 55 AFRICA URBAN MOBILITY OBSERVATORY – BIG DATA TECHNOLOGIES AND INDICATORS REPORT To incentivise USSD survey participation, prizes, in the form of mobile airtime vouchers, were offered. Due to the technical limitations associated with SMS, each marketing message was limited to 160 characters. Thus, only information considered critical to the campaign could be included. The key points communicated through the message were campaign purpose, participation age restriction, incentive offered, and participation instructions. The final SMS marketing message was as follows: Improve transport in [city name]: Enter AUMO survey to win airtime! Dial *123*4# or WhatsApp bit.ly/xyzabc 18+, 1st USSD entry qualifies for prize, T&Cs apply Due to challenges in obtaining the necessary authorisation to conduct digital surveys in Kigali (as discussed in Sections 3.5.3.2 and 3.5.4.1), it was not possible to proceed with the USSD and WhatsApp surveys, nor the corresponding SMS survey marketing campaign. 3.5.4.4 Survey response rates and cost The total number of people who initiated a USSD or WhatsApp survey session in Blantyre and Lagos, the number who completed at least 80% of the questionnaire, and the number who completed the questionnaire entirely, are summarised in Table 19 and Table 20 respectively. Table 19: USSD survey response rates City Number of Marketing SMSs Sent (USSD and WhatsApp Combined) Initiated USSD Survey Completed 80% of USSD Survey Completed 100% of USSD Survey Blantyre 80,040 1,946 448 367 Lagos 100,000 909 604 149 Table 20: WhatsApp survey response rates City Number of Marketing SMSs Sent (USSD and WhatsApp Combined) Initiated WhatsApp Survey Completed 80% of WhatsApp Survey Completed 100% of WhatsApp Survey Blantyre 80,040 15 8 3 Lagos 100,000 52 21 19 The drop-off rate (difference between the number of participants who initiated the survey, and those who completed the survey) associated with USSD is evidently much higher than for that of WhatsApp, mainly due to the time limit associated with USSD sessions (which in most instances of drop-off, timed out before respondents were able to reach the end of the questionnaire). This indicates that had the questionnaire been shorter (or had the time-out duration been longer), it would have been possible to achieve a higher completion rate. In both cities, far fewer people chose to participate in the WhatsApp survey. This was likely due to the airtime incentive being offered only to those participating via USSD (although, another likely factor was that a smartphone or feature phone with WhatsApp installed was required to participate via this channel – such devices are less common than LEMPs, which are able to accommodate only USSD surveys). The drop-off rate associated with WhatsApp was also high, though since the session was not time restricted, this was likely due to respondents tiring of the survey before reaching the end (indicating that the survey questionnaire was simply too long). Presented in Table 21 and Table 22 are the total USSD and WhatsApp data collection campaign costs per city, respectively. These are broken down into the following: • Once-off setup costs: these are independent of the number of campaign cycles run or the number of surveys completed (i.e.: as more surveys are completed, so these costs can be amortised over more survey responses, thereby lowering the effective unit cost per survey); • Campaign cycle costs: these are costs incurred during each campaign cycle; • Variable costs: these are costs which increase with the number of survey respondents (i.e.: they increase the total cost of each campaign, but have no impact on the unit survey cost, since they are directly proportional to the number of survey responses). 56 AFRICA URBAN MOBILITY OBSERVATORY – BIG DATA TECHNOLOGIES AND INDICATORS REPORT Table 21: USSD data collection campaign cost per city City Setup Costs (Once-off) Campaign Cycle Costs Variable Costs Total USSD Channel Setup and Maintenance USSD Server Setup Cost USSD Monthly Campaign Cost Targeted SMS Cost Airtime Incentive Blantyre GBP 860.86 GBP 306.20 GBP 203.73 GBP 53.54 GBP 39.46 GBP 1,463.79 Lagos GBP 285.32 GBP 306.20 GBP 203.73 GBP 483.40 GBP 19.88 GBP 1,298.53 Table 22: WhatsApp data collection campaign cost per city City Setup Costs (Once-off) Campaign Cycle Costs Total WhatsApp Business Account Setup WhatsApp Server Setup Cost WhatsApp Campaign Monthly Cost Targeted SMS Cost Blantyre GBP 36.50 GBP 306.20 GBP 203.73 GBP 53.54 GBP 599.97 Lagos GBP 36.50 GBP 306.20 GBP 203.73 GBP 483.40 GBP 1,029.83 USSD channel and maintenance costs were higher in Blantyre than in Lagos, due to the necessity to have a dedicated USSD channel. It was discovered during the test phase that Africa's Talking's shared USSD channel only functioned on the Airtel network, while the SMS campaign was only able to run on the Telekom Networks Malawi (TNM) network – therefore, a dedicated USSD channel had to be set up on the TNM network. It should also be noted that while the initial quote for setting up a dedicated USSD channel in Blantyre was GBP 3,725 (see Table 18), through Africa's Talking, it was possible to set up the dedicated channel for GBP 860.86. This indicates that it may have been possible to set up dedicated USSD channels more cost effectively in the cities where USSD surveys had been excluded – this only became apparent towards the end of the project, leaving insufficient time and budget to proceed with additional USSD campaigns in more cities. The cost of targeted SMSs in Blantyre was substantially less than in Lagos, resulting in an overall USSD campaign cost in Blantyre only slightly more than in Lagos. Since fewer people participated in USSD surveys in Lagos than in Blantyre, the total airtime incentive cost was slightly less. WhatsApp survey setup costs were the same in both cities, but again, targeted SMS costs were much higher in Lagos, resulting in a much higher campaign cost overall. In Table 23 and Table 24, the equivalent unit cost per completed USSD and WhatsApp survey respectively, per city, are presented. Table 23: USSD campaign cost per city City Total USSD Cost Number of Completed Surveys Effective Unit Cost Blantyre GBP 1,463.79 367 GBP 3.99 Lagos GBP 1,298.53 149 GBP 8.71 Table 24: WhatsApp campaign cost per city City Total WhatsApp Cost Number of Completed Surveys Effective Unit Cost Blantyre GBP 599.97 3 GBP 199.99 Lagos GBP 1,029.83 19 GBP 54.20 In Blantyre, since over twice as many survey respondents participated via USSD than in Lagos, and with similar overall campaign costs, the unit cost per survey was substantially less. Conversely, since far fewer survey respondents participated via WhatsApp in Blantyre, unit costs per WhatsApp survey were not only substantially higher in Blantyre than in Lagos, but also far higher than the cost per USSD survey (this was also seen in Lagos). Had the USSD survey been reduced in length further, the drop-off rate could have been far lower, and consequently, the unit cost could have been considerably reduced. Regarding WhatsApp, it is unclear whether the lack of an incentive was the primary reason for low participation, or the lack of penetration of feature phones and smartphones in the region. The high drop-off rate associated with the WhatsApp surveys in both 57 AFRICA URBAN MOBILITY OBSERVATORY – BIG DATA TECHNOLOGIES AND INDICATORS REPORT cities however can certainly be ascribed to the length of the survey. Therefore, as with USSD, a shorter survey would have yielded a better completion rate, and a lower unit cost. 3.5.5 UMA surveys To take advantage of the rich telemetry data smartphones can collect, a bespoke automated travel diary generating smartphone-based technology (UMA) was developed by the team. UMA collects location and accelerometer data from smartphones, and is therefore able to infer origin destination pairs, periods of travel, modes of travel, number of transfers, trip duration and distance, and trip purpose (by comparing location data with Point of Interest (POI) data. UMA was first developed as a Software Development Kit (SDK), to allow integration with existing apps, and thereby take advantage of host apps existing user-bases from which to recruit participants. Due to limited interest among prospective app partners to integrate UMA, the project team developed a standalone smartphone app. After lengthy delays (discussed in more detail in the subsections that follow), UMA campaigns were conducted in the research cities during June 2022. 3.5.5.1 UMA surveys development UMA SDK and Standalone App To reduce the cost and time associated with recruiting UMA survey participants, the project team chose to develop an Android and iOS UMA SDK, thereby allowing integration with existing apps, with existing userbases from which to recruit. The risk with this approach is the introduction of survey bias, whereby the population of app users are unlikely to be reflective of the whole population. To help overcome this issue, it was the intention of the project team to integrate UMA with as many apps as possible. Android is the most prevalent smartphone operating system in sub-Saharan Africa (148), therefore, the Android SDK development was prioritised. In parallel to development, the project team embarked on a stakeholder engagement programme through which prospective app partners were identified and approached. Despite initial expressions of interest from several prospective app integration partners, as the Android SDK approached production release, hesitance to proceed with integration had grown. The major concerns raised by prospective app partners were the unknown impact that integration of a third-party SDK could have on the functionality of the host app, and the unknown impact that such an integration could have on user perceptions of the host app. Once the production Android Package Kit (APK) was released in mid-2021, only one of the prospective app partners was willing to proceed, but required payment of GBP20 per survey participant, and only had userbase coverage in DRC. Since the goal was to achieve targets of around 1,000 participants per city, with an UMA marketing and recruitment budget of GBP1,200, this was not a viable option. In addition, both Google and Apple had introduced stricter approval criteria for background location tracking, whereby app developers now needed to prove that background location tracking is critical to the functioning of the app, and that there was tangible benefit to background location tracking for the end-user. Consequently, only partner apps that already had background location tracking approved would-be viable candidates, since those without this preexisting approval would likely struggle to prove that UMA support was critical to the functioning of the host app, and of benefit to the end-user. With limited remaining development hours available, the team stopped the development of the iOS UMA SDK, and instead focussed developing a standalone Android UMA app. Planning and design of the standalone Android UMA app commenced late-2021, with development beginning early 2022. After several iterations, and many months of testing, the production version of the Android app with background location tracking capabilities was approved by Google. It became available for download on the Google Play Store in May 2022. UMA functionality and limitations UMA is a smartphone-based survey tool that can passively observe mobile phone telemetry data (including GPS and accelerometer), to allow interpretation of individuals' modes of travel, origins and destinations, travel times, periods of travel, and transfer activity (see Figure 28 for a visualisation of UMA data). 58 AFRICA URBAN MOBILITY OBSERVATORY – BIG DATA TECHNOLOGIES AND INDICATORS REPORT Figure 28: UMA Users Static Location Snapshot and Trip Routes UMA is General Data Protection Regulation (GDPR) compliant, and therefore requires informed consent from survey participants before data collection can commence. To obtain this informed consent, the purpose of the survey must be concisely communicated to the user. Once a user has downloaded the UMA app, they are presented with the screens shown in Figure 29. Figure 29: UMA App Initiation Screens If the user then agrees to participate, they are asked to complete a brief disaggregation survey, which ensures that their data can be associated with their demographic profile, rather than any personally identifiable information (Figure 30). 59 AFRICA URBAN MOBILITY OBSERVATORY – BIG DATA TECHNOLOGIES AND INDICATORS REPORT Figure 30: UMA app disaggregation survey Once the disaggregation survey is completed, tracking is able to commence. Each day, the previous day's trips become visible to the participant, and should be reviewed by the participant to confirm whether the travel path detected is accurate, and to also confirm trip primary trip purpose and mode (this is used for app calibration purposes). Figure 31: UMA app tracking screens The main limitations associated with UMA are as follows: • It is a smartphone-based solution only and is therefore not compatible with LEMPs or feature phones (resulting in the exclusion of a substantial proportion of the population); o At present, UMA is only compatible with Android devices (although at the time of writing, the iOS version was nearing completion); • It relies on participants configuring their device correctly (enabling background location tracking, and ensuring the app is allowed to run in the background without power restrictions); • Recruitment of users can be a challenge, especially when it is not possible to partner with existing host apps; • Mode detection accuracy is reduced where there is no POI data available with which UMA can correlate travel paths (UMA is able to detect walking and cycling easily, but distinguishing between motorised modes is more challenging, unless the travel path is aligned with known transport interchanges and stops); • UMA requires high accuracy location data, and therefore during trips it enters a high-power consumption mode, comparable with navigation apps. This results in reduced battery life while the user is participating, which can result in participants opting out of the campaign before completion. 60 AFRICA URBAN MOBILITY OBSERVATORY – BIG DATA TECHNOLOGIES AND INDICATORS REPORT Stakeholder engagement Prospective UMA app partners per city are listed in Table 25. Engagements were held with these stakeholders over a period of several months, however none culminated in integrations. This was largely due to concerns by prospective partners that their userbase would be uncomfortable with the concept of being tracked through their app, and that they were unwilling to risk the possibility of functionality issues as a result of software conflicts caused by an integration. Table 25: UMA Prospective Partner App List App Category Blantyre Gaborone Kigali Kinshasa Lagos Maseru AC Group Tap & Go Public transport app (bus) X Ampersand Paratransit app (motorbike taxi) X HeHe Grocery delivery app X Kintrack Logistics/tracking app X Maxicash Mobile money app X X X X X X SafiRide Paratransit app (motorbike taxi) X Sauti Mobile money app X TNM Money Mobile money app X YegoMoto Paratransit app (motorbike taxi) X 3.5.5.2 UMA survey deployment UMA campaigns were run in all research cities, except Kigali (where the necessary permissions could not be obtained in time – see Section 3.5.3.2 for more details) and were marketed through flyers handed out by field teams over a single day (Figure 32), and via a Facebook advertising campaign (Figure 33). Only 43 participants completed a full cycle of data collection across all cities. This was likely a result of the marketing campaign being insufficient (constrained by a limited budget, and failure to combine the UMA recruitment field campaign with the conventional survey campaign as planned – due to delays in UMA development). Figure 32: UMA Campaign Flyer (Lagos) Figure 33: UMA Facebook Advert (Lagos) 3.5.5.3 Survey Response Rates and Cost The total number of people Facebook advert feed appearances, number of Facebook advert clicks (i.e.: number of instances of users clicking on the advert), number of UMA app downloads, number of users who registered and initiated the app correctly (granted permission for the app to collect data, and completed the 61 AFRICA URBAN MOBILITY OBSERVATORY – BIG DATA TECHNOLOGIES AND INDICATORS REPORT disaggregation survey), and finally, the number of participants who completed the UMA survey (i.e.: were successfully tracked for seven consecutive days), are summarised in Table 26. Table 26: UMA participation rates City Number of Facebook Advert Feed Appearances Number of Facebook Advert Clicks Number of UMA App Downloads Number of UMA App User Registrations Number of Completed UMA Surveys Blantyre 50,638 1,283 3,084 60 24 Gaborone 73,903 1,465 826 13 7 Kinshasa 197,300 1,622 326 8 0 Lagos 85,856 805 431 8 8 Maseru 63,616 1,098 651 19 4 Just over half-a-million Facebook advert feed appearances converted into a healthy 7,357 advert clicks, and 5,318 app downloads from the Google Play Store. The conversion rate from app downloads to completed surveys was however less than 1%. This indicates that either prospective respondents were unwilling to participate due to reluctance to share location data, or they were unsure how to proceed (with the former being the more likely scenario in most cases). Despite Malawi having the second lowest smartphone penetration of the five countries in which UMA campaigns were administered (144), Blantyre had the highest number of UMA app downloads, user registrations, and completed UMA surveys. The effective unit cost per completed UMA survey is presented in Table 28. First the total cost per campaign per city is calculated (Table 27), and then divided by the number of UMA respondents per city. Note that the campaign cost figures have been converted from local currencies into GBP and rounded to the nearest whole number. Table 27: UMA campaign cost per city City Campaign Cycle Costs Variable Costs Total Flyers Facebook Adverts Survey Team (1 day) Airtime Incentive Blantyre GBP 24.00 GBP 115.00 GBP 310.00 GBP 115.00 GBP 564.00 Gaborone GBP 33.00 GBP 115.00 GBP 353.00 GBP 115.00 GBP 616.00 Kinshasa GBP 33.00 GBP 115.00 GBP 382.00 GBP 115.00 GBP 645.00 Lagos GBP 30.00 GBP 115.00 GBP 377.00 GBP 115.00 GBP 637.00 Maseru GBP 30.00 GBP 115.00 GBP 344.00 GBP 115.00 GBP 604.00 Table 28: Equivalent UMA unit cost per city City Campaign Cost Number of Completed UMA Surveys Effective Unit Cost Blantyre GBP 564.00 24 GBP 23.50 Gaborone GBP 616.00 7 GBP 88.00 Kinshasa GBP 645.00 0 N/A Lagos GBP 637.00 8 GBP 79.63 Maseru GBP 604.00 4 GBP 151.00 Due to the much lower number of completed UMA surveys than targeted (1,000 per city), the unit cost is substantially higher than all other AUMO data collection methods. The main challenge associated with the UMA campaigns across all cities was evidently succeeding in convincing prospective participants who had downloaded the app to continue to agree to have their location tracked for the 7-day period. With insufficient budget and time to conduct further UMA campaigns, it is unclear whether a larger Facebook advert campaign could have yielded better results, or greater diversity in recruitment methods. Both should be tested in future to establish if it is possible to encourage greater participation through improved marketing. 62 AFRICA URBAN MOBILITY OBSERVATORY – BIG DATA TECHNOLOGIES AND INDICATORS REPORT 3.5.6 Key findings 3.5.6.1 Socio-demographic profile of respondents per survey technology The socio-demographic profile of survey respondents in Blantyre and Lagos, per technology, are presented in Figure 34 up to (and including) Figure 38. Only these two cities are included in this comparison, since USSD and WhatsApp surveys were not administered in the other AUMO cities. Since there were very few participants who responded via WhatsApp, the results may be misleading and therefore are not discussed. Figure 34: Ratio of responses per technology per city by gender Evidently, field surveys came close to achieving gender parity in both Lagos and Blantyre. In both cities, there were more male USSD respondents than female. Figure 35: Ratio of responses per technology per city by age group In both cities, there were few survey respondents over the age of 55 participating any survey technology. The average age of USSD survey participants was lower than that of field surveys (possibly due to a greater degree of tech savviness typically expected of younger participants). Figure 36: Ratio of responses per technology per city by employment status 63 AFRICA URBAN MOBILITY OBSERVATORY – BIG DATA TECHNOLOGIES AND INDICATORS REPORT The vast majority of USSD and field survey respondents in both cities were employed/self-employed, followed by students, and some full-time parents. Figure 37: Ratio of Responses per Technology per City by Education Level In both cities, most USSD and field survey respondents had secondary school level education or above (with the majority of USSD and field survey respondents in Lagos having some form of tertiary education). Figure 38: Ratio of Responses per Technology per City by Income Group While in Lagos there was relatively even representation of different income groups across both USSD and field survey respondents, in Blantyre, most respondents fell into the lower income brackets. Since Malawi is classified by World Bank as a low-income country, which aligned with expectations (149). 3.5.6.2 Comparison of Data Collection Methods Since the key objective of identifying and developing technology-based survey tools was to reduce the overall cost of data collection in the research cities, a key measure of their relative success is their ability to achieve this objective. The total campaign cost per survey type per city is presented in Table 29, while the effective unit cost per survey type per city is presented in Table 30. Table 29: Survey campaign total costs per type per city City Conventional Surveys USSD Surveys WhatsApp Surveys UMA Surveys Total Campaign Cost per City Blantyre GBP 1,813.10 GBP 1,463.79 GBP 599.97 GBP 564.00 GBP 4,440.86 Gaborone GBP 1,776.17 - - GBP 616.00 GBP 2,392.17 Kigali - - - - - Kinshasa GBP 1,695.30 - - GBP 645.00 GBP 2,340.30 Lagos GBP 1,868.42 GBP 1,298.53 GBP 1,029.83 GBP 637.00 GBP 4,833.78 Maseru GBP 1,791.31 - - GBP 604.00 GBP 2,395.31 Total Campaign Cost per Survey Method GBP 8,944.30 GBP 2,76.32 GBP 1,629.80 GBP 3,066.00 64 AFRICA URBAN MOBILITY OBSERVATORY – BIG DATA TECHNOLOGIES AND INDICATORS REPORT Table 30: Survey campaign unit cost and response quantity per survey type per city City Conventional Surveys USSD Surveys WhatsApp Surveys UMA Surveys Survey Qty Effective Unit Cost Survey Qty Effective Unit Cost Survey Qty Effective Unit Cost Surveys Qty Effective Unit Cost Blantyre 442 GBP 4.10 367 GBP 3.99 3 GBP 199.99 24 GBP 23.50 Gaborone 251 GBP 7.08 - - - - 7 GBP 88.00 Kigali - - - - - - - - Kinshasa 406 GBP 4.18 - - - - 0 N/A Lagos 434 GBP 4.31 149 GBP 8.71 19 GBP 54.20 8 GBP 79.63 Maseru 468 GBP 3.83 - - - - 4 GBP 151.00 UMA survey campaigns cost the least of all survey types in each city, however, since the response rates were significantly lower than anticipated, the effective unit cost was in fact the highest of all survey types across all cities. Had UMA been deployed earlier (with more time to market and recruit UMA users, perhaps through a range of recruitment strategies, such as posters in and around activity centres and transport stops and targeted SMSs, in addition to Facebook adverts and very limited distribution of flyers), it is possible that more participants could have been recruited. This would likely have reduced the unit cost considerably, potentially making it more cost effective. In Blantyre, USSD surveys were the most cost-effective survey type, just slightly ahead of conventional surveys. It must be noted that while the number of respondents is indicated as 367, these are the number of fully completed cleaned surveys. The number of USSD survey participants who had initiated a survey but did not reach the end was 1,946. Had the survey questionnaire been shorter, allowing all participants who initiated the survey to reach the end before the session timed out, the effective unit cost per survey would have been GBP 0.75 (which would have made the USSD survey campaign 82% more cost effective than conventional field surveys in Blantyre). Similarly in Lagos, the total number of USSD participants who initiated a survey was 909, therefore had the survey questionnaire been shorter, allowing all participants who had initiated the survey to reach the end, the unit cost per USSD survey in Lagos would have been GBP 1.43 (which would have made it 33% more cost effective than conventional field surveys in Lagos). While WhatsApp surveys were the least cost-effective survey tool in Blantyre, and only slightly more cost effective than UMA in Lagos, arguably, these figures belie the true potential of WhatsApp. It is unlikely that the poor WhatsApp response rate was due to low levels of WhatsApp penetration, given the increased adoption of this service in the region (147). The poor participation rates were likely due to the lack of incentives (due to insufficient budget), and the combining of the WhatsApp marketing campaign with the that of USSD surveys (i.e.: the two participation options were marketed through the same SMS messages, in which it was clearly indicated that only USSD survey participants would be eligible for airtime, thereby effectively disincentivising WhatsApp survey participation). In conclusion, USSD can function as a very powerful survey technology, with the potential to be substantially more cost-effective than conventional field surveys. Had a longitudinal survey design approach been adopted, where the base questionnaires could be split across several phases of data collection (resulting in shorter questionnaires per round), the completion rate likely would have been significantly higher, thereby resulting in higher quality datasets. WhatsApp surveys could also likely be a cost-effective survey tool, although this would need to be proven with further testing of the technology using different marketing techniques, and possibly incentives. Similarly, while UMA is an incredibly powerful survey tool in terms of its capability to automate the generation of comprehensive trip diary datasets, additional testing is required to evaluate different marketing approaches and incentive strategies, to encourage greater participation. 3.6 Recommendations 3.6.1 Big Data for Aiding Sustainable Urban Mobility Transitions Based on the analysis of the literature, combined with the insights garnered from the expert surveys and interviews, as well as the results of the workshops, the following recommendations are put forth in relation to the strategic actions that the cities can take in order to properly integrate Big Data technologies into the urban transport policy cycle. 65 AFRICA URBAN MOBILITY OBSERVATORY – BIG DATA TECHNOLOGIES AND INDICATORS REPORT Integrate Big Data into urban mobility planning The cities should take an integrated approach towards governing such technologies and maximise the utility of the outputs and link them with the objectives of the city. Cities should define a strategic and integrated vision for sustainable mobility, which would then become the basis for identifying how Big Data can play a role in contributing to the attainment of the vision. The visioning process would entail an analysis of the mobility situation and trends, the development of a vision for future mobility, the identification of priority issues and relevant indicators, and the analysis of data gaps. The identification of such gaps, combined with information from an inventory of relevant internal resources (human, infrastructure, financial, etc..), and external initiatives (e.g., other parties working on Big Data initiatives) will reveal the potential for the use of Big Data in urban mobility planning. Determining the optimal use of Big Data in urban mobility planning and decision making would vary depending on the local context. It is important, though, to determine processes and entities that would be involved in ensuring that the use of Big Data would complement the other sources of data used in planning. As highlighted in this evaluation, achieving targeted sampling distributions, for instance, might be difficult to achieve, which could then lead to aggravating exclusion of certain population segments, or lead to biased results (particularly for small pilot projects). Cities should also explore leveraging the strategies towards using Big Data in urban mobility planning considering other priorities outside the mobility pillar. For example, the setting up of data portals need not be relegated to the urban mobility sector, and the development of such can consider directly integrating other urban services or be developed with scalability in mind. Ultimately, the integration of Big Data technologies into urban mobility planning and policy cycles should be based on the developments considering relevant resources, capacities, and partnerships. Big Data can play a role across the different stages of these cycles (e.g., analysis of current situation and trends, aiding the selection of appropriate policy measures and interventions, evaluation of such, and updating the overall vision). Adopt appropriate local policies and regulations City authorities can explore adopting local policies that would facilitate the utilization of such Big Data technologies to feed into planning and policymaking. A careful review of existing regulations and policies relevant to Big Data and urban mobility (e.g., data privacy, cybersecurity, data sharing, data ownership), and understanding the limits and opportunities for developing and adopting such at the city-level, can be a first step. Establishing focal points at the city-level to coordinate with national level authorities, for example, is a short-term step. In the case, for example, of the AUMO experience, there were significant limitations that had to do with national level regulations and processes related to the eligibility of entities to conduct specific portions of setting up the data collection channels (e.g., applying for a USSD channel requires a tax identification number). Local ordinances that would either drive the evolution of internal capacities or facilitate collaboration among different stakeholders (e.g., creation of a steering committees and task forces), or those that would specifically indicate resource allocation for exploring Big Data (or improving data, in general) for urban mobility, would spur interest and support, both internally and externally. Local policies and regulations that adapt or bolster national level policies and regulations towards ensuring data privacy and cybersecurity are of utmost importance. Cities can use directives within their powers to enforce the sharing of data from relevant private entities. For example, in other regions (e.g., Europe, North America), licences to operate shared mobility services require that operators enter into data sharing agreements with the cities. Additionally, city authorities can explore fiscal and non-fiscal incentives for supporting Big Data projects and initiatives, and entities working in this field (e.g., expedited procedures for permitting, business processing, etc). Determine the city's role and build capacities 66 AFRICA URBAN MOBILITY OBSERVATORY – BIG DATA TECHNOLOGIES AND INDICATORS REPORT Maximum societal value from Big Data can only be extracted if local government is able to direct the initiatives to feed into its wider goals. Cities should manage and build capacities to either properly govern or coordinate the main processes involved (e.g., data collection, analysis, use), or to internalise some of these functions while ensuring that the city can adequately cooperate with other stakeholders within this realm. Bolstering the capacities of governments to work with technical consultants, academia, and engage in validating assumptions and results, for example, may be beneficial in the short-term. Developing cities in the region may perhaps benefit best by focusing on being a consumer of such data and integrating such technologies (and external entities) into the wider planning and policy cycle. An iterative approach that considers the rapidly evolving environment, resources, and technologies, should be considered, and a thorough assessment may lead cities to move towards internalising some of the other functions, depending on local context and goals. Another key issue when it comes to capacities are the institutional gaps. A central institution can either be set up, or an existing one be mandated to take charge of matters relating to Big Data. In the short or medium term, cities could explore assigning interim entities or perhaps multi-stakeholder bodies to act as focal points. A longer-term plan for institutionalising Big Data can then be explored, which will be dependent on strategic decisions that the city would take in terms of the roles it would take, and how it would mobilise the other relevant entities. Address infrastructure and technology gaps The infrastructure challenges (and the associated costs) have been pointed to as critical challenges for the use of Big Data. Cities should be cognisant of the emerging technological solutions that can serve as alternatives towards costly hardware – for example, cloud-based servers. Short-term upgrades of the city's equipment and technological assets need also consider potential requirements that can enable immediate use of Big Data for supporting internal or city-level processes. The determination of infrastructure requirements, and the earmarking of local funds, and the identification of other funding and financing resource, should be explored in the medium-term. Ultimately, the integration of Big Data-relevant infrastructure can be explored in wider city plans (i.e., in connection with the wider issues of low levels of connectivity), and possibilities for public-private partnerships can be investigated. Establish mechanisms for collaboration Developing cities are mostly confronted by significant limitations in terms of capacities, skills, and resources. Cities should actively facilitate the cooperation between different entities (e.g., private entities, academia, civil society) that are involved in data collection and generation, as well as those that can conduct analysis and data-to-information transformation. Supporting and collaborating with Big Data pilots can reveal whether such technologies are suitable at the local context, their benefits, risks, and requirements. Such pilots can better be facilitated through urban living labs which leverage the cooperation between different stakeholders to co-develop, evaluate, and iterate locally-adapted solutions – in this case, solutions that relate to Big Data and urban mobility. Urban mobility labs essentially are cooperation platforms with the goal to establish a forum for developing products, systems, and processes in the urban context. They are based on a participatory approach throughout the entire development, implementation, and evaluation process (150). The idea is that a coordinated mechanism is set up wherein potential solutions (e.g., in this case, Big Data-related technologies) are tested in specific contexts that try to address a specific issue The process is deemed to ideally result in a version that is best suited to the local conditions, and meets the restrictions imposed by such contexts. Such a living lab could explore shared responsibilities between the different stakeholders, for example, a working structure wherein the city authority can take the lead in the coordination of activities, as well as the use of the data, while the expert institutions handle the technical work, and the residents benefit directly from the solutions. It is also important to actively engage relevant mobility sector players such as public transport (formal and informal) operators and drivers, as well as the passengers (and relevant associations) in such initiatives. 67 AFRICA URBAN MOBILITY OBSERVATORY – BIG DATA TECHNOLOGIES AND INDICATORS REPORT Expert interviewees highlighted the need to establish Open Data portals. Cities can explore setting up their own Open Data Portal, or actively collaborate to expand existing ones (e.g., the Africa Urban Mobility Observatory portal) so that collaborative data generation, processing, and use (whether Big Data or non-Big Data) can be opened to interested parties. Support the promotion of Big Data The lack of participation from different stakeholders in Big Data can be driven by different factors such as the lack of general awareness regarding Big Data, concerns about data privacy, and the risks relating to the potential misuse of personal data, and the lack of awareness regarding the process. This can hinder the effectiveness of Big Data collection efforts. It is important that city authorities actively support such initiatives and facilitate dialogue and communication efforts to the relevant stakeholders. In the case of the UMA app, city authorities could actively promote it for usage, and support activities that explain the technology, its risks, and benefits. Leading by Doing is a further strategy that can spur interest and support towards Big Data use in the mobility sector. For example, cities can undertake and highlight an internally focused project which makes use of Big Data towards improving its own activities – this could mean, in one example, a small-scale pilot focusing on improving its own fleet operations using Big Data, or the use of the UMA app for its own employees for crafting innovative internal schemes. Such actions can lead towards increased support and attention from other external entities. The cities can also explore incentivising or supporting data generation initiatives through hackathons or collaborating with research studies. The development of user-centric programs focusing on raising the awareness regarding Big Data, its risks, and benefits, and would contribute towards better understanding how such technologies would perform in the local contexts. The points discussed above were drawn from discussions that took place at the city workshops described/outlined Table 31 and Table 32. Table 31: Identified key actions by the stakeholders in Blantyre Description of Identified Actions by the Local Stakeholders Integrating Big Data into Urban Mobility Planning • Elaboration of actions relating data towards achieving a vision towards "A congestion free city with integrated multi-modal, safe, clean, smart, inclusive, efficient, affordable transport system powered by renewable energy." Adopting appropriate local policies and regulations • Development of enabling policy at the local level; • Increase political will at Blantyre City Council level to prioritise data by elevating the awareness regarding its importance; • Explore other non-mobility policies which may influence the overall environment such (e.g., education policy and by-laws). Addressing Infrastructure and Technology Gaps • Frequent internal system upgrades; • Develop easy-to-understand graphic user interfaces; • Develop a city cell phone-based app for collection of data and dissemination of information; • Enhance connectivity in areas with low-capacity networks; • Lobbying city management and city political leadership to prioritise data in budget allocation (as well as the necessary equipment). Determining the City's Role and Building its Capacities • Build capacity within city to prioritise data collection and utilisation; • Create a substantive section/ department on research and development; • Improve working conditions at the city to attract and retain skilful/competitive workforce; • Providing digitalisation equipment for collection and analysis of data; • Strengthen skills/capacities of road agents in collecting data; • Trainings sensitisation of city professionals on data-oriented planning; • Find means to fund training. Establish mechanisms for collaboration • Clear and simple procedures to access data put forward by government • Collaboration of data players; • Deliberate policy for Government/City to have access to all data collected within its jurisdiction. 68 AFRICA URBAN MOBILITY OBSERVATORY – BIG DATA TECHNOLOGIES AND INDICATORS REPORT Supporting the Promotion of Big Data • Dissemination of information through civic education and sensitisation campaigns • Run innovation hubs and competition to improve tech knowhow amongst the city citizens; • Awareness campaigns to create demand for data; • Allocate resources to do with awareness campaigns; • Creating creative projects that can illustrate good planning using data. Table 32: Identified key actions by the stakeholders in Kigali Description of Identified Actions by the Local Stakeholders Integrating Big Data into Urban Mobility Planning • Elaboration of actions focusing on the utilisation of data towards a vision encompassing an integrated, safe, inclusive, accessible, affordable, and sustainable urban mobility system; • Establishing procedures relevant to data collection up to utilisation. Adopting appropriate local policies and regulations • Supportive policies for dedicating funds for data collection and management. Addressing Infrastructure and Technology Gaps • Improvement of ICT coverage in priority areas; • Explore the creation of a city-level database. Determining the City's Role and Building its Capacities • Capacity building programs for data science; • Centralised agency as a focal point for data; • Establishing routine trainings for professionals; • Identify gaps and needs for structural reform / streamlining of processes. Establish mechanisms for collaboration • Identifying opportunities for embedding flexibility in processes related to approvals from relevant agencies; • Strengthening the collaboration with international experts. Supporting the Promotion of Big Data • Seeking opportunities for international cooperation (e.g., training, research, study tours). 3.6.2 Sustainable Mobility Indicators The review of the initial set of indicators points towards the following recommendations: Retain and refine the existing set of indicators The relevance of the initial set of indicators was validated by local stakeholders, and the subject matter experts. There were no proposals that any of the indicators be dropped. However, there is a need to further refine the definitions as reflected in the portal, and possibly explore the refinement of the titles of some of the indicators. Explore the inclusion of additional indicators The validation exercise pointed towards the benefit of having additional indicators in the portal. For one, the current indicators are primarily focusing on urban passenger transport. The rapid growth in urban freight in the region, coupled with the fact that passenger and freight movements interact in the same system, points towards the need to explore priority indicators for urban freight. Perhaps those that would reflect the state of activity, structure, and potentially externalities that are related to urban freight. The use of Big Data (e.g., UMA) also allows for including additional indicators that can be derived from the data, for example, how to better reflect multi-modality. Explore the utilisation of the AUMO data with other sources Significant information about urban mobility (e.g., in relation to choice-making) can be uncovered when effectively combining existing Big Data (e.g., user movements) with other data reflecting the physical environment, transport services, and socioeconomic factors. There is also a need to explore the population of data for the indicators with secondary data. 69 AFRICA URBAN MOBILITY OBSERVATORY – BIG DATA TECHNOLOGIES AND INDICATORS REPORT 3.6.3 Data Collection Tools and Techniques USSD and WhatsApp Surveys It is recommended that should USSD surveys be employed to collect mobility data, these should be conducted on a longitudinal basis, whereby questions informing various indicators are spread across different campaign cycles, rather than attempting to collect data on all indicators during a single questionnaire session. This would reduce the likelihood of the USSD session timing out before completion of the full survey. Similarly, to reduce the mental burden on WhatsApp survey respondents, it is recommended that a similar longitudinal survey structure be adopted (since many WhatsApp survey respondents dropped off before the end of the survey, likely due to fatigue). It is also recommended that more accurate methods to determine travel distance be considered by those who wish to collect mobility data via USSD and WhatsApp. During the AUMO project, travel distance was defined on a centroid to centroid basis between TAZs – no attempt was made to assign trips to possible travel paths, and no attempts were made to achieve more accurate O-D pairs. This could perhaps be achieved through the use of OSM road and public transport data, and through a more accurate way of determine origin and destination locations. UMA In order to encourage greater uptake of UMA by prospective respondents, it is recommended that further attempts be made to integrate the SDK with existing apps, which have large existing userbases from which to recruit. This would likely aid in achieving the level of trust needed for prospective respondents to feel comfortable participating in a campaign involving location tracking. It should be noted that UMA is experimental software, and requires much more real-world data in order to calibrate the various machine-learning algorithms used to detect mode and identify transfers. It would be highly beneficial if a pilot campaign were to be conducted in partnership with transport authorities who have an existing app, and who would be potential beneficiaries of the data generated. This could help to accelerate the process of refining the software, thereby increasing the likelihood of generating accurate data. Stakeholder Engagement In the absence of literature to inform the process of conducting technology-based surveys, which required the support of many different stakeholder groups, a significant amount of energy was devoted to establishing who the relevant stakeholders were, and what the correct processes were in each city in order to conduct the various campaigns. Furthermore, given many of the survey techniques were novel, and therefore not familiar to these stakeholders, there was reluctance to support the campaigns due to the perceived risks. It is recommended that all future campaigns take into consideration the learnings outlined in this report, to ensure that stakeholders can be supplied with as much information about the processes, and previous successes and failures as possible. This would certainly reduce the high levels of perceived risk, and likely encourage more support. 70 AFRICA URBAN MOBILITY OBSERVATORY – BIG DATA TECHNOLOGIES AND INDICATORS REPORT 4. Sustainable Mobility Indicators - Results from the Data Collection in the AUMO Cities 4.1 Introduction This section presents the results of the consolidated data generated through the different data collection methods applied in the AUMO cities: Maseru, Lesotho; Lagos, Nigeria; Kinshasa, Democratic Republic of Congo; Gaborone, Botswana; and Blantyre, Malawi. The visualisations represent data generated through USSD, WhatsApp, and the conventional field surveys. The details of the data collection processes are explained in Section 3.5. Kigali has been excluded from the data and analysis that is presented in this section, as the necessary authorisations for data collection were not received from the local authorities in Kigali (further details are provided in Section 3.5.3.2). Further, the analysis also does not include the data obtained from the UMA surveys, since there were just 47 UMA participants across the research cities. 4.2 Mobility 4.2.1 Mode share Mode share has been calculated in the AUMO project based on the main mode of transport (i.e., the mode that covers the most distance) used by respondents to reach their primary regular activity location (such as trips to and from school, work, and shops). All five project cities have various transportation modes. A scheduled public transportation system, though, is available only in Lagos and Kinshasa. About 15% of the trips in Lagos are made by bus and Bus Rapid Transit (BRT). The BRT use in Lagos appears, based on the responses, to be higher during off-peak hours. Paratransit is the dominant mode, comprising commonly of moto-taxis (2-wheeler taxis) and minibus taxis, in all the project cities, with most respondents travelling by minibus taxi. Private vehicle use is highest in Blantyre among the project cities. Among the 5 project cities, a majority of the respondents (73%) in Gaborone use minibus taxis, possibly due to the lack of other paratransit modes. Despite high motor vehicle use, walking is also a prominent mode of travel in Blantyre, also during peak hours. The other project cities also feature some extent of walking. Only in Lagos, Maseru, and Blantyre did respondents report the use of bicycles. With the availability of water channels, about 1% of the respondents in Lagos report using ferry services for commuting. Reaching healthcare was the trip purpose for the majority of the ferry users, who were aged more than 65 years old. Figure 39: Mode share of the AUMO cities, excluding Kigali, based on the surveys 71 AFRICA URBAN MOBILITY OBSERVATORY – BIG DATA TECHNOLOGIES AND INDICATORS REPORT Figure 40: Mode share of AUMO project cities depending on the travel period Figure 41: Mode share of AUMO cities, excluding Kigali, based on trip purpose Figure 42: Mode share in AUMO cities, excluding Kigali, based on gender Figure 43: Mode share in AUMO cities, excluding Kigali, based on age 72 AFRICA URBAN MOBILITY OBSERVATORY – BIG DATA TECHNOLOGIES AND INDICATORS REPORT Figure 44: Mode share in AUMO cities, excluding Kigali, based on income level 4.2.2 Distance travelled and travel time Respondents from Lagos travel the furthest (more than 9 km/trip) and take over 60 minutes for their travel. Respondents in Maseru and Blantyre travel about 5 km per trip and take more than 50 minutes to complete the journey, suggesting that either the travel conditions are poor, or that travel modes are slower as it takes longer to travel short distances. The mode share responses reveal that about 90% of the respondents in Maseru use motorised modes and around 64% in Blantyre use motorised modes. In Lagos, Gaborone, and Maseru, men travel farther than women, in Kinshasa women travel farther, and in Blantyre the travel distances of men and women are similar but with women travelling slightly further than men. Figure 45: Average travel distance and travel time in AUMO cities, excluding Kigali 73 AFRICA URBAN MOBILITY OBSERVATORY – BIG DATA TECHNOLOGIES AND INDICATORS REPORT Figure 46: Average travel distance according to gender in AUMO cities, excluding Kigali 4.2.3 Transfers The respondents who reported their main mode of transport was either public transport or paratransit were asked on how frequently they changed vehicles to reach their destinations. In all the project cities except Lagos (and excluding Kigali), the majority of the respondents did not need to transfer to reach their destination. In Lagos, a transfer to a different mode is required at least once, which could be because in Lagos there are multiple transport modes covering different parts of the city and hence a transfer might be necessary more than once, especially when the travel distance is long (as they are in Lagos). High-income respondents in Lagos do not transfer to reach their destination, which could indicate that they live in an area where the transport or paratransit service directly reaches their destination. This could be further corroborated with a detailed land-use analysis. Similarly, in Blantyre, most of the low-income respondents report that they do not have to transfer, while some of the high-income respondents report that they need to transfer twice. Figure 47: Frequency of transfers in a trip in AUMO cities, excluding Kigali Figure 48: Frequency of transfers according to income level in AUMO cities, excluding Kigali 74 AFRICA URBAN MOBILITY OBSERVATORY – BIG DATA TECHNOLOGIES AND INDICATORS REPORT 4.2.4 Accessibility In order to aid the investigation of using openly accessible data to feed into the analysis of the state of cities in relation to relevant indicators such as SDG Indicator 11.2.1: Proportion of the population that has convenient access to public transport, an exercise using open data sets from Open Street Maps (OSM) (151) and WorldPop data (152) was carried out by the study team. Please note that this exercise did not directly utilise the data collected from the surveys conducted in the AUMO cities but utilised openly accessible data. OSM was primarily used to extract transportation infrastructure data (e.g., road network, public transport stations, stops), while the population distribution is extracted from WorldPop. The WorldPop data set was chosen for this exercise as it is openly available, and it contains recent (e.g., up to 2020) data at the 100-meter resolution. A network analysis exercise was conducted using QGIS, an opensource Geographic Information System (GIS) software, using the service area (from layer) function (153). The extracted public transport facilities (i.e., stations, stops) were assigned as the "origins" and the road network was used as the "network." The goal of the exercise is to identify the extent of the buffered area which can be reached within 500 metres of the public transport stations. Buffer zones for (500 metres) areas for each of the stations were created and were used to estimate the percentage of the population that reside within these buffer zones (by dividing the estimated population within the buffers against the total population estimated for the area set as per the city geographical boundary layer). The main goal of the exercise was to get insights on what might be the potential for a heuristics approach of using openly available data (without much processing and cleaning) together with open-source programs (e.g., QGIS) towards understanding the state of cities in relation to the indicator. The results are provided below in Table 33 and are compared with the existing estimates of the UN-Habitat (154). Table 33: Estimated % of Population with Convenient Access to Public Transport Kigali Kinshasa Lagos Maseru Blantyre Gaborone AUMO Exercise 29.1% 15.5% 6.8% 7.0% 4.6% 86.5% UN-Habitat 50.3% 17.4% 38.1% 15.4% The results for Kinshasa are similar to the estimate of UN-Habitat, while there are stark differences for Kigali, Blantyre, and Lagos. These differences can perhaps be attributed to the difference in terms of definitions. For example, the service area in UN's methodology (155) defined as the "area served by public transport within 500 meters walking distance to a low capacity system and/or 1 km to a high-capacity system based on the street network." The latter portion was not taken into consideration in this exercise due to lack of consistency in terms of identifiers in the public transport data across the cities. There is also an inherent limitation in this exercise, as only OSM data was used, while the UN exercise used several other data sets that might not be available online, as per the methodology provided. Another key limitation in this approach is that the public transport stops reflected in open portals such as OSM may be limited to the main stations and may not necessarily capture how public transport services in developing (including those in Africa) cities work, particularly in capturing how non-scheduled, non-route based public transport services perform towards providing accessibility. On the other hand, using a heuristics approach provide useful insights that can drive action at the local level. The current database of estimates from the UN (154) does not have estimates for other cities such as Maseru and Gaborone. Also, visual outputs such as the ones provided below, can be useful in driving discussions towards actions, not only in terms of potential strategies to improve the state of accessibility, but also in terms of improving the availability, and access to relevant data such as those relating to population distribution and public transport infrastructure and services. As mentioned in the suggestion discussed in Section 3.4.2.1, it might be beneficial to conduct similar exercises considering other points of interests reflecting basic services (e.g., educational, health, commercial facilities) aside from public transport stops, to have a more holistic view of the state of accessibility in the cities. 75 AFRICA URBAN MOBILITY OBSERVATORY – BIG DATA TECHNOLOGIES AND INDICATORS REPORT Figure 49: Accessibility to Public Transport: Blantyre Figure 50: Accessibility to Public Transport: Gaborone Figure 51: Accessibility to Public Transport: Kigali Figure 52: Accessibility to Public Transport: Kinshasa Figure 53: Accessibility to Public Transport: Lagos Figure 54: Accessibility to Public Transport: Lesotho 76 AFRICA URBAN MOBILITY OBSERVATORY – BIG DATA TECHNOLOGIES AND INDICATORS REPORT 4.3 Public Transport Experience 4.3.1 Public perception on comfort in public transport The respondents were asked to choose from "Poor," "Acceptable," and "Excellent" to denote their perception on the comfort level during their journey on public transport. Over 50% of the respondents from Blantyre report that the public transport comfort level is poor. The share of respondents who report an excellent level of public transport comfort is about 10% across the project cities (excluding Kigali). Less than 1% of respondents from Kinshasa report an excellent level of public transport comfort. The majority of the respondents report that the public transport comfort level is acceptable. Contrary to expectation, across the project cities, the perception of comfort levels during peak hours seems to be better than off-peak hours. One potential reason for this is that question might not have been fully understood (e.g., the use of the terms peak and off peak) by the respondents. Across all the project cities males report a high level of discomfort by rating the comfort level as poor, the highest being in Blantyre. Respondents from Blantyre and Kinshasa report a high level of discomfort across the 5 AUMO cities surveyed. Figure 55: Perceived level of comfort in public transport in AUMO cities, excluding Kigali Figure 56: Perceived comfort level in public transport during travel period in AUMO cities, excluding Kigali 77 AFRICA URBAN MOBILITY OBSERVATORY – BIG DATA TECHNOLOGIES AND INDICATORS REPORT Figure 57: Perceived level of comfort depending on trip purpose in AUMO cities, excluding Kigali Figure 58: Perceived level of comfort according to gender in AUMO cities, excluding Kigali 4.3.2 Public Transit Reliability Reliability of public transport plays an important role in the uptake of public transport in any city. About 60% of the respondents from Blantyre report that the public transport is usually late, followed by Kinshasa where about 50% of the respondents report that public transport is delayed. Over 50% of the respondents from Maseru and Lagos, and over 80% of respondents from Gaborone, report that the public transport is "usually on time". The majority of the responses indicating that the public transport is unreliable is from respondents whose trip purpose is for employment, education, or healthcare. Figure 59: Perceived public transport reliability in AUMO cities, excluding Kigali 78 AFRICA URBAN MOBILITY OBSERVATORY – BIG DATA TECHNOLOGIES AND INDICATORS REPORT Figure 60: Perceived public transport reliability during travel period Figure 61: Perceived public transport reliability based on trip purpose Figure 62: Perceived public transport reliability based on gender 4.3.3 Public perception on breakdowns Public transport breakdowns seem to occur sometimes based on the responses from the 5 cities. More than half of the respondents in Kinshasa report that breakdowns never occur, in all the 5 cities respondents feel that breakdowns occur at times. The share of dissatisfaction due to breakdowns among the respondents seem to be higher in Blantyre, Lagos, and Maseru. Previous research in Maseru pointed that the traffic congestion in Maseru is a common feature and can be caused by poor roads (77), and/or aged vehicles. A further analysis of the fleet characteristics from the various private transport operators would reveal more 79 AFRICA URBAN MOBILITY OBSERVATORY – BIG DATA TECHNOLOGIES AND INDICATORS REPORT specific reasons for the breakdown of the vehicles and enable the possibility to explore relationships between public perception on breakdowns with the actual situation. Figure 63: Public perception on the frequency of public transport breakdown in AUMO cities, excluding Kigali Figure 64: Public perception on the frequency of public transport breakdown during specific travel periods in AUMO cities, excluding Kigali 4.3.4 Driver Behaviour A very small share of respondents perceive that the driver behaviour is excellent in all the project cities. Majority of the respondents feel that the driver behaviour is acceptable in the cities and a large share of respondents also feel that the driver behaviour is poor. The responses are comparable form respondents of both the genders. Figure 65: Perceived driver behaviour in AUMO cities, excluding Kigali 80 AFRICA URBAN MOBILITY OBSERVATORY – BIG DATA TECHNOLOGIES AND INDICATORS REPORT Figure 66: Perceived driver behaviour during specific travel periods in AUMO cities, excluding Kigali Figure 67: Perceived driver behaviour based on respondents' gender in AUMO cities, excluding Kigali 4.3.5 Sexual Harassment As reported by the EMPOWER project (a sister project of AUMO, also part of the HVT programme), accurately measuring people's experiences of sexual harassment is often challenging (157). Interpretations of what constitutes sexual harassment vary widely, and often even those who have personally experienced or witnessed sexual harassment, may not recognise it as such. Given the AUMO project did not follow the EMPOWER methodology, which places substantial efforts on ensuring that survey respondents understand what constitutes sexual harassment, it is likely that there was underreporting of experienced and witnessed sexual harassment by AUMO survey respondents. Respondents from Maseru and Blantyre report that they have been subject to harassment more than once on public transport. It is important to note that the nature of the harassment is not revealed from the available responses, hence it is difficult to deduce what sexual harassment entails. Figure 68: Sexual harassment on public transport in AUMO cities, excluding Kigali 81 AFRICA URBAN MOBILITY OBSERVATORY – BIG DATA TECHNOLOGIES AND INDICATORS REPORT Figure 69: Sexual harassment on public transport based on respondents' gender in AUMO cities, excluding Kigali 4.3.6 Crime More than half of the respondents in all the project cities (excluding Kigali) report that they have never experience any crime on the public transport, followed by about 20% of the respondents reporting they have either experienced crime once or more than once. A very small share report that they have experienced crime often. Among the project cities, respondents from Kinshasa and Maseru experienced more crime on public transport in comparison to the other project cities, and the frequency of the crime is high in Kinshasa during the non-peak hours. Other researches from Africa show that crime rates seem to increase when there is overcrowding and inadequate policing (158,159). Figure 70: Perceived crime situation on public transport in AUMO cities, excluding Kigali Figure 71: Perceived crime situation on public transport during travel periods in AUMO cities, excluding Kigali 82 AFRICA URBAN MOBILITY OBSERVATORY – BIG DATA TECHNOLOGIES AND INDICATORS REPORT Figure 72: Perceived crime situation on public transport based on gender in AUMO cities, excluding Kigali 4.4 Vehicle Efficiency 4.4.1 Vehicle Occupancy The public transport occupancy in majority of the reporting cities is reported to be medium. Gaborone and Maseru have a low peak public transport occupancy during peak and off-peak hours. The low occupancy may denote due to the poor quality, coverage, and lack of priority of public transport. Blantyre and Lagos are reported to have medium to high occupancy on public transport during the peak hours. A potential reason in Lagos is the trip distances, since the commuters travel almost 10 km for a trip, using public transport is economical. Figure 73: Perception on vehicle occupancy of public transport during travel periods in AUMO cities, excluding Kigali Figure 74: Perception on vehicle occupancy of public transport based on income level in AUMO cities, excluding Kigali 83 AFRICA URBAN MOBILITY OBSERVATORY – BIG DATA TECHNOLOGIES AND INDICATORS REPORT 4.5 Summary In this section, we have shown that data can provide valuable insights into the travel characteristics and behaviour of users. Data can provide key inputs to policy makers and operators. For example, identifying that the trip distances in Lagos are long and the perception of public transport in Lagos. The city policy makers can explore alternatives to the current transport offering. Providing priority to public transport and allowing public transport to move faster can allow users to reach their destinations in less time. Such information can also allow transport operators to decide if they wish to operate non-stop services from key origins and destinations. The data also segregates the public perception on public transport based on gender. In a conventional data collection exercise, the user surveys are conducted at fixed intervals and are subject to availability of resources. With innovative data collection methods, users can submit responses any time and the data are processed in real time, allowing transport operators to assess their performance instantly. In many of the cities, the respondents have reported that public transport vehicles are susceptible to breakdowns. The transport operators could explore the causes of breakdowns and increase resources allocated to maintenance. For public transport operators, having real time information on the system operation allows them to arrange for substitute modes and attend to passenger needs. The real time information systems constitute vehicle telematics, such as GPS devices, direct communication with the driver and the travel logs. Having vehicle telematics systems will provide information such as the vehicle location, trip pattern, routes, fuel consumption and driving behaviour. The innovative element that the AUMO project brings is a new method of collecting large swathes of data directly from the users. This new method will require certain level of trust, in both technological and legal aspects, which can be developed through proper dissemination and involvement of the right entities (both governmental and non-governmental). As the technology gradually becomes an integral part of the day-today life of users, having smart devices can also become a key feedback submission portal. Through passive data collection techniques, the personal data of the user is anonymised and protected and only the data that the user wishes to share is processed. 84 AFRICA URBAN MOBILITY OBSERVATORY – BIG DATA TECHNOLOGIES AND INDICATORS REPORT 5. References 1. Methodology - Standard country or area codes for statistical use (M49) [Internet]. United Nations Statistics Division (UNSD). [cited 2022 Aug 13]. Available from: https://unstats.un.org/unsd/methodology/m49 2. World Bank. Urban population [Internet]. 2018. Available from: https://data.worldbank.org/indicator/SP.URB.TOTL 3. UN-Habitat. 2020-2023 Strategic Plan. Regional Representation for Africa. [Internet]. 2021. Available from: https://unhabitat.org/sites/default/files/2021/06/regional_representation_for_africa_6_005.pdf 4. Arroyo-Arroyo F, Finn B, van Ryneveld P. Urban Mobility in African Cities: Developing National Urban Mobility Policy and Delivering at the City level. Washington, DC: SSATP; 2021. 5. Baeribameng Yiran GA, Dziwornu Ablo A, Elikplim Asem F, Owusu G. Urban Sprawl in sub-Saharan Africa: A review of the literature in selected countries. Ghana Journal of Geography. Vol. 12 No. 1. 2020; 6. ITF Transport Statistics [Internet]. OECD; n.d. Available from: https://www.oecd-ilibrary.org/transport/data/itf-transportstatistics_trsprt-data-en 7. Cirolia LR, Harber J, Croese S. Governing mobility in Sub-Saharan African cities. The state of knowledge and research. Gothenburg, Sweden: Volvo Research and Educational Foundations; 2020. 8. Behrens R, McCormick D, Mfinanga D, editors. Paratransit in African cities: operations, regulation and reform. 1 Edition. London ; New York: Routledge, Taylor & Francis Group; 2016. 311 p. 9. Cervero R, Golub A. Informal transport: A global perspective. Transp Policy. 2007;14:445–57. 10. Kumar A. Understanding the emerging role of motorcycles in African cities. A political economy perspective [Internet]. The International Bank for Reconstruction and Development/The World Bank; 2011 [cited 2019 Nov 3]. (Urban Transport Series). Report No.: SSATP Discussion Paper No. 13. Available from: http://documents.worldbank.org/curated/en/391141468007199012/pdf/669410NWP0DP130IC00Role0Motorcycles.pdf 11. Ehebrecht D, Heinrichs D, Lenz B. Motorcycle-taxis in sub-Saharan Africa: Current knowledge, implications for the debate on "informal" transport and research needs. J Transp Geogr. 2018;69:242–56. 12. Boutueil V. Urban mobility under influence: Trends and prospects for the digitization of mobility services in Africa. In: Mobility and Transportation. 2021. (Les ateliers). 13. Spooner D, Manga E. Nairobi Bus Rapid Transit. Labour Impact Assessment Research Report. [Internet]. Global Labour Institute Manchester; 2019. Available from: https://gli-manchester.net/wp-content/uploads/2019/04/Nairobi-Bus-Rapid-TransitReport.pdf 14. Jia W, Beukes EA, Coetzee J, Van Ryneveld P. Improving Paratransit in Maseru and Gaborone [Internet]. World Bank, Washington, DC; 2022 [cited 2022 Jun 27]. Available from: https://openknowledge.worldbank.org/handle/10986/37301 15. McCormick D, Mitullah W, Chitere P, Orero R, Ommeh M. Matatus business strategies in Nairobi. In: Paratransit in African cities: operations, regulation and reform. 1 Edition. London ; New York: Routledge, Taylor & Francis Group; 2016. 16. Mfinanga D, Madinda E. Public transport and daladala service improvement prospectes in Dar es Salaam. In: Paratransit in African cities: operations, regulation and reform. 1 Edition. London ; New York: Routledge, Taylor & Francis Group; 2016. 17. Porter G, Abane A, Lucas K. User diversity and mobility practices in Sub-Saharan African cities: understanding the needs of vulnerable populations. The state of knowledge and research. Gothenburg, Sweden: Volvo Research and Educational Foundations; 2020. 18. UN Environment. Global Outlook on Walking and Cycling Policies & realities from around the world [Internet]. 2016. Available from: https://wedocs.unep.org/bitstream/handle/20.500.11822/17030/globalOutlookOnWalkingAndCycling.pdf?sequence=1&%3 BisAllowed= 19. City of Kigali. Transport Plan Kigali Master Plan 2050. 2020 Edition [Internet]. 2020. Available from: https://masterplan2020.kigalicity.gov.rw/portal/sharing/rest/content/items/20035176446647f68a78ef60d84bb2a8/data 20. Benavides C, Tuniz J, Owigar J, Bosch L, Holzwarth S, Satsiru S. Africa Urban Mobility Observatory. Policy and Planning Insights Report. 2022. (Africa Urban Mobility Observatory). 21. World Health Organisation. Global status report on road safety 2018: summary [Internet]. Geneva: World Health Organisation; 2018. Available from: https://apps.who.int/iris/bitstream/handle/10665/277370/WHO-NMH-NVI-18.20-eng.pdf 22. Klopp JM. Towards a Political Economy of Transportation Policy and Practice in Nairobi. Urban Forum. 2012 Mar;23(1):1–21. 23. Sietchiping R, Permezel MJ, Ngomsi C. Transport and mobility in sub-Saharan African cities: An overview of practices, lessons and options for improvements. Cities. 2012;29(3):183–9. 24. United Nations Human Settlements Programme, editor. Planning and design for sustainable urban mobility: global report on human settlements 2013. Abingdon, Oxon: Routledge; 2013. 317 p. 85 AFRICA URBAN MOBILITY OBSERVATORY – BIG DATA TECHNOLOGIES AND INDICATORS REPORT 25. Nair V, Phillips D, Prinz D, Seid E, Warwick R. 'Green' motor taxation: issues and policy options in sub-Saharan Africa. [Internet]. The Institute for Fiscal Studies; 2021 Sep. Available from: https://www.taxdev.org/sites/default/files/2021- 09/20210910_Report_green_motor_taxation-compressed_2_0.pdf 26. UN Environment. Used Vehicles and the Environment. A Global Overview of Used Light Duty Vehicles: Flow, Scale and Regulation. Nairobi; 2020. 27. Sum4all. Policy Decision-Making Tool for Sustainable Mobility 3.0 [Internet]. [cited 2022 Aug 4]. Available from: https://www.sum4all.org/gra-tool/country-performance/global 28. Baeribameng Yiran GA, Dziwornu Ablo A, Elikplim Asem F, Owusu G. Urban Sprawl in sub-Saharan Africa: A review of the literature in selected countries. Ghana Journal of Geography. Vol. 12 No. 1. 2020; 29. McCormick D, Schalekamp H, Mfinanga D. The nature of paratransit operations. In: Paratransit in African cities: operations, regulation and reform. Routledge, Taylor&Francis Group. London ; New York: Routledge, Taylor & Francis Group; 2016. 30. Klopp J, Mitullah W. Politics, policy and paratransit: a view from Nairobi. In: Paratransit in African cities: operations, regulation and reform. London ; New York: Routledge, Taylor & Francis Group; 2016. 31. Jenning G, Bruun E, Orero R, McCormick D, Browning P. Strategy options for paratransit business development and service improvement. In: Paratransit in African cities: operations, regulation and reform. London ; New York: Routledge, Taylor & Francis Group; 2016. 32. Baskin A, Gukowski L. Bridging the gender data divide in African cities. Leveraging the power of data to ensure women's mobility needs are centre stage. Internationales Verkehrswesen (. (73) 3. 2021; 33. Peralta-Quiros T, Kerzhner T, Avner P. Exploring Accessibility to Employment Opportunities in African Cities : A First Benchmark. World Bank Group; 2019. Report No.: Policy Research Working Paper 8971. 34. Getachew Demissie M, Phithakkitnukoon S, Sukhvibul T, Antunes F, Gomes R, Bento C. Inferring Passenger Travel Demand to Improve Urban Mobility in Developing Countries Using Cell Phone Data: A Case Study of Senegal. IEEE Transactions on Intelligent Transportation Systems. (17) 9. 2016; 35. Franck C, Martin E, Kalisa E, Nkurunziza A, Bitangaza M. Know the air you breath: Mapping air quality in Kigali. Urban Pathways; 2021. 36. Nairobi City County (NCC). The Project on Integrated Urban Development Master Plan for the City of Nairobi in the Republic of Kenya. Final Report. Part II: The Master Plan [Internet]. 2014 [cited 2020 Jan 23]. Available from: https://www.jica.go.jp/english/news/field/2015/c8h0vm0000966zqy-att/c8h0vm0000966zvu.pdf 37. Martin E. Taking a sustainability turn? Stakeholder perceptions on electrification of motorcycle taxis in Nairobi, Kenya [Internet] [Master thesis]. Technical University Berlin; 2020. Available from: https://www.urbanmanagement.tuberlin.de/fileadmin/f6_urbanmanagement/UM_Thesis_Emilie_Martin_-_Nber_402539.pdf 38. Rollason W. Crisis as resource: entrepreneurship and motorcycle taxi drivers in Kigali. African Identities. 18 (3). 2020;263–78. 39. Japan International Cooperation Agency : Nippon Koei Co., Ltd. Data Collection Survey on Development of Urban Transport System in Kigali City Final Report. Chapter 5: Status of Urban Transport in the City of Kigali [Internet]. 2019. Available from: https://openjicareport.jica.go.jp/pdf/12345005_02.pdf 40. Evans J, O'Brien J, Ch Ng B. Towards a geography of informal transport: Mobility, infrastructure and urban sustainability from the back of a motorbike. Trans Inst Br Geogr. 2018;43(4):1–15. 41. Jennings G, Muchaka P, Cooke S, Zuidgeest M. Global Outlook on Walking and Cycling [Internet]. Available from: https://wedocs.unep.org/bitstream/handle/20.500.11822/17030/globalOutlookOnWalkingAndCycling.pdf 42. Boateng FG, Appau S, Baako KT. The rise of 'smart' solutions in Africa: a review of the socio-environmental cost of the transportation and employment benefits of ride-hailing technology in Ghana. Humanit Soc Sci Commun. 2022 Dec;9(1):245. 43. Interpersonal communication. AEMDA ChargeUp 1st Working Group Meeting. 2022. 44. Cassius S, El Deeb N, Sorour M, Turner S. Future of Paratransit and Shared Mobility: Mapping Report [Internet]. ITDP & VREF; 2021. Available from: https://www.itdp.org/wp-content/uploads/2021/06/Future-of-Paratransit-and-Shared-Mobility-MappingReport-2021.pdf 45. International Monetary Fund. Digitalizing Sub-Saharan Africa: Hopes and Hurdles. International Monetary Fund; 2020. 46. World Bank. Individuals using the Internet (% of population) [Internet]. 2022a. Available from: https://data.worldbank.org/indicator/IT.NET.USER.ZS 47. International Telecommunication Union. Digital trends in Africa 2021. Information and communication AFRICA technology trends and developments in the Africa region 2017-2020. International Telecommunication Union; 2021. (ITUPublications. Africa). 48. Andersson-Manjang SK, Naghavi N. State of the Industry Report on Mobile Money 2021. GSMA; 2021. 86 AFRICA URBAN MOBILITY OBSERVATORY – BIG DATA TECHNOLOGIES AND INDICATORS REPORT 49. World Bank. Fixed broadband subscriptions (per 100 people) [Internet]. 2022c. Available from: https://data.worldbank.org/indicator/IT.NET.BBND.P2 50. Alper CE, Miktus M. Digital Connectivity in Sub-Saharan Africa: A Comparative Perspective. International Monetary Fund; 2019. 51. International Telecommunication Union. Digital trends in Africa 2021. Information and communication AFRICA technology trends and developments in the Africa region 2017-2020. International Telecommunication Union; 2021. (ITUPublications. Africa). 52. United Nations Department of Economic and Social Affairs. UN E-Government Knowledgebase [Internet]. 2022. Available from: https://publicadministration.un.org/egovkb/en-us/Data-Center 53. UNESCO Institute for Statistics. UIS.Stat [Internet]. UIS.Stat. Available from: http://data.uis.unesco.org/ 54. GSMA. The Mobile Economy Sub-Saharan Africa 2021 [Internet]. 2021. Available from: https://www.gsma.com/mobileeconomy/wp-content/uploads/2021/09/GSMA_ME_SSA_2021_English_Web_Singles.pdf 55. Government of Malawi. Digital Government Strategy [Internet]. Department of E-Government, Ministry of Information, Republic of Malawi; 2019. Available from: https://api.pppc.mw/storage/161/DIGITAL-GOVERNMENT-STRATEGY-BOOK.pdf 56. African Development Bank. Lesotho - Egovernment Infrastructure - Project Completion Report [Internet]. African Development Bank - Building today, a better Africa tomorrow. African Development Bank Group; 2022 [cited 2022 Aug 24]. Available from: https://www.afdb.org/en/documents/lesotho-egovernment-infrastructure-project-completion-report 57. Rich R, Westerberg P, Torner J. Smart City Rwanda Masterplan, Vision 2.0. [Internet]. 2017 [cited 2022 Aug 4]. Available from: https://unhabitat.org/smart- city- rwanda- master- plan 58. Kirby P. Data Requirement Analysis and Data Mapping [Internet]. UNICEF; 2018. (UNICEF Lesotho). Available from: https://developmentgateway.org/wp-content/uploads/2020/08/UNICEF_Lesotho_Diagnostic.pdf 59. World Bank. How Digital Integration has Transformed Kenya's Transport Sector [Internet]. World Bank. 2021 [cited 2022 Jun 24]. Available from: https://www.worldbank.org/en/news/feature/2021/05/12/how-digital-integration-has-transformed-kenya-stransport-sector 60. Malawi Government. Electronic Transactions and Cyber Security Act, 2016,. 2016. (The Malawi Gazette Supplement, dated 4th November, 2016, containing Acts (No. 6C)). 61. RURA. GOVERNING LICENSING IN ELECTRONIC COMMUNICATION [Internet]. Rwanda Utilities Regulatory Authority; 2021. (REGULATION No 013/R/EC-ICT/RURA/2021 OF 25/02/2021). Available from: https://rura.rw/fileadmin/Documents/ICT/Laws/Regulation_Governing_Licensing_in_Electronic_Communication_in_Rwanda.pdf 62. Statistics Botswana. Statistics Botswana Data Dissemination Policy. 2016. 63. OneTrust. Botswana - Data Protection Overview [Internet]. DataGuidance. 2022 [cited 2022 Aug 24]. Available from: https://www.dataguidance.com/notes/botswana-data-protection-overview 64. Parliament of Botswana. Data Protection Act [Internet]. 2018. Available from: https://www.bocra.org.bw/sites/default/files/documents/DataProtectionAct.pdf 65. Republic Democratique Du Congo. LoI N0 20/017 relative aux telecommunications et aux technologies de l' information et de la communication [Internet]. 2020. Available from: https://www.primature.cd/public/wp-content/uploads/2022/04/LoiN%C2%B020-017-du-25-novembre-relative-aux-Te%CC%81le%CC%81com_08-12-020.pdf 66. NITDA. Nigeria Data Protection Regulation 2019 [Internet]. National Information Technology Development Agency; 2019. Available from: https://nitda.gov.ng/wp-content/uploads/2020/11/NigeriaDataProtectionRegulation11.pdf 67. NITDA. Nigeria Data Protection Regulation 2019: Implementation Framework [Internet]. National Information Technology Development Agency; 2020. Available from: https://nitda.gov.ng/wp-content/uploads/2021/01/NDPR-ImplementationFramework.pdf 68. Truter C, Loubser C. Africa Guide to Data Protection [Internet]. Bowmans; 2022. Available from: https://www.bowmanslaw.com/wp-content/uploads/2022/06/Data-Protection_01.06.2022.pdf 69. Federal Republic of Nigeria. Data Protection Bill, 2020. 2020. 70. Lesotho Government. Data Protection Act, 2011. 2012. (Lesotho Government Gazette). 71. Republic of Rwanda. LAW N° 058/2021 of 13/10/2021. Republic of Rwanda; 2021. (Official Gazette n° Special of 15/10/2021). 72. RURA. CYBERSECURITY REGULATION N ̊010/R/CR-CSI/RURA/020 OF 29/05/2020. Rwanda Utilities Regulatory Authority; 2020. 73. Republic of Rwanda. LAW N° 04/2013 OF 08/02/2013 RELATING TO ACCESS TO INFORMATION. 2013. (Official Gazette No. 10 of 11 March 2013). 74. Kainja J. State of Internet Freedom in Malawi: Privacy and Personal Data: Challenges and Trends in Malawi. 2018. 75. HOT. Humanitarian OpenStreetMap Team [Internet]. 2022 [cited 2022 Jun 29]. Available from: https://www.hotosm.org/ 87 AFRICA URBAN MOBILITY OBSERVATORY – BIG DATA TECHNOLOGIES AND INDICATORS REPORT 76. WRI Ross Center. 4 Initiatives Working to Map and Improve Informal Transit in Africa | [Internet]. TheCityFix. 2022 [cited 2022 Jun 24]. Available from: https://thecityfix.com/blog/4-initiatives-working-to-map-and-improve-informal-transit-in-africa/ 77. Jia W, Beukes EA, Coetzee J, Van Ryneveld P. Improving Paratransit in Maseru and Gaborone [Internet]. World Bank, Washington, DC; 2022 [cited 2022 Jun 27]. Available from: https://openknowledge.worldbank.org/handle/10986/37301 78. General Transit Feed Specification [Internet]. GTFS: Making Public Transit Data Universally Accessible. [cited 2022 Jun 16]. Available from: https://gtfs.org/ 79. DT4A. Africa - Mobility data from cities in Africa [Internet]. GitLab. 2022 [cited 2022 Jun 30]. Available from: https://gitlab.com/digitaltransport/data/africa 80. Milusheva S, Marty R, Bedoya G, Williams S, Resor E, Legovini A. Applying machine learning and geolocation techniques to social media data (Twitter) to develop a resource for urban planning. Chen F, editor. PLOS ONE. 2021 Feb 3;16(2):e0244317. 81. Demissie MG, Phithakkitnukoon S, Sukhvibul T, Antunes F, Gomes R, Bento C. Inferring Passenger Travel Demand to Improve Urban Mobility in Developing Countries Using Cell Phone Data: A Case Study of Senegal. IEEE Trans Intell Transp Syst. 2016; 82. Klopp, J. M., Cavoli, C. The Paratransit Puzzle: Mapping and Master Planning for Transportation in Maputo and Nairobi. In: Uteng TP, Lucas K, editors. Urban Mobilities in the Global South [Internet]. 1st ed. Routledge; 2017 [cited 2022 Jun 23]. Available from: https://www.taylorfrancis.com/books/9781351966023 83. TAP&GO [Internet]. [cited 2022 Jun 27]. Available from: https://www.itu.int/net4/wsis/archive/stocktaking/Project/Details?projectId=1487839096 84. DT4A. Projects [Internet]. DigitalTransport4Africa. [cited 2022 Jun 23]. Available from: https://digitaltransport4africa.org/projects/ 85. TfC. Kampala and Parantransit street usage study [Internet]. Transport for Cairo. 2020 [cited 2022 Jun 23]. Available from: https://transportforcairo.com/2020/09/01/kampala/ 86. Transitec. Paratransit and street usage study in Kampala, Uganda [Internet]. [cited 2022 Jun 23]. Available from: https://transitec.net/en/actualites/item/10921-paratransit-and-street-usage-study-in-kampala-uganda.html/ 87. Data Transport. We Improve African Mobility through transit Data. [Internet]. Data Transport. 2022 [cited 2022 Jun 29]. Available from: https://data-transport.org/ 88. Jagadish HV, Gehrke J, Labrinidis A, Papakonstantinou Y, Patel JM, Ramakrishnan R, et al. Big data and its technical challenges. Commun ACM. 2014;57(7):86–94. 89. Sivarajah U, Kamal MM, Irani Z, Weerakkody V. Critical analysis of Big Data challenges and analytical methods. J Bus Res. 2017;70(1):263–86. 90. McAfee Andrew, Brynjolfsson E. Big Data: The Management Revolution. Harv Bus Rev. 2012; 91. Gandomi A, Haider M. Beyond the hype: Big data concepts, methods, and analytics. Int J Inf Manag. 2015;35(2):137–44. 92. Hashem IAT, Chang V, Anuar NB, Adewole K, Yaqoob I, Gani A, et al. The role of big data in smart city. Int J Inf Manag. 2016;36(5):748–58. 93. Chen M, Mao S, Liu Y. Big Data: A Survey. Mob Netw Appl. 2014;19(2):171–209. 94. Wamba SF, Akter S, Edwards A, Chopin G, Gnanzou D. How `big data' can make big impact: Findings from a systematic review and a longitudinal case study. Int J Prod Econ. 2015;165(2):234–46. 95. Boyd D, Crawford K. Critical Questions for Big Data. Inf Commun Soc. 2012;15(5):662–79. 96. Chen, Chiang, Storey. Business Intelligence and Analytics: From Big Data to Big Impact. MIS Q. 2012;36(4):1165. 97. Wu M, Yan B, Huang Y, Sarker MNI. Big Data-Driven Urban Management: Potential for Urban Sustainability. Land. 2022;11(5):680. 98. Clarivate. Web of Science Platform [Internet]. Web of Science Group. 2022 [cited 2022 Aug 2]. Available from: https://clarivate.com/webofsciencegroup/solutions/webofscience-platform/ 99. Aria M, Cuccurullo C. bibliometrix : An R-tool for comprehensive science mapping analysis. J Informetr. 2017 Nov;11(4):959–75. 100. Lu K, Liu J, Zhou X, Han B. A Review of Big Data Applications in Urban Transit Systems. IEEE Trans Intell Transp Syst. 2021;22(5):2535–52. 101. Welch TF, Widita A. Big data in public transportation: a review of sources and methods. Transp Rev. 2019;39(6):795–818. 102. Carter E, Adam P, Tsakis D, Shaw S, Watson R, Ryan P. Enhancing pedestrian mobility in Smart Cities using Big Data. J Manag Anal. 2020;7(2):173–88. 103. Torre‐Bastida AI, Del Ser J, Laña I, Ilardia M, Bilbao MN, Campos‐Cordobés S. Big Data for transportation and mobility: recent advances, trends and challenges. IET Intell Transp Syst. 2018;12(8):742–55. 88 AFRICA URBAN MOBILITY OBSERVATORY – BIG DATA TECHNOLOGIES AND INDICATORS REPORT 104. Peng T, Yang X, Xu Z, Liang Y. Constructing an Environmental Friendly Low-Carbon-Emission Intelligent Transportation System Based on Big Data and Machine Learning Methods. Sustainability. 2020;12(19):8118. 105. Zacharias J. Addressing Global Climate Change With Big Data-Driven Urban Planning Policy: Int J E-Plan Res. 2021;10(4):1–16. 106. Lemonde C, Arsenio E, Henriques R. Integrative analysis of multimodal traffic data: addressing open challenges using big data analytics in the city of Lisbon. Eur Transp Res Rev. 2021;13(1):64. 107. Zannat KE, Choudhury CF. Emerging Big Data Sources for Public Transport Planning: A Systematic Review on Current State of Art and Future Research Directions. J Indian Inst Sci. 2019;99(4):601–19. 108. Pettit CJ, Zarpelon Leao S, Lock O, Ng M, Reades J. Big Data: The Engine to Future Cities—A Reflective Case Study in Urban Transport. Sustainability. 2022 Feb 2;14(3):1727. 109. Zheng L, Xia D, Chen L, Sun D. Understanding Citywide Resident Mobility Using Big Data of Electronic Registration Identification of Vehicles. IEEE Trans Intell Transp Syst. 2020;21(10):4363–77. 110. Shi F. Research on Accessibility and Equity of Urban Transport Based on Multisource Big Data. Kim C, editor. J Adv Transp. 2021;1–18. 111. Uçak E, Karagümüş E, Şener C. A scalable platform for big data analysis in public transport. Concurr Comput Pract Exp [Internet]. 2022 [cited 2022 Jun 13];34(9). Available from: https://onlinelibrary.wiley.com/doi/10.1002/cpe.6534 112. Schweizer J, Poliziani C, Rupi F, Morgano D, Magi M. Building a Large-Scale Micro-Simulation Transport Scenario Using Big Data. ISPRS Int J Geo-Inf. 2021;10(3):165. 113. Mohammed S, Arabnia HR, Qu X, Zhang D, Kim TH, Zhao J. IEEE Access Special Section Editorial: Big Data Technology and Applications in Intelligent Transportation. IEEE Access. 2020;8:201331–44. 114. Paffumi E, De Gennaro M, Martini G. European-wide study on big data for supporting road transport policy. Case Stud Transp Policy. 2018;6(4):785–802. 115. Wang Z, Li X, Zhu X, Li J, Wang F, Wang F. Big data-driven public transportation network: a simulation approach. Complex Intell Syst [Internet]. 2021 [cited 2022 Jun 13]; Available from: https://link.springer.com/10.1007/s40747-021-00462-2 116. Cosgove D. Traffic and congestion cost trends for Australian capital cities. Australia: Bureau of Infrastructure, Transport and Regional Economics; 2017. 117. Sai W, Wang H. Optimal design of urban transportation planning based on big data. Environ Technol Innov. 2021 Aug;23:101545. 118. Li M, Guo W, Guo R, He B, Li Z, Li X, et al. Urban Network Spatial Connection and Structure in China Based on Railway Passenger Flow Big Data. Land. 2022 Feb 2;11(2):225. 119. Zhao Y, Lin Q, Ke S, YuYunnan Y. Impact of land use on bicycle usage: A big data-based spatial approach to inform transport planning. J Transp Land Use [Internet]. 2020 [cited 2022 Jun 13];13(1). Available from: https://www.jtlu.org/index.php/jtlu/article/view/1499 120. Han J, Liu J. Urban Spatial Interaction Analysis Using Inter-City Transport Big Data: A Case Study of the Yangtze River Delta Urban Agglomeration of China. Sustainability. 2018 Nov 28;10(12):4459. 121. Fraile-Ardanuy J, Castano-Solis S, Álvaro-Hermana R, Merino J, Castillo Á. Using mobility information to perform a feasibility study and the evaluation of spatio-temporal energy demanded by an electric taxi fleet. Energy Convers Manag. 2018 Feb;157:59–70. 122. Koo BW, Guhathakurta S, Botchwey N. How are Neighborhood and Street-Level Walkability Factors Associated with Walking Behaviors? A Big Data Approach Using Street View Images. Environ Behav. 2022 Jan;54(1):211–41. 123. Aria M, Cuccurullo C, D'Aniello L, Misuraca M, Spano M. Thematic Analysis as a New Culturomic Tool: The Social Media Coverage on COVID-19 Pandemic in Italy. Sustainability. 2022 Mar 20;14(6):3643. 124. Cosgove D. Traffic and congestion cost trends for Australian capital cities. Australia: Bureau of Infrastructure, Transport and Regional Economics; 2017. 125. Manyika J, Chui M, Brown B, Bughin J, Dobbs R, Roxburgh C, et al. Big data: The next frontier for innovation, competition, and productivity. McKinsey Global Institute; 2011. 126. Sosa Escudero W. Infrastructure, Public Policy and the Challenge of Big Data [Internet]. Inter-American Development Bank; 2020 Jan [cited 2022 Aug 14]. Available from: https://publications.iadb.org/en/infrastructure-public-policy-and-challenge-big-data 127. Mauro AD, Greco M, Grimaldi M. What is Big Data? A Consensual Definition and a Review of Key Research Topics. 2014 [cited 2022 Aug 14]; Available from: http://rgdoi.net/10.13140/2.1.2341.5048 128. Mayer-Schönberger V, Cukier K. Big data: a revolution that will transform how we live, work, and think. First Mariner Books edition. Boston: Mariner Books, Houghton Mifflin Harcourt; 2014. 252 p. 129. Sivarajah U, Kamal MM, Irani Z, Weerakkody V. Critical analysis of Big Data challenges and analytical methods. J Bus Res. 2017;70(1):263–86. 89 AFRICA URBAN MOBILITY OBSERVATORY – BIG DATA TECHNOLOGIES AND INDICATORS REPORT 130. Carbone L, Franciosi S, Galasso S, Jez P, Mezzapesa V, Tramontozzi A, et al. D02.1 Requirements and good practices for a Big Data Test Infrastructure. :86. 131. Iliashenko O, Iliashenko V, Lukyanchenko E. Big Data in Transport Modelling and Planning. Transp Res Procedia. 2021;54:900–8. 132. Hadi HJ, Shnain AH, Hadishaheed S, Ahmad AH. Big Data and Five V's Characteristics. Int J Adv Electron Comput Sci. 2015;2(1):9. 133. Cosgove D, Australia, Bureau of Infrastructure T and RE. Traffic and congestion cost trends for Australian capital cities. 2015. 134. European Commission (EC). A European strategy for data [Internet]. 2020. Available from: https://eur-lex.europa.eu/legalcontent/EN/TXT/PDF/?uri=CELEX:52020DC0066&from=EN 135. Chourabi H, Nam T, Walker S, Gil-Garcia JR, Mellouli S, Nahon K, et al. Understanding Smart Cities: An Integrative Framework. In: 2012 45th Hawaii International Conference on System Sciences [Internet]. Maui, HI, USA: IEEE; 2012 [cited 2022 Aug 14]. p. 2289–97. Available from: http://ieeexplore.ieee.org/document/6149291/ 136. RAND Corporation. Big data governance and public policy Connecting diverse strands [Internet]. Available from: https://www.rand.org/randeurope/research/science-technology-innovation/big-data-and-public-policy.html 137. Höchtl J, Parycek P, Schöllhammer R. Big data in the policy cycle: Policy decision making in the digital era. J Organ Comput Electron Commer. 2016 Apr 2;26(1–2):147–69. 138. Xiong W, Yu Z, Bei Z, Zhao J, Zhang F, Zou Y, et al. A characterization of big data benchmarks. In: 2013 IEEE International Conference on Big Data [Internet]. Silicon Valley, CA, USA: IEEE; 2013 [cited 2022 Aug 16]. p. 118–25. Available from: http://ieeexplore.ieee.org/document/6691707/ 139. Dubow J. Big Data and Urban mobility. In Cairo, Egypt: The World Bank Group; 2014. p. 22. 140. Monino JL, Soraya S. Big Data, Open Data and Data Development. Vol. 3. 2016. 141. citypopulation.de. City Population. 142. Vehovar V, Toepoel V, Steinmetz S. Non-probability Sampling. In: The SAGE Handbook of Survey Methodology [Internet]. London: SAGE; 2016. p. 329–45. Available from: https://dare.uva.nl/search?identifier=dda2a1ed-7a55-42b6-b5de-8c10cef59c44 143. https://www.statisticshowto.com/. Sample Size in Statistics (How to Find it): Excel, Cochran's Formula, General Tips [Internet]. Available from: https://www.statisticshowto.com/probability-and-statistics/find-sample-size/ 144. International Telecommunication Union. Measuring the Information Society Report Volume 2. ICT Country Profiles [Internet]. Geneva: International Telecommunication Union; 2018. Available from: https://www.itu.int/en/ITUD/Statistics/Documents/publications/misr2018/MISR-2018-Vol-2-E.pdf 145. Azene FT. Location Based Services for Low-end mobile phones [Master's Thesis]. University of Twente; 2014. 146. CartONG. Covid-19 crisis: how to adapt your data collection for monitoring and accountability? | CartoBLOG [Internet]. [cited 2022 Aug 23]. Available from: https://blog.cartong.org/2020/04/10/covid-19-crisis-how-to-adapt-data-collection-for-monitoringand-accountability/ 147. Mansoor Iqbal. WhatsApp Revenue and Usage Statistics [Internet]. Business of Apps. 2020 [cited 2020 Oct 25]. Available from: https://www.businessofapps.com/data/whatsapp-statistics/ 148. Statista Research Department. Share of mobile operating systems in Africa 2018-2021, by month [Internet]. 2022. Available from: https://www.statista.com/statistics/1045247/share-of-mobile-operating-systems-in-africa-bymonth/#:~:text=Share%20of%20mobile%20operating%20systems%20in%20Africa%202018%2D2021%2C%20by%20month&text =Google's%20Android%20is%20the%20leader,with%20a%2012.19%20percent%20share 149. The World Bank. World Bank Country and Lending Groups [Internet]. n.d. Available from: https://datahelpdesk.worldbank.org/knowledgebase/articles/906519-world-bank-country-and-lending-groups 150. Wiederwald D, Mosshammer L, Wasner W, Topolnik M. Living Labs for Mobility – The Urban Mobility Labs Approach in Austria. 2018 Apr 16 [cited 2022 Aug 23]; Available from: https://zenodo.org/record/1486642 151. OpenStreetMap Foundation. OpenStreetMap [Internet]. n.d. Available from: https://www.openstreetmap.org/about 152. WorldPop. WorldPop Hub [Internet]. Available from: https://hub.worldpop.org/project/categories?id=3 153. QGIS [Internet]. 2022. Available from: https://www.qgis.org/en/site/ 154. UN-Habitat. Urban Indicators Database - Urban Transport [Internet]. Available from: https://data.unhabitat.org/pages/urbantransport 155. United Nations Statistics Division. SDG indicator metadata [Internet]. 2021. Available from: https://unstats.un.org/sdgs/metadata/files/Metadata-11-02-01.pdf 156. Shakerod Munuhwa, Ephraim Govere, Bonang Mojewa, Abbas Lusenge. Alleviating Urban Traffic Congestion: Case of Gaborone City. J Econ Sustain Dev. 2020 Apr;11(8):50–60. 90 AFRICA URBAN MOBILITY OBSERVATORY – BIG DATA TECHNOLOGIES AND INDICATORS REPORT 157. Vanderschuren M, Allen H, Krause P, Lane-Visser T. Lessons learnt through gender-based travel data collection and related sexual harassment in Sub-Saharan Africa. Manuscr Submitt Publ. 2022; 158. Nxele N. Public transit and crime. An exploratory study on commuter's perceptions of crime in Metrorail trains: a case study of Durban station. [Internet] [Thesis]. 2021 [cited 2022 Aug 15]. Available from: https://researchspace.ukzn.ac.za/handle/10413/19811 159. Iloabanafor TA, Ege EE. EVALUATION OF TRANSIT CRIMES IN PARTS OF LAGOS STATE, NIGERIA. Osun Geogr Rev [Internet]. 2022 Mar 15 [cited 2022 Aug 15];4(1). Available from: http://journals.uniosun.edu.ng/index.php/OGR/article/view/608 160. United Nations Statistics Division. E-Handbook on Sustainable Development Goals Indicators. [Internet]. Available from: https://unstats.un.org/wiki/display/SDGeHandbook 161. Sustainable Mobility for All (SUM4ALL). Indicators for the Online Tool Toward Sustainable Mobility 2.0 [Internet]. Available from: https://www.sum4all.org/data/files/GRA-Tool/data_sources_0.pdf 162. World Business Council on Sustainable Development (WBCSD). Methodology and Indicator Calculation Method for Sustainable Urban Mobility. [Internet]. Available from: https://www.eltis.org/sites/default/files/trainingmaterials/smp2.0_sustainablemobility-indicators_2ndedition.pdf 163. United Nations Centre for Regional Development (UNCRD). Bangkok Declaration for 2020 – Sustainable Transport Goals for 2010- 2020. [Internet]. 2010. Available from: https://sustainabledevelopment.un.org/content/documents/bangkok_declaration.pdf 164. ASEAN Secretariat. Guidelines on Sustainable Land Transport Indicators on Energy Efficiency and Greenhouse Gas (GHG) Emissions in ASEAN [Internet]. Available from: https://asean.org/?static_post=guidelines-sustainable-land-transport-indicatorsenergy-efficiency-greenhouse-gas-ghg-emissions-asean 165. United Nations Economic and Social Commission for Asia and the Pacific. Sustainable Urban Transport Index (SUTI) Data Collection Guideline [Internet]. 2019. Available from: https://www.unescap.org/sites/default/files/SUTI%20Data%20Collection%20Guideline%20_%202019%20update.pdf 166. Development Bank of Latin America (CAF). Latin America Urban Mobility Observatory. [Internet]. Available from: https://www.caf.com/app_omu/#graphic?i0=superf_area_metropol_km2_urba&i5=num_vehic_micro_bus&i2=viajes_hab_dia_c olectivo&i3=tiempo_hs_hab_dia 167. Rupprecht Consult. Technical Support Related to Sustainable Urban Mobility Indicators (SUMI) Harmonisation Guidelines [Internet]. 2020. Available from: https://ec.europa.eu/transport/themes/urban/urban_mobility/sumi_en 168. Institute for Transport Development Policy (ITDP). Indicators for Sustainable Mobility [Internet]. Available from: https://naindicators.itdp.org/ 169. Knupfer S, Pokotilo V, Woetzel J. Elements of Success: Urban Transportation Systems of 24 Global Cities. MicKinsey & Company. [Internet]. McKinsey & Company; 2018. Available from: https://www.mckinsey.com/~/media/McKinsey/Business%20Functions/Sustainability/Our%20Insights/Elements%20of%20succe ss%20Urban%20transportation%20systems%20of%2024%20global%20cities/Urban-transportation-systems_e-versions.ashx 170. Arcadis. Sustainable Cities Mobility Index 2017 Bold Moves North America Edition. [Internet]. 2017. Available from: https://www.arcadis.com/en/canada/our-perspectives/sustainable-cities-mobility-index-2017/ 171. International Association of Public Transport (UITP), Walk21 Foundation. Urban Mobility Indicators for Walking and Public Transport [Internet]. 2019. Available from: https://ec.europa.eu/futurium/en/system/files/ged/convenient-access-to-publictransport.pdf 172. European Commission (EC). Eurostat Transport – Cities and Greater Cities [Internet]. Available from: https://ec.europa.eu/eurostat/databrowser/view/URB_CTRAN__custom_122365/default/table?lang=en B AFRICA URBAN MOBILITY OBSERVATORY – BIG DATA TECHNOLOGIES AND INDICATORS REPORT APPENDIX A: SEARCH STRATEGY BILBIOMETRIC ANALYSIS DATE SEARCH STRING RESULTS (+URL) ID BLOCK 1 (B1) 12.07.2022 TS="Big Data" OR TS="Mass Data" 49,611 12.07.2022 TS="Big Data" 48.030 12.07.2022 (TS=("big data") OR TS=("mass data")) AND (TS=urban OR TS=cit* OR TS=town OR TS=municipality OR TS=midtown OR TS=downtown OR TS=megacit* OR TS=megalopolis OR TS=Metropolis) 5,246 12.07.2022 (TS=("big data") OR TS=("mass data")) AND (TS=urban OR TS=cit*) 5,146 BLOCK 2 (B2) 12.07.2022 (TS=transport* OR TS=Mobility OR TS=transit OR TS=travel OR TS=traffic OR TS=commut*) AND (TS=urban OR TS=cit*) 132,262 12.07.2022 (TS=bike* OR TS=metro OR TS=subway OR TS=rail* OR TS=pedestrian* OR TS="bus*" OR TS=walk* OR TS=vehicle) AND (TS=urban OR TS=cit*) 88,007 12.07.2022 ((TS=transport* OR TS=Mobility OR TS=transit OR TS=travel OR TS=traffic OR TS=commut*) OR (TS=bike* OR TS=metro OR TS=subway OR TS=rail* OR TS=pedestrian* OR TS="bus*" OR TS=walk* OR TS=vehicle)) AND (TS=urban OR TS=cit*) 181,086 B2 COMBINATIONS (C) 30.06.2022 TS=("big data") OR TS=("mass data") AND TS=("urban") OR TS=("cit*") AND TS=("transport*") OR TS=("mobility") OR TS=("commuting") OR TS=("travel") OR TS=("traffic") 1,554 12.07.2022 (((TS=transport* OR TS=Mobility OR TS=transit OR TS=travel OR TS=traffic OR TS=commut*) OR (TS=bike* OR TS=metro OR TS=subway OR TS=rail* OR TS=pedestrian* OR TS="bus*" OR TS=walk* OR TS=vehicle)) AND (TS=urban OR TS=cit*) AND (TS="Big Data" OR TS="Mass Data")) 2,067 C1 14.07.2022 (((TS=transport* OR TS=Mobility OR TS=transit OR TS=travel OR TS=traffic OR TS=commut*) OR (TS=bike* OR TS=metro OR TS=subway OR TS=rail* OR TS=pedestrian* OR TS="bus*" OR TS=walk* OR TS=vehicle)) AND (TS=urban OR TS=cit*) AND (TS="Big Data")) 2, 057 C2 FOCUS AREA 1: Applications (FA1) 12.07.2022 C1 AND (TS=application* OR TS="use*" OR TS="Operation*" OR TS="Example*" OR TS="Solution*") 1655 FA1C1 14.07.2022 C2 AND (TS=application* OR TS="use*" OR TS="Operation*" OR TS="Example*" OR TS="Solution*") 1648 FA1C2 FOCUS AREA 2: Applications in the African Region (FA2) C AFRICA URBAN MOBILITY OBSERVATORY – BIG DATA TECHNOLOGIES AND INDICATORS REPORT 12.07.2022 (TS=Africa* OR TS=Lagos OR TS=Maseru OR TS= Kinshasa OR TS=Kigali OR TS=Gaborone OR TS=Blantyre OR TS=Nigeria OR TS=Lesotho OR TS= DRC OR TS="Democratic Republic of the Congo" OR TS=Rwanda OR TS=Botswana OR TS=Malawi) AND (TS=("big data") OR TS=("mass data")) 364 FA2 14.07.2022 (TS=Africa* OR TS=Lagos OR TS=Maseru OR TS= Kinshasa OR TS=Kigali OR TS=Gaborone OR TS=Blantyre OR TS=Nigeria OR TS=Lesotho OR TS= DRC OR TS="Democratic Republic of the Congo" OR TS=Rwanda OR TS=Botswana OR TS=Malawi) AND TS="big data") 339 FA22 14.07.2022 ((TS=Africa* OR TS=Lagos OR TS=Maseru OR TS= Kinshasa OR TS=Kigali OR TS=Gaborone OR TS=Blantyre OR TS=Nigeria OR TS=Lesotho OR TS= DRC OR TS="Democratic Republic of the Congo" OR TS=Rwanda OR TS=Botswana OR TS=Malawi) AND TS=("big data")) NOT TS="African American*" 302 FA23 12.07.2022 (TS=Africa* OR TS=Lagos OR TS=Maseru OR TS= Kinshasa OR TS=Kigali OR TS=Gaborone OR TS=Blantyre OR TS=Nigeria OR TS=Lesotho OR TS= DRC OR TS="Democratic Republic of the Congo" OR TS=Rwanda OR TS=Botswana OR TS=Malawi) AND B2 5741 12.07.2022 (TS=Africa* OR TS=Lagos OR TS=Maseru OR TS= Kinshasa OR TS=Kigali OR TS=Gaborone OR TS=Blantyre OR TS=Nigeria OR TS=Lesotho OR TS= DRC OR TS="Democratic Republic of the Congo" OR TS=Rwanda OR TS=Botswana OR TS=Malawi) AND C1 10 FA2C1 12.07.2022 (TS=Africa* OR TS=Lagos OR TS=Maseru OR TS= Kinshasa OR TS=Kigali OR TS=Gaborone OR TS=Blantyre OR TS=Nigeria OR TS=Lesotho OR TS= DRC OR TS="Democratic Republic of the Congo" OR TS=Rwanda OR TS=Botswana OR TS=Malawi) AND FA1C1 9 FA1FA2C1 D AFRICA URBAN MOBILITY OBSERVATORY – BIG DATA TECHNOLOGIES AND INDICATORS REPORT APPENDIX B: EXPERTS SURVEY BTC Botswana No response received E AFRICA URBAN MOBILITY OBSERVATORY – BIG DATA TECHNOLOGIES AND INDICATORS REPORT F AFRICA URBAN MOBILITY OBSERVATORY – BIG DATA TECHNOLOGIES AND INDICATORS REPORT G AFRICA URBAN MOBILITY OBSERVATORY – BIG DATA TECHNOLOGIES AND INDICATORS REPORT H AFRICA URBAN MOBILITY OBSERVATORY – BIG DATA TECHNOLOGIES AND INDICATORS REPORT I AFRICA URBAN MOBILITY OBSERVATORY – BIG DATA TECHNOLOGIES AND INDICATORS REPORT J AFRICA URBAN MOBILITY OBSERVATORY – BIG DATA TECHNOLOGIES AND INDICATORS REPORT K AFRICA URBAN MOBILITY OBSERVATORY – BIG DATA TECHNOLOGIES AND INDICATORS REPORT L AFRICA URBAN MOBILITY OBSERVATORY – BIG DATA TECHNOLOGIES AND INDICATORS REPORT M AFRICA URBAN MOBILITY OBSERVATORY – BIG DATA TECHNOLOGIES AND INDICATORS REPORT N AFRICA URBAN MOBILITY OBSERVATORY – BIG DATA TECHNOLOGIES AND INDICATORS REPORT O AFRICA URBAN MOBILITY OBSERVATORY – BIG DATA TECHNOLOGIES AND INDICATORS REPORT P AFRICA URBAN MOBILITY OBSERVATORY – BIG DATA TECHNOLOGIES AND INDICATORS REPORT APPENDIX C: COMMENTS REGARDING THE CURRENT AUMO INDICATOR LIST – BLANTYRE AND KIGALI Indicator Blantyre Kigali Mobility Distance Travelled • The analysis zones that were used are the administrative and political wards for councillors are too big to get more accurate analysis for distance travelled. There is a project being implemented to create smaller analysis zones that should give more accurate outcomes. • Can be considered to include the various conditions within certain areas (e.g., hilly topography, time, weather, special events). Travel Time • Usually, time is overestimated instead ask departure time and arrival time; • The averages of travel time being used to describe travel time are too aggregated to give a realistic estimation for mobility indicator for an individual. There is a need for more disaggregate method. Mode Share • Reflect multi-modal integration; can be used for calculating other indicators (e.g., savings resulting from projects). Period of Travel • Find another term because it sounds same as Travel Time; • The wording "period of travel" can be confusing for an average Blantyre citizen, better wording is needed e.g., Time of the day when travel occurred. The word "period" might be confused with duration of travel. • Consider incorporating data related to weather conditions, seasons, etc. Accessibility • Not certain whether the "500 meter" (from public transport stations) is applicable in the local context; • Need to incorporate accessibility to basic services (e.g., commercial establishments, health, schools). Experience • General: pricing data (e.g., from RURA), and inspection data from the police can be useful sources of other forms of data Public transport scheduling and planning data should be integrated. Condition of public transport vehicles • Needs to be better clarified. Crime on public transport • Data can be categorised based on type, level; further definitions are required. Public transport behaviour • Can include multiple indicators. Public transport reliability • Define reliability in the context of Blantyre city. The perception of Q AFRICA URBAN MOBILITY OBSERVATORY – BIG DATA TECHNOLOGIES AND INDICATORS REPORT Indicator Blantyre Kigali transport reliability for an average Blantyre City resident is too diverse. Sexual Harassment • There is need to have a definition for sexual harassment in the context of Blantyre city. • Needs to have clearer definitions (should consider physical and mental harassment). Affordability Traffic Fatalities • Data from respondents is very unreliable. Accurate data on incidents or accidents on the roads should have been collected from the Traffic Police department. • Disaggregated data for public transportrelated fatalities can be included. CO2 Emissions • More accurate data and information on this indicator should have been collected from The Malawi University of Business and Applied Sciences at the Mechanical Engineering Department whose climate experts have done extensive studies on this indicator. Congestion • The data collection survey for calculating the ratios need to be clearer. Mode Share • Cover all modes not only the mode covering most distance. Excluding the modes utilised for less distance on a multimodal trip compound to inaccuracies. Efficiency • Should include "cost" efficiencies; • CO2 emissions data can be used for raising awareness at the individual level. Vehicle Occupancy • Need for clarity on how vehicle occupancy relates to efficiency; • Need to be clearer as to what vehicle occupancy really mean. It might be confused with vehicle capacity. R AFRICA URBAN MOBILITY OBSERVATORY – BIG DATA TECHNOLOGIES AND INDICATORS REPORT APPENDIX D: FIELD SURVEYS – SAMPLE STRATA (TARGETS) Blantyre sample strata (minimum target) TAZ Cluster Wards Male 18- 34 Male 35- 64 Male 65+ Female 18 - 34 Female 35 - 64 Female 65+ Total (90/10) 1 Michiru Ward 21 12 1 21 12 1 68 2 South Lunzu Ward, Mapanga Ward, Nkolokoti Ward 16 9 1 25 15 1 68 3 Ndirande Matope Ward, Ndirande Makata Ward, Ndirande Gamulani Ward, Nyambadwe Ward 17 10 1 25 14 1 68 4 Mbayani Ward, Chilomoni Ward, Blantyre City Centre Ward, Namalimwe Ward, Limbe Central Ward 20 12 1 21 12 1 68 5 Mzedi Ward, Bangwe Ward, Bangwe Mthandizi Ward, Soche East Ward, Blantyre South Ward 21 12 1 21 12 1 68 6 Green Corner Ward, Soche West Ward, Namiyango Ward 21 12 1 21 12 1 68 7 Chigumula Ward, Misesa Ward 21 12 1 21 12 1 68 Grand Total: 473 Blantyre sample strata (upper target) TAZ Cluster Wards Male 18- 34 Male 35- 64 Male 65+ Female 18 - 34 Female 35 - 64 Female 65+ Total (95/5) 1 Michiru Ward 117 67 5 118 68 5 381 2 South Lunzu Ward, Mapanga Ward, Nkolokoti Ward 90 54 5 142 85 8 382 3 Ndirande Matope Ward, Ndirande Makata Ward, Ndirande Gamulani Ward, Nyambadwe Ward 96 54 4 141 80 7 382 4 Mbayani Ward, Chilomoni Ward, Blantyre City Centre Ward, Namalimwe Ward, Limbe Central Ward 116 69 6 117 70 6 382 5 Mzedi Ward, Bangwe Ward, Bangwe Mthandizi Ward, Soche East Ward, Blantyre South Ward 117 67 6 118 68 6 382 6 Green Corner Ward, Soche West Ward, Namiyango Ward 118 68 6 117 67 6 382 7 Chigumula Ward, Misesa Ward 118 67 6 117 66 6 381 Grand Total: 2,672 Gaborone sample strata (minimum target) TAZ Cluster Wards Male 18-34 Male 35-64 Male 65+ Female 18 - 34 Female 35 - 64 Female 65+ Total (90/10) 1 Wards 1 - 7 18 12 2 18 14 3 68 2 Wards 8 - 14 18 12 2 18 14 3 68 3 Wards 15 - 21 18 12 2 18 14 3 68 4 Wards 22 - 28 18 12 2 18 14 3 68 5 Wards 29 - 35 18 12 2 18 14 3 68 Grand Total: 338 S AFRICA URBAN MOBILITY OBSERVATORY – BIG DATA TECHNOLOGIES AND INDICATORS REPORT Gaborone sample strata (upper target) TAZ Cluster Wards Male 18-34 Male 35-64 Male 65+ Female 18 - 34 Female 35 - 64 Female 65+ Total (95/5) 1 Wards 1 - 7 101 70 13 105 77 18 384 2 Wards 8 - 14 101 70 13 105 77 18 384 3 Wards 15 - 21 101 70 13 105 77 18 384 4 Wards 22 - 28 101 70 13 105 77 18 384 5 Wards 29 - 35 101 70 13 105 77 18 384 Grand Total: 1,918 Kigali sample strata (minimum target) TAZ Cluster Ward Male 18- 34 Male 35- 64 Male 65+ Female 18 - 34 Female 35 - 64 Female 65+ Total (90/10) 1 Bumbogo, Gatsata, Gikomero, Gisozi, Jabana 22 11 1 21 11 1 22 2 Jali, Kacyiru, Kimihurura, Kimiromko 23 12 1 20 10 1 23 3 Kinyinya, Ndera, Nduba, Remera 22 11 1 21 11 1 22 4 Rusororo, Rutunga, Gahanga, Gatenga, Gikondo, Kagarama 22 11 1 22 11 1 22 5 Kanombe, Kicukiro, Kigarama, Masaka, Niboye 23 11 1 22 10 1 23 6 Nyarugunga, Gitega, Kanyinya, Kigali, Kimisagara 23 11 1 21 10 1 23 7 Mageragere, Muhima, Nyakabanda, Nyamirambo, Nyarugenge, Rwezamenyo 23 11 1 21 10 1 23 Total: 473 Kigali sample strata (upper target) TAZ Cluster Ward Male 18- 34 Male 35- 64 Male 65+ Female 18 - 34 Female 35 - 64 Female 65+ Total (95/5) 1 Bumbogo, Gatsata, Gikomero, Gisozi, Jabana 125 64 7 119 61 6 125 2 Jali, Kacyiru, Kimihurura, Kimiromko 131 67 7 113 58 6 131 3 Kinyinya, Ndera, Nduba, Remera 127 65 7 118 60 6 127 4 Rusororo, Rutunga, Gahanga, Gatenga, Gikondo, Kagarama 127 62 6 123 60 6 127 5 Kanombe, Kicukiro, Kigarama, Masaka, Niboye 128 61 5 124 59 5 128 6 Nyarugunga, Gitega, Kanyinya, Kigali, Kimisagara 129 63 6 120 59 5 129 7 Mageragere, Muhima, Nyakabanda, Nyamirambo, Nyarugenge, Rwezamenyo 131 64 6 118 58 5 131 Total: 2,678 T AFRICA URBAN MOBILITY OBSERVATORY – BIG DATA TECHNOLOGIES AND INDICATORS REPORT Kinshasa sample strata (minimum target) TAZ Cluster Ward Male 18- 34 Male 35- 64 Male 65+ Female 18 - 34 Female 35 - 64 Female 65+ Total (90/10) 1 Bandalungwa, Bumbu 18 15 1 19 14 1 68 2 Kalamu, Kasa Vubu 18 15 1 19 14 1 68 3 Makala, Ngiri-Ngiri, Selembao 18 15 1 19 14 1 68 4 Barumbu, Gombe, Kinshasa, Kintambo 18 15 1 19 14 1 68 5 Lingwala, Mont Ngafula 18 15 1 19 14 1 68 6 Ngaliema 18 15 1 19 14 1 68 7 Kisenso 18 15 1 19 14 1 68 8 Lemba, Limete 18 15 1 19 14 1 68 9 Matete, Ngaba 18 15 1 19 14 1 68 10 Kimbanseke, 18 15 1 19 14 1 68 11 Maluku, Masina 18 15 1 19 14 1 68 12 Ndjili, Nsele 18 15 1 19 14 1 68 Total: 812 Kinshasa sample strata (upper target) TAZ Cluster Ward Male 18- 34 Male 35- 64 Male 65+ Female 18 - 34 Female 35 - 64 Female 65+ Total (95/5) 1 Bandalungwa, Bumbu 102 86 6 106 78 5 384 2 Kalamu, Kasa Vubu 102 86 6 106 78 5 384 3 Makala, Ngiri-Ngiri, Selembao 102 86 6 106 78 5 384 4 Barumbu, Gombe, Kinshasa, Kintambo 102 86 6 106 78 5 384 5 Lingwala, Mont Ngafula 102 86 6 106 78 5 384 6 Ngaliema 102 86 6 106 78 5 384 7 Kisenso 102 86 6 106 78 5 384 8 Lemba, Limete 102 86 6 106 78 5 384 9 Matete, Ngaba 102 86 6 106 78 5 384 10 Kimbanseke, 102 86 6 106 78 5 384 11 Maluku, Masina 102 86 6 106 78 5 384 12 Ndjili, Nsele 102 86 6 106 78 5 384 Total: 4,606 U AFRICA URBAN MOBILITY OBSERVATORY – BIG DATA TECHNOLOGIES AND INDICATORS REPORT Lagos sample strata (minimum target) TAZ Cluster Ward Male 18-34 Male 35-64 Male 65+ Female 18 - 34 Female 35 - 64 Female 65+ Total (90/10) 1 Agege 20 13 2 19 12 1 68 2 Ajeromi-Ifelodun 20 13 1 19 12 1 68 3 Alimosho 20 13 1 19 13 1 68 4 Amuwo-Odofin 21 13 1 19 12 1 68 5 Apapa 22 14 1 18 12 1 68 6 Badagry 20 13 2 19 13 2 68 7 Epe 18 13 3 18 13 3 68 8 Eti-Osa 23 13 1 18 11 1 68 9 Ibeju/Lekki 19 13 2 18 13 2 68 10 Ifako-Ijaye 20 13 1 19 13 1 68 11 Ikeja 22 13 1 19 11 1 68 12 Ikorodu 20 13 1 19 13 1 68 13 Kosofe 21 13 1 19 12 1 68 14 Lagos Island 20 12 2 19 12 2 68 15 Lagos Mainland 21 13 2 19 12 2 68 16 Mushin 20 13 2 19 12 2 68 17 Ojo 22 13 1 20 12 1 68 18 Oshodi-Isolo 21 13 1 19 12 1 68 19 Shomolu 20 13 2 19 12 2 68 20 Surulere 20 13 2 19 12 2 68 Total: 1,353 Lagos sample strata (upper target) TAZ Cluster Ward Male 18-34 Male 35-64 Male 65+ Female 18 - 34 Female 35 - 64 Female 65+ Total (95/5) 1 Agege 116 74 9 109 69 8 384 2 Ajeromi-Ifelodun 115 73 8 110 70 8 384 3 Alimosho 112 75 7 110 74 7 384 4 Amuwo-Odofin 121 74 8 108 66 7 383 5 Apapa 122 81 8 99 66 7 383 6 Badagry 111 73 9 109 72 9 383 7 Epe 103 75 15 101 74 15 383 8 Eti-Osa 132 76 6 104 60 5 383 9 Ibeju/Lekki 109 76 12 102 71 12 382 10 Ifako-Ijaye 114 76 7 109 72 7 384 11 Ikeja 124 76 7 106 65 6 383 12 Ikorodu 113 74 8 109 72 8 384 13 Kosofe 120 75 7 108 68 6 384 14 Lagos Island 116 70 12 108 66 11 383 15 Lagos Mainland 117 73 10 107 67 10 383 16 Mushin 113 75 11 106 70 10 384 17 Ojo 122 71 5 114 66 5 384 18 Oshodi-Isolo 118 73 7 110 68 7 384 19 Shomolu 115 73 10 108 69 9 384 20 Surulere 116 73 10 108 68 9 384 Total: 7,669 V AFRICA URBAN MOBILITY OBSERVATORY – BIG DATA TECHNOLOGIES AND INDICATORS REPORT Maseru sample strata (minimum target) TAZ Cluster Ward Male 18- 34 Male 35- 64 Male 65+ Female 18 - 34 Female 35 - 64 Female 65+ Total (90/10) 1 Abia, Koro, Lithabaneng 18 13 2 17 13 4 68 2 Lithoteng, Maama, Mabote 18 13 2 17 13 4 68 3 Machache, Makhaleng, Maletsunyane 18 13 2 17 13 4 68 4 Maseru Central, Matsieng, Motimposo 18 13 2 17 13 4 68 5 Qeme, Qoaling, Rothe 18 13 2 17 13 4 68 6 Stadium Area, Thaba Bosiu, Thaba Putsoa 18 13 2 17 13 4 68 Total: 406 Maseru sample strata (upper target) TAZ Cluster Ward Male 18- 34 Male 35- 64 Male 65+ Female 18 - 34 Female 35 - 64 Female 65+ Total (95/5) 1 Abia, Koro, Lithabaneng 103 74 14 94 74 23 382 2 Lithoteng, Maama, Mabote 103 74 14 94 74 23 382 3 Machache, Makhaleng, Maletsunyane 103 74 14 94 74 23 382 4 Maseru Central, Matsieng, Motimposo 103 74 14 94 74 23 382 5 Qeme, Qoaling, Rothe 103 74 14 94 74 23 382 6 Stadium Area, Thaba Bosiu, Thaba Putsoa 103 74 14 94 74 23 382 Total: 2,293 W AFRICA URBAN MOBILITY OBSERVATORY – BIG DATA TECHNOLOGIES AND INDICATORS REPORT APPENDIX E: USSD CAMPAIGN STAKEHOLDERS BY CITY To conduct USSD surveys in each of the AUMO cities, support from various stakeholders was required. These are listed in the table below. Multiple attempts were made to engage with stakeholders from whom no response was received. City Organisation Comments Blantyre Airtel Malawi No response received Telekom Networks Malawi Supported campaign Kigali MTN Rwanda Willing to support campaign, provided RURA approved campaign Airtel Rwanda No response received Kigali City Willing to support campaign National Cyber Security Authority (NCSA) Willing to issue Data Controller Certificate (provided RURA sign MoU and present a Research Visa from NISR) National Institute of Statistics of Rwanda (NISR) Unable to obtain Research Visa Rwanda Utilities Regulatory Authority (RURA) Willing to support campaign, however, require Data Controller Certificate from NCSA and TIN number from RDB Rwanda Development Board Unable to issue TIN to consortium since none of the consortium members are registered entities in Rwanda Kinshasa Vodacom DRC No response received Orange DRC No response received Airtel DRC No response received Africell DRC No response received Lagos LAMATA Supported campaign MTN Nigeria Supported campaign Maseru Vodacom Lesotho No response received Ministry of Public Works and Transport of Lesotho No response received Gaborone Mascom Botswana No response received Orange Botswana No response received X AFRICA URBAN MOBILITY OBSERVATORY – ROLE OF INFORMAL PARATRANSIT REPORT ANNEX A. AUMO POLICY AND PLANNING INSIGHTS REPORT: RESPONSES TO THE SUSTAINABLE URBAN MOBILITY CHALLENGE (POLICY TRENDS) Country, City Responses and recommendations Responses Malawi, Blantyre National and local authorities have provided a series of urban mobility responses by means of policy documents (e.g., National Transport Master Plan, National Transport Policy, Nationally Appropriate Mitigation Actions, National Climate Change Response Framework, National Adaptation Plans), improved institutional coordination via the National Transport Committee, a carbon tax and plans to use biodiesel, as well as consideration of investments in public transport service infrastructure (bus terminal, passenger rail services). The AUMO project's "Policy and Planning Insights" report identified the remaining needs to further develop a city-level action plan in line with national policies, improve NMT infrastructure, improve data collection processes and develop a traffic management system. Policies Coordination Climate mitigation Public transport investments Botswana, Gaborone Several policies suggest a direction toward sustainability (e.g., Integrated Transport Policy, National Climate Change Strategy). Botswana has also created of a National Road Safety Committee and reviewed the Road Traffic Act to address over-speeding and drunken driving, and the Gaborone City Development Plan commits to improving non-motorised transport and public transport accessibility. Further recommendations identified in the AUMO project include a more substantial inclusion in decision-making of people, walking and cycling with a focus on vulnerable groups, improved availability of statistics, continued prioritisation of road safety and the development of a Sustainable Urban Mobility Plan (SUMP). Policies Road safety NMT Public transport accessibility Rwanda, Kigali Kigali has been recognised for its particularly strong commitment toward sustainable urban mobility, enshrined in a set of comprehensive national and local policy documents (e.g., National Transport Policy and Strategy for Rwanda, updated Nationally Determined Contribution (NDC), Kigali Transport Master Plan 2050). Progress includes a public transport reform, prioritisation of walking and cycling by means of cycle lanes, car free zones, road safety campaigns, measures that support electric mobility, and conditionality of national funding to local projects upon alignment with priorities to public transport and NMT. The AUMO report recommends pursuing efforts for Complete Streets accessible to all users and support towards innovative mobility solutions and entrepreneurs, while developing a data bank and data management strategy. Policies Public transport reforms NMT infrastructure and awareness Road safety Electric mobility Conditional funding The DRC, Kinshasa Authorities are confronted with considerable challenges including the absence of a national census update, outdated laws, and regulations and, in general, urbanisation driven by push rather than pull factors. Efforts to promote sustainable urban mobility include a National Integrated Transport Master Plan being currently drafted, various climate change related policies and a National Program for Road Safety. The AUMO report recommended the development of a comprehensive urban planning framework and transport strategy. Policies Road safety Nigeria, Lagos Progress towards sustainable mobility pathways is being achieved through a Lagos policy supporting walking and cycling and an NMT Committee, a dedicated road safety agency, a dedicated busway corridor known as the BRT Lite, a Clean Energy Transport Scheme supporting the use of Compressed Natural Gas (CNG) for public transport buses, reform of subsidies previously granted to fossil fuel, various climate change policy documents, and a National Action Plan to reduce short-lived climate pollutants including several transport-related measures. NMT policy and Committee Road safety Public transport Clean energy Policies Y AFRICA URBAN MOBILITY OBSERVATORY – ROLE OF INFORMAL PARATRANSIT REPORT Country, City Responses and recommendations Responses This could be improved and completed by a recommended clarification of institutional roles and mandates, better engagement with the civil society, the creation of an urban mobility data collection and analysis observatory and increased NMT infrastructure. Lesotho, Maseru Authorities face important challenges of unclear and outdated policies, as well as a lack of implementation and the absence of a city agency with responsibility for public transport. Yet, they are pursuing efforts via policies such as the draft second National Strategic Development Plan, including transport-related objectives and actions. Recommendations to further promote sustainable mobility include an integrated land use planning, housing, and mobility strategy, improve institutional coordination, more focus on clean transport to reap the benefits of the existing clean energy sources and finally the creation of an urban mobility data collection and analysis observatory. Policies Z AFRICA URBAN MOBILITY OBSERVATORY – ROLE OF INFORMAL PARATRANSIT REPORT ANNEX B. CASE STUDIES : APPLICATIONS, FUNCTIONS, AND REQUIREMENTS Category Description Lisbon, Portugal (multimodal Big Data analytics) Applications Different types of analysing Big Data consisting of contextual sources and passenger transport modes. Methods are divided into descriptive, predictive, and prescriptive analyses. 1. Descriptive: Identify traffic patterns; Create multimodal origin-destination matrices (trip records and full movement tracking of individual users); Detect bottlenecks; and Model traffic expectations (spatiotemporal pattern and relational data mining, urban data fusion analytics). 2. Predictive: Forecast traffic using deep learning, recurrent neural networks, or graphneutral networks. 3. Prescriptive: Simulation, control, and optimisation. Solving the control problem includes multi-agent reinforcement learning, hierarchical network agent structures, or deep neural networks. Function Multimodal Big Data analysis aims to support more inclusive mobility planning. Identify crosscarrier passenger flow to support multimodal planning of routes and schedules and uncover untapped synergies. Requirements 1. Availability of an integrative fare collection system and entry requirements to public transport 2. Collect data from various sources in a standardised format 3. Acquire and integrate data for analysis from non-traditional sources for example, weather portals or social media 4. Ensure necessary technical capacity is available to conduct multimodal traffic analysis 5. Traffic data analysis should be an automated process 6. Evaluate and assess the robustness on data analysis, decision, and post-decision level 7. Ensure that results are interpretable, are based on robust statistical foundations and consider different alternatives to enable a transparent and objective multimodal planning process among multiple operators Melbourne, Australia (pedestrian movement analytics) Applications Integration of open access data sources from the CoM's pedestrian counting system and generation of descriptive statistics along with qualitative interpretations. This analysis can also be performed with other sensor data sources (e.g., cars and bikes). Function Pedestrian movement analytics can inform city authorities, as well as urban and transportation planners, about the needs and behaviours of citizens moving through the city. Requirements - Open Access datasets provided by city authorities - Deployment of sensors for traffic counting in the city - Knowledge and skills regarding software tools, as well as data processing and analysis - Adequate storage capacity and computing power - Overcoming sensor system limitations to allow more advanced analysis Shenzhen, China (land-use-transport interaction spatial modelling and analytics) Applications - Performance of statistical modelling to examine how different land use environments may influence mode choices. A spatial panel regression model was used to evaluate the relationships between land use (type, mix, connections) and bicycle use (frequency, duration, distance). Function - Analysis results allow insights into how to design bicycle-friendly cities. In this way, data supports urban transport planning, offers policy implications for the development of transport infrastructure, and facilitates urban decision-making. For example, implications and recommendations for action can be derived regarding needed infrastructure (i.e., bicycle lanes and parking facilities) to promote mode use (i.e., bicycle). Requirements - Trip data of the mode under study, in this case: trip frequency, trip distance, and trip duration, from a free-floating bike-share operator - Access to various types of land use data - Theoretical framework for establishing links between land use and bicycle use - Technical equipment and skills to conduct analyses and handle data. AA AFRICA URBAN MOBILITY OBSERVATORY – ROLE OF INFORMAL PARATRANSIT REPORT Category Description Atlanta, USA (semantic segmentation of street view images to assess walkability) Applications Using computer vision, street-level factors are quantified from Google Street View imagery. This involves processing the images using a semantic segmentation model to search for objects with potential street-level factors – such as buildings, houses, sidewalks, trees, roads, grass, cars, and plants. After processing the images, the analysis entails the calculation of various factors such as the building-to-road ratio, greenery, or sidewalk-to-road ratio. The street-level data is then combined with neighbourhood-level factors that are typically used to determine walkability. - Function The analysis can provide insight into how neighbourhood and street-level factors influence walking behaviour. More broadly, it can provide strategic guidance on how development and transportation plans can be used to create a more pedestrian friendly streetscape. Requirements Data: • National Household Travel Survey (trip origin, mode of transportation, purpose, trip distance, basic socioeconomic and demographic information, and other behavioural characteristics for each trip); • Google Street View images i.e., of trip origin location. Knowledge and technical skills to acquire, process, and analyse data (i.e., ArcGIS, semantic segmentation modelling) BB AFRICA URBAN MOBILITY OBSERVATORY – ROLE OF INFORMAL PARATRANSIT REPORT ANNEX C. SUMMARY OF SUSTAINABLE MOBILITY INDICATORS FROM VARIOUS INITIATIVES Short Title Description Sustainable Development Goals Final List of Indicators (160) Only 2 out of the 69 targets are directly transport related and 15 out of the 69 targets are indirectly related to transport. There are 241 Sustainable Development Goals (SDG) indicators for the 17 SDG goals. Initial scoping shows that at least 20 of these are highly relevant to urban mobility planning and management. Sustainable Mobility for All (SUM4All) (161) The SUM4All initiative (n.d.) utilises 45 indicators covering universal access (17 indicators), efficiency (11 indicators), safety (8 indicators), green mobility (9 indicators) in support of the integration of mobility in the achievement of the SDGs. Sustainable Mobility Project (SMP) (WBCSD) (162) The SMP Project 2 of the World Business Council for Sustainable Development produced a set of indicators that aim at measuring the potential for sustainable mobility in cities (year 2020). It has 19 indicators that cover the: performance of the mobility system (4 indicators); global environment (5 indicators); economic success (3 indicators); quality of life (7 indicators). Bangkok 2020 Declaration Sustainable Transport Goals (163) The Bangkok Declaration 2020 was adopted by 22 countries during the 5th Regional Environmentally Sustainable Transport Forum in Asia (originally crafted in 2010). The declaration covers 102 indicators for capturing progress made in 20 different measures towards sustainable mobility. ASEAN Sustainable Land Transport Indicators on Energy Efficiency and GHG Emissions (164) The Association of Southeast Asian Nations (ASEAN) Secretariat published (2021) a set of guidelines on indicators that focus on energy efficiency and GHG performance of the land transport sector for its member states (33 indicators in total). These guidelines do not focus specifically on urban transport but can be applicable. Sustainable Urban Transport Index (UNESCAP) (165) A Sustainable Urban Transport Index, developed by the United Nations Economic and Social Commission for Asia and the Pacific (UNESCAP) in 2019, has been applied to 10 cities in Asia. The index is composed of 10 indicators that cover public transport (access to, coverage, quality, reliability, costs), safety, affordability, and environment. Latin America Observatory of Urban Mobility (CAF)(166) Spearheaded by the CAF-Development Bank of Latin America, the Observatory of Urban Mobility (OUM) now covers 25 cities (including the 10 largest urban areas in Latin America in 11 countries. The database covers include 293 indicators covering 12 thematic areas (collective transport, cost and fees, energy, environment, legacy, individual transport, infrastructure, mobility, road safety, socio-economic, time and distances, traffic management. Sustainable Urban Mobility Indicators (SUMI) (European Commission) (167) The SUMI project was supported by the European Commission DG MOVE initiative which adapted the 2nd phase of the Sustainable Mobility Project's (SMP2) sustainable mobility indicators into the European Context. SUMI's indicator set is composed of 13 core indicators and 5 non-core indicators (released in 2020). Indicators for Sustainable Mobility (ITDP) (168) The Institute of Transportation and Development Policy (ITDP) proposes 11 indicators that cover access to transit (6 indicators), accessibility (3 indicators) and city characteristics (2 indicators). These indicators have been applied in an analysis of 25 cities in North America. Urban Transport System Success Indicators (McKinsey) (169) Mckinsey utilises a methodology that combines the use of statistical indicators (95 indicators) from official reports and databases, indicators that are based on geospatial data and satisfaction indicators based on a uniform survey to benchmark the performance of cities globally (release in 2018). Sustainable Cities Mobility Index (Arcadis) (170) Arcadis has developed a Sustainable Cities Mobility Index, released in 2017, that are aimed to be used in tracking the overall performance of mobility systems in 100 cities globally. There are 23 individual indicators under 3 main sub-themes: people (10 indicators), planet (7 indicators), profit (6 indicators). Urban Mobility Indicators for Walking and Public Transport (UITP and Walk21) (171) A common set of indicators focusing on walkability and access to public transport were consolidated by Union Internationale des Transports Publics (UITP) and Walk21 to support the Urban Agenda for the EU (released in 2019). It covers 52 indicators on comfort and safety (34), service demand (8 indicators), connecting destinations (4 indicators) and support and encouragement (5 indicators) Eurostat Cities and Greater Cities (172) A set of indicators focusing on transport in cities for which the Eurostat collects data for (for 1,069 cities in the Europe). The set includes 17 indicators. CC AFRICA URBAN MOBILITY OBSERVATORY – ROLE OF INFORMAL PARATRANSIT REPORT ANNEX D. REVIEWED SUSTAINABLE MOBILITY INDICATORS Source Category Indicator-Parameter Insights Relating to the AMO Survey Insights Relating to the UMA Other Comments 1 ITDP NA Accessibility Access to Jobs by Sustainable Transit (60 & 30 Minutes) Main indicator can be derived from geospatial analysis using other data sources (location + PT) 2 SMP Accessibility Access to mobility services Main indicator can be derived from geospatial analysis using other data sources (location + PT) 3 SUMI Accessibility Access to mobility services indicator 4 ITDP NA Accessibility Access to People by Sustainable Transit (60 Minutes) Main indicator can be derived from geospatial analysis using other data sources (location + PT) 5 SMP Accessibility Accessibility for mobilityimpaired groups consider grouping mobility impaired and senior citizens 6 SUMI Accessibility Accessibility of public transport for mobilityimpaired groups indicator consider grouping mobility impaired and senior citizens 7 EU PT and AT Accessibility Number of jobs and urban services accessible within 60 minutes by public transport (%) Main indicator can be derived from geospatial analysis using other data sources (location + PT) 8 McKinsey Accessibility Percentage of jobs within one kilometre of a metro station/ suburban rail station Main indicator can be derived from geospatial analysis using other data sources (location + PT) 9 SDG Accessibility Proportion of population living in households with access to basic services include question on Main indicator can be derived from geospatial analysis using other data sources (census + PT) 10 SUM4All Accessibility Rapid Transit to Resident Ratio (km per millions) 11 SUTI Affordability index Affordability – travel costs as part of income 12 SMP Affordability index Affordability of public transport for the poorest group question/s that can be used to validate calculated figures from city/national socio-economic data) can be included If the SMP methodology is to be adopted, mode share data and data on fares are needed 13 SUMI Affordability index Affordability of public transport for the poorest group indicator consider including income category in the survey 14 UNCRD EST Affordability index Relative affordability levels of public transport services for low-income groups Similar to the other indicator 15 CAF Affordability index Annual expenditure Total Collective T. (millions of US $) extrapolated figures from the survey can be used for validation 16 CAF Affordability index Annual Total Transportation Expense (million US $) extrapolated figures from the survey can be used for validation 17 EU PT and AT Affordability index Average income spent on transport (%) 18 CAF Affordability index Collective T. user expenditure (US $ / person / year) can include questions on total expenditures on transport DD AFRICA URBAN MOBILITY OBSERVATORY – ROLE OF INFORMAL PARATRANSIT REPORT Source Category Indicator-Parameter Insights Relating to the AMO Survey Insights Relating to the UMA Other Comments 19 McKinsey Affordability index Cost of a one-kilometre taxi ride, as percentage of average income 20 McKinsey Affordability index Cost of two hours of paid parking, as percentage of average income 21 CAF Affordability index Cost per bus trip (US $ / trip) can include questions on costs of trip by mode 22 CAF Affordability index Cost per car trip (US $ / trip) can include questions on costs of trip by mode 23 CAF Affordability index Cost per motorcycle trip (US $ / trip) can include questions on costs of trip by mode 24 CAF Affordability index Total annual expenditure Individual T. (millions of US $) extrapolated figures from the survey can be used for validation 25 CAF Affordability index Total transport user expenditure (US $ / person / year) can include questions on total expenditures on transport 26 Arcardis SCMI Affordability index Transport spending as a percentage of income 27 CAF Affordability index User expenditure Individual T. (US $ / person / year) can include questions on total expenditures on transport 28 CAF Affordability index Weight of 50 bus fares over the minimum wage (%) Can be calculated through other means 29 CAF Average age of vehicle fleet Average age of buses (years) Other options available for calculating (e.g., based on fleet data) 30 CAF Average age of vehicle fleet Average age of cars (years) Other options available for calculating (e.g., based on fleet data) 31 CAF Average age of vehicle fleet Average age of combis / vans (years) Other options available for calculating (e.g., based on fleet data) 32 CAF Average age of vehicle fleet Average age of jeeps (years) Other options available for calculating (e.g., based on fleet data) 33 CAF Average age of vehicle fleet Average age of motorcycles (years) Other options available for calculating (e.g., based on fleet data) 34 CAF Average age of vehicle fleet Average age of taxis (years) Other options available for calculating (e.g., based on fleet data) 35 EU PT and AT Average age of vehicle fleet Average age of vehicles Other options available for calculating (e.g., based on fleet data) 36 McKinsey Average age of vehicle fleet Average age of vehicles on the road Other options available for calculating (e.g., based on fleet data) 37 CAF Average age of vehicle fleet Average micro-bus age (years) Other options available for calculating (e.g., based on fleet data) EE AFRICA URBAN MOBILITY OBSERVATORY – ROLE OF INFORMAL PARATRANSIT REPORT Source Category Indicator-Parameter Insights Relating to the AMO Survey Insights Relating to the UMA Other Comments 38 CAF Average age of vehicle fleet Average mini-bus age (years) Other options available for calculating (e.g., based on fleet data) 39 CAF Average age of vehicle fleet Average taxi-collective age (years) Other options available for calculating (e.g., based on fleet data) 40 McKinsey Congestion index Average speed during morning rush hour 41 SMP Congestion index Congestion and delays 42 SUMI Congestion index Congestion and delays indicator 43 EUTransport - Cities and Greater Cities Distance travelled Average length of journey to work by private car - km can be calculated for other modes as well 44 EU PT and AT Distance travelled Passenger km pkm values need to be included in the indicators (by mode) 45 EU PT and AT Distance travelled Vehicle km UMA can be useful for calculating per capita averages 46 CAF Farebox recovery % subsidy / bus collection Other options available for calculating (interviews with authorities 47 CAF Farebox recovery % subsidy / rails collection Other options available for calculating (interviews with authorities 48 CAF Farebox recovery % subsidy / total collection Other options available for calculating (interviews with authorities 49 SDG Modal split 9.1.2 Passenger and freight volumes, by mode of transport 50 SUTI Modal split Modal share of active and public transport in commuting 51 EU PT and AT Modal split Mode share walking and public transport (%) 52 Arcardis SCMI Modal split Share of commuters cycling or walking to work 53 EUTransport - Cities and Greater Cities Modal split Share of journeys to work by bicycle -% 54 EUTransport - Cities and Greater Cities Modal split Share of journeys to work by car -% 55 EUTransport - Cities and Greater Cities Modal split Share of journeys to work by car or motorcycle -% 56 EUTransport - Modal split Share of journeys to work by foot -% FF AFRICA URBAN MOBILITY OBSERVATORY – ROLE OF INFORMAL PARATRANSIT REPORT Source Category Indicator-Parameter Insights Relating to the AMO Survey Insights Relating to the UMA Other Comments Cities and Greater Cities 57 EUTransport - Cities and Greater Cities Modal split Share of journeys to work by motorcycle -% 58 EUTransport - Cities and Greater Cities Modal split Share of journeys to work by public transport (rail, metro, bus, tram) -% 59 Arcardis SCMI Modal split Share of total trips taken by public transport 60 EU PT and AT Modal split Total number of daily trips by walking and public transport 61 CAF Modal split Trips / inhabitant / day T. Individual The amount of trips/person/day (by mode) is also quite important to include 62 CAF Modal split Trips / inhabitant / day T. Non-Motorised The amount of trips/person/day (by mode) is also quite important to include 63 CAF Modal split Trips / inhabitant / day T. Total The amount of trips/person/day (by mode) is also quite important to include 64 CAF Modal split Trips / inhabitant / day T. Collective The amount of trips/person/day (by mode) is also quite important to include 65 McKinsey Other ƒ Bicycle lanes as a percentage of the total length of the road network (excluding highways) Other options available for calculating 66 EU PT and AT Other Accessibility of vehicles to people with reduced physical mobility (%) 67 CAF Other Annual Car Spending (million US $) consider including questions on spending on vehicle / mode use 68 CAF Other Annual Motorcycle Spending (million US $) consider including questions on spending on vehicle / mode use 69 CAF Other Annual Omnibus spending (million US $) consider including questions on spending on vehicle / mode use 70 CAF Other Annual Taxi Expense (million US $) consider including questions on spending on vehicle / mode use 71 EU PT and AT Other Availability of motorised transport alternative maybe important to have a question on this in the survey 72 Arcardis SCMI Other Average number of public transport journeys per capita Activity indicator GG AFRICA URBAN MOBILITY OBSERVATORY – ROLE OF INFORMAL PARATRANSIT REPORT Source Category Indicator-Parameter Insights Relating to the AMO Survey Insights Relating to the UMA Other Comments 73 ITDP NA Other Block Density Other options available for calculating 74 EU PT and AT Other Cleanliness of walking environment can be considered later 75 McKinsey Other Dedicated bus lanes, as percentage of the road network (excluding highways) Other options available for calculating 76 EU PT and AT Other Ease of wayfinding Consider integrating in the survey maybe lower priority 77 CAF Other Fixed cost vehicle-year (US $ / year) Unclear indicator; needs to be revisited 78 Arcardis SCMI Other Green space as share of city area Other options available for calculating 79 EUTransport - Cities and Greater Cities Other Length of bicycle network (dedicated cycle paths and lanes) - km Infrastructure 80 EU PT and AT Other Length of lines infrastructure related 81 EU PT and AT Other Level of human activity 82 SUMI Other Mobility space usage indicator Other options available for calculating 83 SUMI Other Multimodal integration indicator 84 UNCRD EST Other Number of kilometres of cycleways Infrastructure indicator 85 UNCRD EST Other Number of kilometres of dedicated, median busways (Bus Rapid Transit) Infrastructure indicator 86 UNCRD EST Other Number of kilometres of footpaths that have been upgraded to be fully accessible to persons in wheelchairs Infrastructure indicator 87 UNCRD EST Other Number of kilometres of MRT Infrastructure indicator 88 UNCRD EST Other Number of secure bicycle parking spaces Infrastructure indicator 89 EU PT and AT Other Number of stops 90 EU PT and AT Other Number of vehicles in fleet Other options available for calculating 91 SMP Other Opportunity for active mobility Infrastructure indicator 92 SUMI Other Opportunity for Active Mobility indicator Infrastructure indicator 93 McKinsey Other Pedestrian connectivity (length of route from Point A to Point B compared to straight distance, for the sample of routes in each city data from the UMA can be compared to straight-line distances HH AFRICA URBAN MOBILITY OBSERVATORY – ROLE OF INFORMAL PARATRANSIT REPORT Source Category Indicator-Parameter Insights Relating to the AMO Survey Insights Relating to the UMA Other Comments 94 McKinsey Other Percentage of respondents who are satisfied with recent changes (past three to five years) satisfaction/quality of service questions can be considered Satisfaction-related 95 McKinsey Other Percentage of respondents who are satisfied with specific aspects of their current service satisfaction/quality of service questions can be considered Satisfaction-related 96 EU PT and AT Other Provision of pedestrian oriented amenities such as bins, lighting, seating, and signage Ideal, but hard to quantify; maybe to be considered in specific surveys relating to walkability 97 EU PT and AT Other PT satisfaction overall satisfaction/quality of service questions can be considered satisfaction 98 SMP Other Quality of public area We can probably include this in the future 99 SUMI Other Quality of public spaces indicator We can probably include this in the future 100 SUM4All Other Road Connectivity Index (0-100) Infrastructure 101 EU PT and AT Other Satisfaction with maps, timetables, and journey information maybe lower priority 102 EU PT and AT Other Sense of air quality Can be integrated in qualitative surveys perception of environment; for later consideration 103 EU PT and AT Other Sense of noise Can be integrated in qualitative surveys perception of environment; for later consideration 104 SUMI Other Traffic safety active modes indicator Can be validated by qualitative surveys Can be taken from other data sources 105 CAF Other Trips / inhabitant / day T. Individual Can be validated by qualitative surveys The amount of trips/person/day (by mode) is also quite important to include 106 CAF Other Trips / inhabitant / day T. Non-Motorised Can be validated by qualitative surveys The amount of trips/person/day (by mode) is also quite important to include 107 CAF Other Trips / inhabitant / day T. Total The amount of trips/person/day (by mode) is also quite important to include 108 CAF Other Trips / inhabitant / day T. Collective The amount of trips/person/day (by mode) is also quite important to include 109 EU PT and AT Other Walking satisfaction satisfaction/quality of service questions can be considered Satisfaction-related 110 SDG Public transit access 11.2.1 Proportion of population that has convenient access to public transport, by sex, age, and persons with disabilities Main indicator can be derived from other geospatial datasets 111 EU PT and AT Public transit access Accessibility of stations and stops to people with reduced physical mobility Main indicator can be derived from other geospatial datasets 112 SUTI Public transit access Convenient access to public transport service Main indicator can be derived from geospatial analysis using other data sources (location + PT) II AFRICA URBAN MOBILITY OBSERVATORY – ROLE OF INFORMAL PARATRANSIT REPORT Source Category Indicator-Parameter Insights Relating to the AMO Survey Insights Relating to the UMA Other Comments 113 EU PT and AT Public transit access Distance travelled to reach nearest PT stop Analysis of length from Origin to stops can be useful Main indicator can be derived from other geospatial datasets 114 ITDP NA Public transit access Jobs Near Frequent Transit Analysis of the subset (low income) of first mile legs to nearest transit stop Main indicator can be derived from geospatial analysis using other data sources (location + PT) 115 ITDP NA Public transit access Jobs Near Rapid Transit Analysis of length from rapid transit to destination Main indicator can be derived from geospatial analysis using other data sources (location + PT) 116 ITDP NA Public transit access Low Income Households Near Frequent Transit Main indicator can be derived from other geospatial datasets 117 ITDP NA Public transit access Low Income Households Near Rapid Transit Analysis of the subset (low income) of first mile legs to nearest transit stop Main indicator can be derived from geospatial analysis using other data sources (location + PT) 118 ITDP NA Public transit access People Near Frequent Transit Analysis of lengths from origin to frequent transit stations can be useful 119 ITDP NA Public transit access People Near Rapid Transit Analysis of lengths from origin to rapid transit station can be useful 120 McKinsey Public transit access Percentage of population living within one kilometre of a metro station/suburban rail station Main indicator can be derived from geospatial analysis using other data sources (location + PT) 121 EU PT and AT Public transit access Population residing < 500 meters from a public transport stop (%) 122 SMP Public transit comfort Comfort and pleasure qualitative question/s on comfort can be included 123 EU PT and AT Public transit reliability Average reliability of services Can be validated by qualitative surveys 124 UNCRD EST Public transit reliability Off-peak frequency of public transport systems 125 SUTI Public transit reliability Public transport quality and reliability questions on perception on quality and reliability can be included 126 SDG Safety perception in public transit 16.1.4 Proportion of population that feel safe walking alone around the area they live questions on safety while walking can be included 127 EU PT and AT Safety perception in public transit Perception of safety for women disaggregate results for women based on gender categories JJ AFRICA URBAN MOBILITY OBSERVATORY – ROLE OF INFORMAL PARATRANSIT REPORT Source Category Indicator-Parameter Insights Relating to the AMO Survey Insights Relating to the UMA Other Comments 128 McKinsey Safety perception in public transit Safety enforcement index we can consider question/s regarding enforcement 129 SMP Safety perception in public transit Security questions on safety while walking can be included can be considered later 130 SUMI Safety perception in public transit Security indicator questions on safety while walking can be included 131 EU PT and AT Safety perception in public transit Sense of personal security while walking questions on safety while walking can be included safety perception but for walking 132 SDG Sexual aggression rate 11.7.2 Proportion of persons victim of physical or sexual harassment, by sex, age, disability status and place of occurrence, in the previous 12 months question on sexual harassment/physical harassment on PT/walking can be included 133 McKinsey Transfers Average transfer time between public transport modes calculate based on UMA 134 EU PT and AT Transfers Average waiting time at stops (minutes) calculate based on UMA 135 SUM4All Transport related emissions CO2 emission from transport (of which road) relative to GDP (PPP) (kg per dollar) activity (trips and km by mode) can be used as input fleet data essential; top-down estimates 136 SUM4All Transport related emissions CO2 emission from transport relative to GDP (PPP) (kg per dollar) activity (trips and km by mode) can be used as input fleet data essential; top-down estimates 137 SMP Transport related emissions Emissions of greenhouse gases activity (trips and km by mode) can be used as input fleet data essential; top-down estimates 138 SUM4All Transport related emissions Transport-related GHG emissions per capita (tons of CO2 per capita) activity (trips and km by mode) can be used as input fleet data essential; top-down estimates 139 EU PT and AT Travel time Average commercial speed of public transport can be computed based on the UMA 140 CAF Travel time Average Omnibus travel times (minutes / trips) duration data can be useful as input 141 EUTransport - Cities and Greater Cities Travel time Average time of journey to work - minutes calculate based on UMA 142 McKinsey Travel time Commuting time predictability index statistical analysis on the commuting instances per participant can be explored 143 SUMI Travel time Commuting travel time indicator duration data can be useful as input KK AFRICA URBAN MOBILITY OBSERVATORY – ROLE OF INFORMAL PARATRANSIT REPORT Source Category Indicator-Parameter Insights Relating to the AMO Survey Insights Relating to the UMA Other Comments 144 CAF Travel time Non-motorised T. Time (1000 hours / day) duration data can be useful as input 145 CAF Travel time Time Hours / habitant / day question can be included on perceived time spent per day on travelling calculate based on UMA 146 CAF Travel time Time T. Indiv. Motorised (1000 hours / day) duration data can be useful as input 147 EU PT and AT Travel time Total time spent riding on public transport on daily trips (minutes) can be computed based on the UMA 148 EU PT and AT Travel time Total time spent walking on daily trips (minutes) can be computed based on the UMA 149 CAF Travel time Total transportation time (1000 hours / day) duration data can be useful as input 150 UNCRD EST Infrastructure Number of cities with dedicated cycleways LL AFRICA URBAN MOBILITY OBSERVATORY – ROLE OF INFORMAL PARATRANSIT REPORT ANNEX E. AUMO INDICATORS MOBILITY Distance travelled per person Description: Average total distance travelled for typical return journeys of respondents (from their places of residence to locations of primary regular activity, and back home). This could include trips to and from school, work, shops, etc. Digital Survey Data Collection Method: Surveyed respondents were asked to state the origin and destination zones, in relation to their frequent return journeys. A distance was then calculated based on the straight-line distance from centre to centre of the two zones. UMA Survey Data Collection Method: UMA app detects distance travelled automatically. Mode share Description: Main mode of transport (i.e., mode which covers the most distance) used by respondents to reach their primary regular activity location (such as trips to and from school, work, shops). Digital Survey Data Collection Method: Surveyed respondents were asked to state the main mode of travel used, in relation to their frequent return journeys. UMA Survey Data Collection Method: UMA app detects travel modes automatically (and records the mode used for each leg of each trip). Period of travel Description: Main period of travel (i.e., morning/afternoon peak or off-peak) by respondents to reach their primary regular activity location (such as trips to and from school, work, shops). Digital Survey Data Collection Method: Surveyed respondents were asked to state the period of travel for their frequent return journeys (for both directions of travel). UMA Survey Data Collection Method: UMA app detects the period of travel automatically. Number of transfers Description: Average number of transfers (from one vehicle to another, or from one mode to another) during respondents' trips to reach their primary regular activity destination (such as school, work, shops). Digital Survey Data Collection Method: Surveyed respondents were asked to state the number of transfers typically required, in relation to their frequent return journeys. UMA Survey Data Collection Method: UMA app detects the number of transfers automatically. Travel time Description: Combined average of the total duration of typical return journeys of respondents (from their places of residence to locations of primary regular activity, and back home). This could include trips to and from school, work, shops, etc. Digital Survey Data Collection Method: Surveyed respondents were asked to state the typical total travel duration, in relation to their frequent return journeys. UMA Survey Data Collection Method: UMA app detects total travel time automatically. Accessibility Description: % of population within 500 metres of public transport stations Digital Survey Data Collection Method: Calculation uses open data on population distribution (WorldPop dataset) (152) and public transport facilities (145, 146). EXPERIENCE MM AFRICA URBAN MOBILITY OBSERVATORY – ROLE OF INFORMAL PARATRANSIT REPORT Condition of public transport vehicles Description: Perceived condition of public transport vehicles, as stated by respondents, in response to survey questions about public transport in their city. Digital Survey Data Collection Method: Surveyed respondents were asked to state their perception of the condition of public transport vehicles, in relation to their frequent return journeys. UMA Survey Data Collection Method: Collected via supplementary web survey. Crime on public transport Description: Perceived levels of crime on public transport, as stated by respondents, in response to survey questions about public transport in their city. Digital Survey Data Collection Method: Surveyed respondents were asked to indicate whether they had ever been a victim or witnessed crime while travelling or waiting for transport in their city (survey response options: no, once, more than once, very often). UMA Survey Data Collection Method: Collected via supplementary web survey. Public transport driver behaviour Description: Perception of public transport vehicle driver behaviour, as stated by respondents, in response to survey questions about public transport in their city. Digital Survey Data Collection Method: Surveyed respondents were asked to state their perception of public transport drivers' behaviour, in relation to their frequent return journeys (survey response options: poor, acceptable, excellent). UMA Survey Data Collection Method: Collected via supplementary web survey. Public transport comfort Description: Perceived levels of comfort of public transport vehicles, as stated by respondents, in response to survey questions about public transport in their city. Digital Survey Data Collection Method: Surveyed respondents were asked to state their perception of public transport levels of comfort, in relation to their frequent return journeys (survey response options: poor, fair, excellent). UMA Survey Data Collection Method: Collected via supplementary web survey. Public transport reliability Description: Perceived levels of reliability of public transport vehicles, as stated by respondents, in response to survey questions about public transport in their city. Digital Survey Data Collection Method: Surveyed respondents were asked to indicate whether they perceived public transport to be reliable/on time (survey response options: usually late, usually on time, always on time). UMA Survey Data Collection Method: Collected via supplementary web survey. Sexual harassment Description: Witnessed and experienced levels of sexual harassment while travelling on public transport, as stated by respondents, in response to survey questions about public transport in their city. Digital Survey Data Collection Method: Surveyed respondents were asked to state whether they had witnessed or personally experienced sexual harassment while travelling on public transport, in relation to their frequent return journeys (survey response options: no, once, more than once, very often). UMA Survey Data Collection Method: Collected via supplementary web survey. Affordability NN AFRICA URBAN MOBILITY OBSERVATORY – ROLE OF INFORMAL PARATRANSIT REPORT Description: Household monthly income spent on transport (% of min. wage for 50 public transit trips). Digital Survey Data Collection Method: Household income range and transport expenditures asked during the survey Traffic fatalities Description: Number of traffic fatalities per 1,000 inhabitants. Digital Survey Data Collection Method: Data collected from official statistics; Can be complemented later on by more detailed (e.g., geographically tagged data; data released in machine readable formats). Efficiency Vehicle occupancy Description: Average vehicle occupancy during typical return journeys of respondents (from their places of residence to locations of primary regular activity, and back home). This could include trips to and from school, work, shops, etc. Digital Survey Data Collection Method: Surveyed respondents were asked to state the typical level of vehicle occupancy for the main mode of transport used, in relation to their frequent return journeys (not crowded, fairly crowded, very crowded). UMA Survey Data Collection Method: Collected via supplementary web survey. CO2 emissions Description: tons CO2 attributable to transportation activities in the geographical boundaries of the city Digital Survey Data Collection Method: Not directly collected but input data collected digitally (e.g., vehicle ownership; average km/vehicle; mode shares, etc) can be used to calculate the indicator. UMA generated data such as speed can be used for the estimation processes. Congestion Description: Ratio of free flow over congested speed (peak hour). Digital Survey Data Collection Method: Can be calculated using UMA data. UMA generated data on speed vs free flow conditions. OO AFRICA URBAN MOBILITY OBSERVATORY – ROLE OF INFORMAL PARATRANSIT REPORT ANNEX F. EXPERTS INTERVIEW Interview Guide Questions – Big Data and Sustainable Urban Mobility Characteristics of the interview Interviewer(s): Interviewee: Date: Place of interview: Start: End: Duration: Introduction 1. Welcome, and thank you very much for taking the time today! 2. Short personal introduction 3. Short introduction AUMO & Big Data and Sustainable Urban Mobility project o Evaluate What has been done o What more is there o Reflect on the effectiveness, challenges, etc. of the methods 4. Motivation and goals for the interview 5. Data Protection and consent for recording - All information will be treated confidentially. We will anonymise the data, so no inference to your person will be possible. If you feel uncomfortable with a question, you do not have to answer. - In this context, I would like to ask for your permission to record the interview to ensure that no information is lost and that I can devote myself fully to the conversation. 6. Questions? Do you have any questions prior to the interview? About Yourself Can you tell me about yourself and how "big data" relates to your work? Big Data is often described using the 3 V's, meaning volume, variety, and velocity. ... Would you have any insights regarding this definition? What is your understanding of Big Data? 1. FEASIBLE AND IMPACTFUL USE CASES OF BIG DATA FOR SUSTAINABLE URBAN MOBILITY SYSTEMS Have you been working on projects involving big data before? (Urban mobility related) 1.1. What are the most feasible and impactful use cases for Big Data utilisation towards aiding sustainability in urban mobility systems - particularly in developing cities - you encountered? 1.2. Do you know about such use cases in the African Region? 2. BARRIERS TO THE UPTAKE OF BIG DATA SYSTEMS 2.1 Based on your experience, what have been the most critical challenges in adopting such Big Data technologies (particularly concerning aiding urban mobility planning or management in cities. )? PP AFRICA URBAN MOBILITY OBSERVATORY – ROLE OF INFORMAL PARATRANSIT REPORT 3. DRIVERS FOR THE UPTAKE OF BIG DATA SYSTEMS Based on your knowledge and experience… 3.1 What are the key drivers for using such Big Data to aid urban mobility planning and management? 4. THE ROLE OF CITY AUTHORITIES 4.1. What do you think should be the role of city authorities in relation to urban mobility Big Data systems? 4.2. How can cities address the potential negative consequences of utilising Big Data in urban mobility policy and planning processes? • e.g., ensuring representativeness, accuracy, etc. Concluding question What would be your key advice towards city authorities in developing cities if they are interested in utilising Big Data platforms? • e.g., in the African region • Where and how do they start? We have now reached the end of our interview. Is there any final thought you would like to add? Thank you very much for the great interview and for taking the time today! QQ AFRICA URBAN MOBILITY OBSERVATORY – ROLE OF INFORMAL PARATRANSIT REPORT ANNEX G. ETHICS CLEARANCE LETTER (DATA COLLECTION) RR AFRICA URBAN MOBILITY OBSERVATORY – ROLE OF INFORMAL PARATRANSIT REPORT ANNEX H. QUESTIONNAIRES USED IN DATA COLLECTION For illustrative purposes, only the surveys localised for Lagos are included in this appendix. Pilot Field Survey Questionnaire Welcome to the HVT Africa Urban Mobility Observatory Transport Survey. The data collected will be used to help identify how to improve transport in this city. The estimated duration of this survey is 3 minutes. Collected data is anonymised and aggregated before being published. Your participation is voluntary, if you no longer wish to participate, you may end this session at any time. You must be 18 years or older to participate 1. Part A - Initiate Survey 1.1. What is your age? 1.1.1. 17 or younger (incomplete survey, display: "thank you for your time") 1.1.2. 18 - 24 (proceed) 1.1.3. 25 - 34 (proceed) 1.1.4. 35 - 54 (proceed) 1.1.5. 55 - 64 (proceed) 1.1.6. 65 or older (proceed) 1.2. Which gender do you identify with? 1.2.1. Female 1.2.2. Male 1.2.3. Non-binary 1.2.4. Prefer not to say 2. Part B - Travel Survey 2.1. What is your suburb/area of residence? 2.1.1. Present list of suburbs, user then responds by selecting the correct option 2.2. On a typical weekday, how long would you need to walk to access public transport? 2.2.1. 0 to 5 mins 2.2.2. 6 to 15 mins 2.2.3. 16 to 30 mins 2.2.4. 31 mins or more 2.3. What is your suburb/area of work/study/primary activity? 2.3.1. Present list of suburbs, user then responds by selecting the correct option 2.4. On a typical weekday, how long would you need to walk from work/study/primary activity location to access public transport? 2.4.1. 0 to 5 mins 2.4.2. 6 to 15 mins 2.4.3. 16 to 30 mins 2.4.4. 31 mins or more 2.5. What is the typical duration of your most frequent commute from home to work/education/primary activity? 2.5.1. less than 15 mins 2.5.2. 16 to 30 mins 2.5.3. 31 to 60 mins 2.5.4. 61 to 90 mins 2.5.5. more than 91 mins 2.6. What time do you leave for your typical trip from home to work/education/primary activity? 2.6.1. 06:00 am - 07:59 am 2.6.2. 08:00 am - 09:00 am 2.6.3. 03:00 pm - 04:59pm 2.6.4. 05:00 pm - 06:00 pm 2.6.5. Outside of the above hours 2.7. What is the typical duration of your most frequent commute from work/education/primary activity back home? SS AFRICA URBAN MOBILITY OBSERVATORY – ROLE OF INFORMAL PARATRANSIT REPORT 2.7.1. less than 15 mins 2.7.2. 16 to 30 mins 2.7.3. 31 to 60 mins 2.7.4. 61 to 90 mins 2.7.5. more than 91 mins 2.8. What time do you leave for your typical trip from work/education/activity centre back home? 2.8.1. 06:00 am - 07:59 am 2.8.2. 08:00 am - 09:00 am 2.8.3. 03:00 pm - 04:59pm 2.8.4. 05:00 pm - 06:00 pm 2.8.5. Outside of the above hours 2.9. What is the total cost of your most frequent trip, to and from your destination? (to be converted into local currency for each city) 2.9.1. less than NGN399 2.9.2. NGN400 to NGN1199 2.9.3. NGN1200 to NGN2399 2.9.4. NGN2400 to NGN4799 2.9.5. more than NGN4800 2.10. What is your most common travel purpose? 2.10.1. Work 2.10.2. Shops/Food 2.10.3. Healthcare 2.10.4. Social Activity 2.10.5. Education Access 2.10.6. Other 2.11. How many times a week do you do this type of trip? 2.11.1. 0 - 1 times per week 2.11.2. 2 - 3 times per week 2.11.3. 4 - 5 times per week 2.11.4. 6 - 7 times per week 2.12. What is the main mode of transport you use? 2.12.1. Walking Only (skip to 3.1) 2.12.2. Cycling Only (skip to 3.1) 2.12.3. Public Transport (minibus/Danfo, bus, Keke Napep/Okada, etc) 2.12.4. Private Transport (car, motorbike, private taxi/uber) (skip to 2.16) 2.13. Which is the main public transport mode you use (spend the most time on) 2.13.1. Minibus/Danfo 2.13.2. Keke Napep/Okada 2.13.3. Bus/BRT 2.13.4. BRT 2.13.5. Water Taxi 2.14. Which is the second public transport mode you most use 2.14.1. Minibus/Danfo 2.14.2. Keke Napep/Okada 2.14.3. Bus/BRT 2.14.4. BRT 2.14.5. Water Taxi 2.14.6. None 2.15. How many times do you change mode or vehicle during your journey? 2.15.1. None/direct route 2.15.2. 1 2.15.3. 2 2.15.4. 3 or more TT AFRICA URBAN MOBILITY OBSERVATORY – ROLE OF INFORMAL PARATRANSIT REPORT 2.16. How crowded is the vehicle usually when you make this journey? 2.16.1. Not crowded 2.16.2. Fairly crowded 2.16.3. Very crowded 2.16.4. Overloaded (exceeds legal capacity of vehicle) 3. Part C - Travel Experience 3.1. What do you worry about most when you use public transport in this city? 3.1.1. Cost of transport 3.1.2. Crime (theft of purse/phone etc) 3.1.3. Sexual harassment 3.1.4. Violence (fights etc) 3.1.5. Road Safety (accidents) 3.1.6. Air and/or noise Pollution 3.2. Have you ever been a victim of, or witnessed crime while traveling on public transport in this city? 3.2.1. Yes, once 3.2.2. Yes, more than once 3.2.3. Yes, often 3.2.4. Never 3.3. Have you ever been a victim of, or witnessed anyone being sexually harassed while travelling on public transport in this city? 3.3.1. Never 3.3.2. Yes, once 3.3.3. Yes, more than once 3.3.4. Yes, often 3.4. How would you describe the condition of public transport vehicles? 3.4.1. Poor 3.4.2. Acceptable 3.4.3. Excellent 3.5. How would you describe public transport driver behaviour in this city? 3.5.1. Poor 3.5.2. Acceptable 3.5.3. Excellent 3.6. Is public transport reliable/on time? 3.6.1. Usually late 3.6.2. Sometimes late 3.6.3. Usually on time 3.6.4. Always on time 3.7. Are public transport vehicle occupants adhering to local COVID-19 regulations (masks, partial loading, sanitisers etc) 3.7.1. Poor 3.7.2. Acceptable 3.7.3. Excellent 3.7.4. Not Applicable 4. Part D - Demographics 4.1. What is your highest qualification? 4.1.1. None 4.1.2. Primary School 4.1.3. High School 4.1.4. Technical/Vocational 4.1.5. College/University 4.2. What is your occupation status? 4.2.1. Employed/Self-Employed UU AFRICA URBAN MOBILITY OBSERVATORY – ROLE OF INFORMAL PARATRANSIT REPORT 4.2.2. Full-Time Parent 4.2.3. Student/Scholar 4.2.4. Unemployed/Pensioner 4.2.5. Other 4.3. What is your monthly household income? 4.3.1. Under NGN 39,999 4.3.2. NGN 40,000 to NGN 99,999 4.3.3. NGN 100,000 to NGN 199,999 4.3.4. NGN 200,000 to NGN 399,999 4.3.5. NGN 400,000 to NGN 799,999 4.3.6. Over NGN 800,000 4.4. Do you have any disabilities? 4.4.1. Yes 4.4.2. No (end survey) 4.5. Do you have a sight impairment? 4.5.1. Yes 4.5.2. No 4.6. Do you have a mobility impairment? 4.6.1. Yes 4.6.2. No 4.7. Do you have a hearing impairment? 4.7.1. Yes 4.7.2. No 4.8. Do you have any other impairments? 4.8.1. Yes 4.8.2. No Display: "Thank you for participating" Main Phase 1 Field Survey Questionnaire Welcome to the HVT Africa Urban Mobility Observatory Transport Survey. The data collected will be used to help identify how to improve transport in this city. The estimated duration of this survey is 5 minutes. Collected data is anonymised and aggregated before being published. Your participation is voluntary, if you no longer wish to participate, you may end this survey at any time. You must be 18 years or older to participate. 1. Part A - Initiate Survey 1.1. What is your age? 1.1.1. Response:____ (If 17 or younger, exit and display "thank you for your time". If over 18, proceed) 1.2. What is your gender? 1.2.1. Female 1.2.2. Male 1.2.3. Non-Binary 2. Part B - Travel Survey 2.1. What is your area of residence? 2.1.1. Agege 2.1.2. Ajeromi Ifelodun 2.1.3. Alimosho 2.1.4. Amuwo Odofin 2.1.5. Apapa 2.1.6. Eti Osa 2.1.7. Ifako Ijaye 2.1.8. Ikeja 2.1.9. Kosofe VV AFRICA URBAN MOBILITY OBSERVATORY – ROLE OF INFORMAL PARATRANSIT REPORT 2.1.10. Lagos Island 2.1.11. Lagos Mainland 2.1.12. Mushin 2.1.13. Ojo 2.1.14. Oshodi Isolo 2.1.15. Shomolu 2.1.16. Surulere 2.2. What is the most common reason for you to travel in this city? 2.2.1. Work 2.2.2. Shops/Food 2.2.3. Healthcare 2.2.4. Social 2.2.5. Education Access 2.3. What is the area of this activity? 2.3.1. Agege 2.3.2. Ajeromi Ifelodun 2.3.3. Alimosho 2.3.4. Amuwo Odofin 2.3.5. Apapa 2.3.6. Eti Osa 2.3.7. Ifako Ijaye 2.3.8. Ikeja 2.3.9. Kosofe 2.3.10. Lagos Island 2.3.11. Lagos Mainland 2.3.12. Mushin 2.3.13. Ojo 2.3.14. Oshodi Isolo 2.3.15. Shomolu 2.3.16. Surulere 2.4. How much does this return journey typically cost per day (in NGN) 2.4.1. Response:_____ 2.5. How many times a week (enter number) do you typically take this journey? 2.5.1. Response:_____ 2.6. What time do you usually leave home to reach your destination? 2.6.1. 6am - 7:59am 2.6.2. 8am - 8:59am 2.6.3. 9am - 2:59pm 2.6.4. 3pm - 4:59pm 2.6.5. 5pm - 5:59pm 2.6.6. 6pm - 5:59am 2.7. How long (in minutes) does it take you to travel from home to your destination? 2.7.1. Response:_____ 2.8. What time do you usually leave to return home? 2.8.1. 6am - 7:59am 2.8.2. 8am - 8:59am 2.8.3. 9am - 2:59pm 2.8.4. 3pm - 4:59pm 2.8.5. 5pm - 5:59pm 2.8.6. 6pm - 5:59am 2.9. How long (in minutes) does it take to return home? 2.9.1. Response:_____ 2.10. How do you usually travel? WW AFRICA URBAN MOBILITY OBSERVATORY – ROLE OF INFORMAL PARATRANSIT REPORT 2.10.1. Walking Only (skip to 3.1) 2.10.2. Cycling Only (skip to 3.1) 2.10.3. Private Transport (car, motorbike, metered taxi) (skip to 3.1) 2.10.4. Minibus Taxi 2.10.5. Sedan/MPV Shared Taxi 2.10.6. Motorbike/3-wheeler Taxi 2.10.7. City bus 2.10.8. BRT bus 2.10.9. Water Ferry 2.11. How many times do you change vehicles during your journey? 2.11.1. None (direct route) 2.11.2. Once 2.11.3. Twice 2.11.4. Three times or more 2.12. How comfortable are the vehicles you usually use when making this journey? 2.12.1. Poor 2.12.2. Fair 2.12.3. Excellent 2.13. How crowded are the vehicles usually when you make this journey? 2.13.1. Not crowded 2.13.2. Fairly crowded 2.13.3. Very crowded 3. Part C - Travel Experience 3.1. Have you ever been a victim of, or witnessed crime while travelling or waiting for transport in this city? 3.1.1. No 3.1.2. Once 3.1.3. More than once 3.1.4. Very often 3.2. Have you ever been a victim of, or witnessed anyone being sexually harassed while travelling or waiting for transport in this city? 3.2.1. No 3.2.2. Once 3.2.3. More than once 3.2.4. Very often 3.3. How frequently do public transport vehicles break down during your journey? 3.3.1. Never 3.3.2. Sometimes 3.3.3. Often 3.4. How would you rate public transport drivers' adherence to road regulations? 3.4.1. Poor 3.4.2. Acceptable 3.4.3. Excellent 3.5. Is public transport reliable/on time? 3.5.1. Usually late 3.5.2. Usually on time 3.5.3. Always on time 4. Part D - Demographics 4.1. What is your highest qualification? 4.1.1. None 4.1.2. Primary School 4.1.3. High School 4.1.4. College/University/Technical XX AFRICA URBAN MOBILITY OBSERVATORY – ROLE OF INFORMAL PARATRANSIT REPORT 4.2. What is your occupation status? 4.2.1. Employed/Self-Employed 4.2.2. Full-Time Parent 4.2.3. Student/Scholar 4.2.4. Unemployed 4.2.5. Pensioner 4.3. What is your monthly household income? 4.3.1. Under NGN39,999 4.3.2. NGN40,000 to NGN99,999 4.3.3. NGN100,000 to NGN199,999 4.3.4. NGN200,000 to NGN399,999 4.3.5. NGN400,000 to NGN799,999 4.3.6. Over NGN800,000 4.4. Do you have any physical disabilities? 4.4.1. None 4.4.2. Sight 4.4.3. Hearing 4.4.4. Mobility 4.4.5. Speech Display: "Thank you for participating" Main Phase 2 Field Survey Questionnaire Welcome to the HVT Africa Urban Mobility Observatory Transport Survey. The data collected will be used to help identify how to improve transport in this city. The estimated duration of this survey is 5 minutes. Collected data is anonymised and aggregated before being published. Your participation is voluntary, if you no longer wish to participate, you may end this survey at any time. You must be 18 years or older to participate. 1. Part A - Initiate Survey 1.1. What is your age? 1.1.1. Response:____ (If 17 or younger, exit and display "thank you for your time". If over 18, proceed) 1.2. What is your gender? 1.2.1. Female 1.2.2. Male 2. Part B - Travel Survey 2.1. What is your area of residence? 2.1.1. Agege 2.1.2. Ajeromi Ifelodun 2.1.3. Alimosho 2.1.4. Amuwo Odofin 2.1.5. Apapa 2.1.6. Eti Osa 2.1.7. Ifako Ijaye 2.1.8. Ikeja 2.1.9. Kosofe 2.1.10. Lagos Island 2.1.11. Lagos Mainland 2.1.12. Mushin 2.1.13. Ojo 2.1.14. Oshodi Isolo 2.1.15. Shomolu 2.1.16. Surulere 2.2. What is the most frequent activity you perform that requires travelling in this city? 2.2.1. Work YY AFRICA URBAN MOBILITY OBSERVATORY – ROLE OF INFORMAL PARATRANSIT REPORT 2.2.2. Shops/Food 2.2.3. Healthcare 2.2.4. Social 2.2.5. Education Access 2.3. What is the area of this frequent activity? 2.3.1. Agege 2.3.2. Ajeromi Ifelodun 2.3.3. Alimosho 2.3.4. Amuwo Odofin 2.3.5. Apapa 2.3.6. Eti Osa 2.3.7. Ifako Ijaye 2.3.8. Ikeja 2.3.9. Kosofe 2.3.10. Lagos Island 2.3.11. Lagos Mainland 2.3.12. Mushin 2.3.13. Ojo 2.3.14. Oshodi Isolo 2.3.15. Shomolu 2.3.16. Surulere 2.4. How much does it cost to travel to and from this frequent activity per day (in NGN)? 2.4.1. Response:_____ 2.5. How many times a week (enter number) do you travel to take part in this activity? 2.5.1. Response:_____ 2.6. What time do you usually leave home to reach this activity? 2.6.1. 6am - 7:59am 2.6.2. 8am - 8:59am 2.6.3. 9am - 2:59pm 2.6.4. 3pm - 4:59pm 2.6.5. 5pm - 5:59pm 2.6.6. 6pm - 5:59am 2.7. How long (in MINUTES) does it take you to travel from home to this activity? 2.7.1. Response:_____ 2.8. What time do you usually leave the activity to return home? 2.8.1. 6am - 7:59am 2.8.2. 8am - 8:59am 2.8.3. 9am - 2:59pm 2.8.4. 3pm - 4:59pm 2.8.5. 5pm - 5:59pm 2.8.6. 6pm - 5:59am 2.9. How long (in MINUTES) does it take to return home? 2.9.1. Response:_____ 2.10. How do you usually travel to reach this activity? 2.10.1. Walking Only (skip to 3.1) 2.10.2. Cycling Only (skip to 3.1) 2.10.3. Own car/motorbike/taxicab (skip to 3.1) 2.10.4. Danfo 2.10.5. Kabukabu 2.10.6. Moto Taxi/3-wheel Taxi 2.10.7. LAGBUS 2.10.8. BRT bus 2.10.9. Water Ferry ZZ AFRICA URBAN MOBILITY OBSERVATORY – ROLE OF INFORMAL PARATRANSIT REPORT 2.11. How many times do you change vehicles during your journey? 2.11.1. None (direct route) 2.11.2. Once 2.11.3. Twice 2.11.4. Three times or more 2.12. How comfortable are the vehicles you usually use when making this journey? 2.12.1. Poor 2.12.2. Fair 2.12.3. Excellent 2.13. How crowded are the vehicles usually when you make this journey? 2.13.1. Not crowded 2.13.2. Fairly crowded 2.13.3. Very crowded 3. Part C - Travel Experience 3.1. Have you ever been a victim of, or witnessed crime while travelling or waiting for transport in this city? 3.1.1. No 3.1.2. Once 3.1.3. More than once 3.1.4. Very often 3.2. Have you ever been a victim of, or witnessed anyone being sexually harassed while travelling or waiting for transport in this city? 3.2.1. No 3.2.2. Once 3.2.3. More than once 3.2.4. Very often 3.3. How frequently do public transport vehicles break down during your journey? 3.3.1. Never 3.3.2. Sometimes 3.3.3. Often 3.4. How would you rate public transport drivers' adherence to road regulations? 3.4.1. Poor 3.4.2. Acceptable 3.4.3. Excellent 3.5. Is public transport reliable/on time? 3.5.1. Usually late 3.5.2. Usually on time 3.5.3. Always on time 4. Part D - Demographics 4.1. What is your highest qualification? 4.1.1. None 4.1.2. Primary School 4.1.3. High School 4.1.4. College/University/Technical 4.2. What is your occupation status? 4.2.1. Employed/Self-Employed 4.2.2. Full-Time Parent 4.2.3. Student/Scholar 4.2.4. Unemployed 4.2.5. Pensioner 4.3. What is your monthly household income? 4.3.1. Under ₦39,999 4.3.2. ₦40,000 - ₦99,999 AAA AFRICA URBAN MOBILITY OBSERVATORY – ROLE OF INFORMAL PARATRANSIT REPORT 4.3.3. ₦100,000 - ₦199,999 4.3.4. ₦200,000 - ₦399,999 4.3.5. ₦400,000 - ₦799,999 4.3.6. Over ₦800,000 4.4. Do you have any physical disabilities? 4.4.1. None 4.4.2. Sight 4.4.3. Hearing 4.4.4. Mobility 4.4.5. Speech Display: "Thank you for participating" Phase 1 USSD Survey Questionnaire 1. Part A - Initiate Survey 1.1. Welcome! Data collected is anonymised before publishing on project website. NGN100 airtime to 1st 2,000 respondents only. To continue please enter your age: 1.1.1. Response:____ (If 17 or younger, exit and display "thank you for your time". If over 18, proceed) 1.2. What is your gender? 1.2.1. Female 1.2.2. Male 1.2.3. Non-Binary 2. Part B - Travel Survey 2.1. What is the 1st letter of your AREA OF RESIDENCE in Lagos? 2.1.1. A - E (skip to 2.2) 2.1.2. I - L (skip to 2.3) 2.1.3. M - Z (skip to 2.4) 2.2. Select your AREA OF RESIDENCE: 2.2.1. Agege 2.2.2. Ajeromi Ifelodun 2.2.3. Alimosho 2.2.4. Amuwo Odofin 2.2.5. Apapa 2.2.6. Eti Osa 2.3. Select your AREA OF RESIDENCE: 2.3.1. Ifako Ijaye 2.3.2. Ikeja 2.3.3. Kosofe 2.3.4. Lagos Island 2.3.5. Lagos Mainland 2.4. Select your AREA OF RESIDENCE: 2.4.1. Mushin 2.4.2. Ojo 2.4.3. Oshodi Isolo 2.4.4. Shomolu 2.4.5. Surulere 2.5. TRIP PURPOSE: What is reason for your most frequent trips in this city? 2.5.1. Work 2.5.2. Shops/Food 2.5.3. Healthcare 2.5.4. Social 2.5.5. Education Access BBB AFRICA URBAN MOBILITY OBSERVATORY – ROLE OF INFORMAL PARATRANSIT REPORT 2.6. What is 1st letter of the AREA YOU NORMALLY TRAVEL TO for your most regular trip? 2.6.1. A - E (skip to 2.7) 2.6.2. I - L (skip to 2.8) 2.6.3. M - Z (skip to 2.9) 2.7. Select your AREA OF ACTIVITY: 2.7.1. Agege 2.7.2. Ajeromi Ifelodun 2.7.3. Alimosho 2.7.4. Amuwo Odofin 2.7.5. Apapa 2.7.6. Eti Osa 2.8. Select your AREA OF ACTIVITY: 2.8.1. Ifako Ijaye 2.8.2. Ikeja 2.8.3. Kosofe 2.8.4. Lagos Island 2.8.5. Lagos Mainland 2.9. Select your AREA OF ACTIVITY: 2.9.1. Mushin 2.9.2. Ojo 2.9.3. Oshodi Isolo 2.9.4. Shomolu 2.9.5. Surulere 2.10. DEPARTURE: What time do you leave home to reach destination? 2.10.1. 6am - 7:59am 2.10.2. 8am - 8:59am 2.10.3. 9am - 2:59pm 2.10.4. 3pm - 4:59pm 2.10.5. 5pm - 5:59pm 2.10.6. 6pm - 5:59am 2.11. DEPARTURE: How long (in minutes) does it take to travel from home to your destination? 2.11.1. Response:_____ 2.12. RETURN: What time do you leave to return home? 2.12.1. 6am - 7:59am 2.12.2. 8am - 8:59am 2.12.3. 9am - 2:59pm 2.12.4. 3pm - 4:59pm 2.12.5. 5pm - 5:59pm 2.12.6. 6pm - 5:59am 2.13. RETURN: How long (in minutes) does it take to return home? 2.13.1. Response:_____ 2.14. How do you usually travel? 2.14.1. Walk Only (skip to 3.1) 2.14.2. Cycling Only (skip to 3.1) 2.14.3. Private Transport (car, motorbike, metered taxi) (skip to 3.1) 2.14.4. Minibus Taxi 2.14.5. Sedan/MPV Shared Taxi 2.14.6. Motorbike/3-wheeler Taxi 2.14.7. City bus 2.14.8. BRT 2.14.9. Water Ferry 2.15. How many times do you CHANGE VEHICLES during your journey? 2.15.1. None (direct route) CCC AFRICA URBAN MOBILITY OBSERVATORY – ROLE OF INFORMAL PARATRANSIT REPORT 2.15.2. Once 2.15.3. Twice 2.15.4. Three times or more 3. Part D - Demographics 3.1. What is your HIGHEST QUALIFICATION? 3.1.1. None 3.1.2. Primary School 3.1.3. High School 3.1.4. College/University/Technical 3.2. What is your OCCUPATION STATUS? 3.2.1. Employed/Self-Employed 3.2.2. Full-Time Parent 3.2.3. Student/Scholar 3.2.4. Unemployed 3.2.5. Pensioner 3.3. What is your MONTHLY HOUSEHOLD INCOME in NGN? 3.3.1. 0 - 39,999 3.3.2. 40,000 to 99,999 3.3.3. 100,000 to 199,999 3.3.4. 200,000 to 399,999 3.3.5. 400,000 to 799,999 3.3.6. 800,000+ 3.4. Do you have any physical disabilities? 3.4.1. None 3.4.2. Sight 3.4.3. Hearing 3.4.4. Mobility 3.4.5. Speech Display: "Thank you for participating! You will receive NGN100 MTN airtime voucher within 24 hours" (if applicable, load airtime to respondent's account) Phase 2 USSD Survey Questionnaire HVT AUMO Lagos USSD Survey Phase 2 (English) Welcome! Data collected is anonymised before publishing on project website. N100 airtime to 1st 2,000 respondents only. To continue please enter your age: (If 17 or younger, exit and display "Thank you for your time". If over 18, proceed) What is your gender? 1) Female 2) Male What is the 1st letter of your AREA OF RESIDENCE in Lagos? (see zones selection loop q1.1) Select your AREA OF RESIDENCE: (see zones selection loop q1.2 – q1.4) FREQUENT ACTIVITY: What is reason for your most frequent trips in this city? 1) Work 2) Shops/Food 3) Healthcare 4) Social 5) Education Access What is 1st letter of the AREA YOU NORMALLY TRAVEL TO for your most frequent activity? (see zones selection loop q1.1) Select your AREA OF FREQUENT ACTIVITY: (see zones selection loop q1.2 – q1.4) DEPARTURE: What time do you leave home to reach your frequent activity? 1) 6am-7:59am DDD AFRICA URBAN MOBILITY OBSERVATORY – ROLE OF INFORMAL PARATRANSIT REPORT 2) 8am-8:59am 3) 9am-2:59pm 4) 3pm-4:59pm 5) 5pm-5:59pm 6) 6pm-5:59am DEPARTURE: How long (in minutes) does it take to travel from home to your frequent activity? RETURN: What time do you leave your frequent activity to return home? 1) 6am-7:59am 2) 8am-8:59am 3) 9am-2:59pm 4) 3pm-4:59pm 5) 5pm-5:59pm 6) 6pm-5:59am RETURN: How long (in MINUTES) does it usually take to return home from your frequent activity? How do you usually travel? 1) Walk (skip to Highest Qualification question) 2) Bicycle (skip to Highest Qualification question) 3) Own car/motorbike (skip to Highest Qualification question) 4) Danfo 5) Kabukabu 6) Moto/3-wheel Taxi 7) LAGBUS 8) BRT 9) Water Ferry How many times do you CHANGE VEHICLES during your journey? 0) None (direct route) 1) Once 2) Twice 3) 3 times or more What is your HIGHEST QUALIFICATION? 1) None 2) Primary School 3) High School 4) College/University What is your OCCUPATION STATUS? 1) Employed/Self-Employed 2) Full-time parent 3) Student 4) Unemployed 5) Pensioner What is your MONTHLY HOUSEHOLD INCOME in NGN? 1) 0-39,999 2) 40,000-99,999 3) 100,000-199,999 4) 200,000-399,999 5) 400,000-799,999 6) 800,000+ Do you have any PHYSICAL DISABILITIES? 1) None 2) Sight 3) Hearing 4) Mobility 5) Speech EEE AFRICA URBAN MOBILITY OBSERVATORY – ROLE OF INFORMAL PARATRANSIT REPORT End sessions and display: "Thank you for participating, airtime will be loaded within 72 hours for your 1st entry only (1st 2,000 respondents only)" Phase 2 WhatsApp Survey Questionnaire 1. Welcome! Data collected is anonymised before publishing on project website. To continue please enter your age:____ (If 17 or younger, exit and display "thank you for your time". If over 18, proceed) 2. What is your gender? 2.1. Female 2.2. Male 3. What is your area of residence? 3.1. Agege 3.2. Ajeromi Ifelodun 3.3. Alimosho 3.4. Amuwo Odofin 3.5. Apapa 3.6. Eti Osa 3.7. Ifako Ijaye 3.8. Ikeja 3.9. Kosofe 3.10. Lagos Island 3.11. Lagos Mainland 3.12. Mushin 3.13. Ojo 3.14. Oshodi Isolo 3.15. Shomolu 3.16. Surulere 4. What is the most frequent activity you perform that requires travelling in this city? 4.1. Work 4.2. Shops/Food 4.3. Healthcare 4.4. Social 4.5. Education Access 5. What is the area of this frequent activity? 5.1. Agege 5.2. Ajeromi Ifelodun 5.3. Alimosho 5.4. Amuwo Odofin 5.5. Apapa 5.6. Eti Osa 5.7. Ifako Ijaye 5.8. Ikeja 5.9. Kosofe 5.10. Lagos Island 5.11. Lagos Mainland 5.12. Mushin 5.13. Ojo 5.14. Oshodi Isolo 5.15. Shomolu 5.16. Surulere 6. How much does it cost to travel to and from this frequent activity per day (in NGN)? 6.1. Response:_____ 7. How many times a week (enter number) do you travel to take part in this activity? FFF AFRICA URBAN MOBILITY OBSERVATORY – ROLE OF INFORMAL PARATRANSIT REPORT 7.1. Response:_____ 8. What time do you usually leave home to reach this activity? 8.1. 6am - 7:59am 8.2. 8am - 8:59am 8.3. 9am - 2:59pm 8.4. 3pm - 4:59pm 8.5. 5pm - 5:59pm 8.6. 6pm - 5:59am 9. How long (in MINUTES) does it take you to travel from home to this activity? 9.1. Response:_____ 10. What time do you usually leave the activity to return home? 10.1. 6am - 7:59am 10.2. 8am - 8:59am 10.3. 9am - 2:59pm 10.4. 3pm - 4:59pm 10.5. 5pm - 5:59pm 10.6. 6pm - 5:59am 11. How long (in MINUTES) does it take to return home? 11.1. Response:_____ 12. How do you usually travel to reach this activity? 12.1. Walking Only (skip to 16) 12.2. Cycling Only (skip to 16) 12.3. Own car/motorbike/taxicab (skip to 16) 12.4. Danfo 12.5. Kabukabu 12.6. Moto Taxi/3-wheel Taxi 12.7. LAGBUS 12.8. BRT bus 12.9. Water Ferry 13. How many times do you change vehicles during your journey? 13.1. None (direct route) 13.2. Once 13.3. Twice 13.4. Three times or more 14. How comfortable are the vehicles you usually use when making this journey? 14.1. Poor 14.2. Fair 14.3. Excellent 15. How crowded are the vehicles usually when you make this journey? 15.1. Not crowded 15.2. Fairly crowded 15.3. Very crowded 16. Have you ever been a victim of, or witnessed crime while travelling or waiting for transport in this city? 16.1. No 16.2. Once 16.3. More than once 16.4. Very often 17. Have you ever been a victim of, or witnessed anyone being sexually harassed while travelling or waiting for transport in this city? 17.1. No 17.2. Once 17.3. More than once GGG AFRICA URBAN MOBILITY OBSERVATORY – ROLE OF INFORMAL PARATRANSIT REPORT 17.4. Very often 18. How frequently do public transport vehicles break down during your journey? 18.1. Never 18.2. Sometimes 18.3. Often 19. How would you rate public transport drivers' adherence to road regulations? 19.1. Poor 19.2. Acceptable 19.3. Excellent 20. Is public transport reliable/on time? 20.1. Usually late 20.2. Usually on time 20.3. Always on time 21. What is your highest qualification? 21.1. None 21.2. Primary School 21.3. High School 21.4. College/University/Technical 22. What is your occupation status? 22.1. Employed/Self-Employed 22.2. Full-Time Parent 22.3. Student/Scholar 22.4. Unemployed 22.5. Pensioner 23. What is your monthly household income? 23.1. Under ₦39,999 23.2. ₦40,000 - ₦99,999 23.3. ₦100,000 - ₦199,999 23.4. ₦200,000 - ₦399,999 23.5. ₦400,000 - ₦799,999 23.6. Over ₦800,000 24. Do you have any physical disabilities? 24.1. None 24.2. Sight 24.3. Hearing 24.4. Mobility 24.5. Speech Display: "Thank you for participating" UMA Disaggregation Survey Questionnaire English How old are you? ___ What is your gender? 1) Female 2) Male 3) Other 4) Prefer not to say What is your HIGHEST QUALIFICATION? 1) None 2) Primary School 3) High School 4) College/University HHH AFRICA URBAN MOBILITY OBSERVATORY – ROLE OF INFORMAL PARATRANSIT REPORT What is your OCCUPATION STATUS? 1) Employed/Self-Employed 2) Full-time parent 3) Student 4) Unemployed 5) Pensioner What is your MONTHLY HOUSEHOLD INCOME? 1) ₦0 - ₦39,999 2) ₦40,000 to ₦99,999 3) ₦100,000 to ₦199,999 4) ₦200,000 to ₦399,999 5) ₦400,000 to ₦799,999 6) Over ₦800,000 Do you have any PHYSICAL DISABILITIES? 1) None 2) Sight 3) Hearing 4) Mobility 5) Speech